Style your graphs in Memgraph Lab
In this tutorial, you’ll learn how to use Style script to add style to your graphs in Memgraph Lab. You can run Memgraph and Memgraph Lab on your computer or use Memgraph Cloud.
Step 1 - Connect to Memgraph and load the dataset
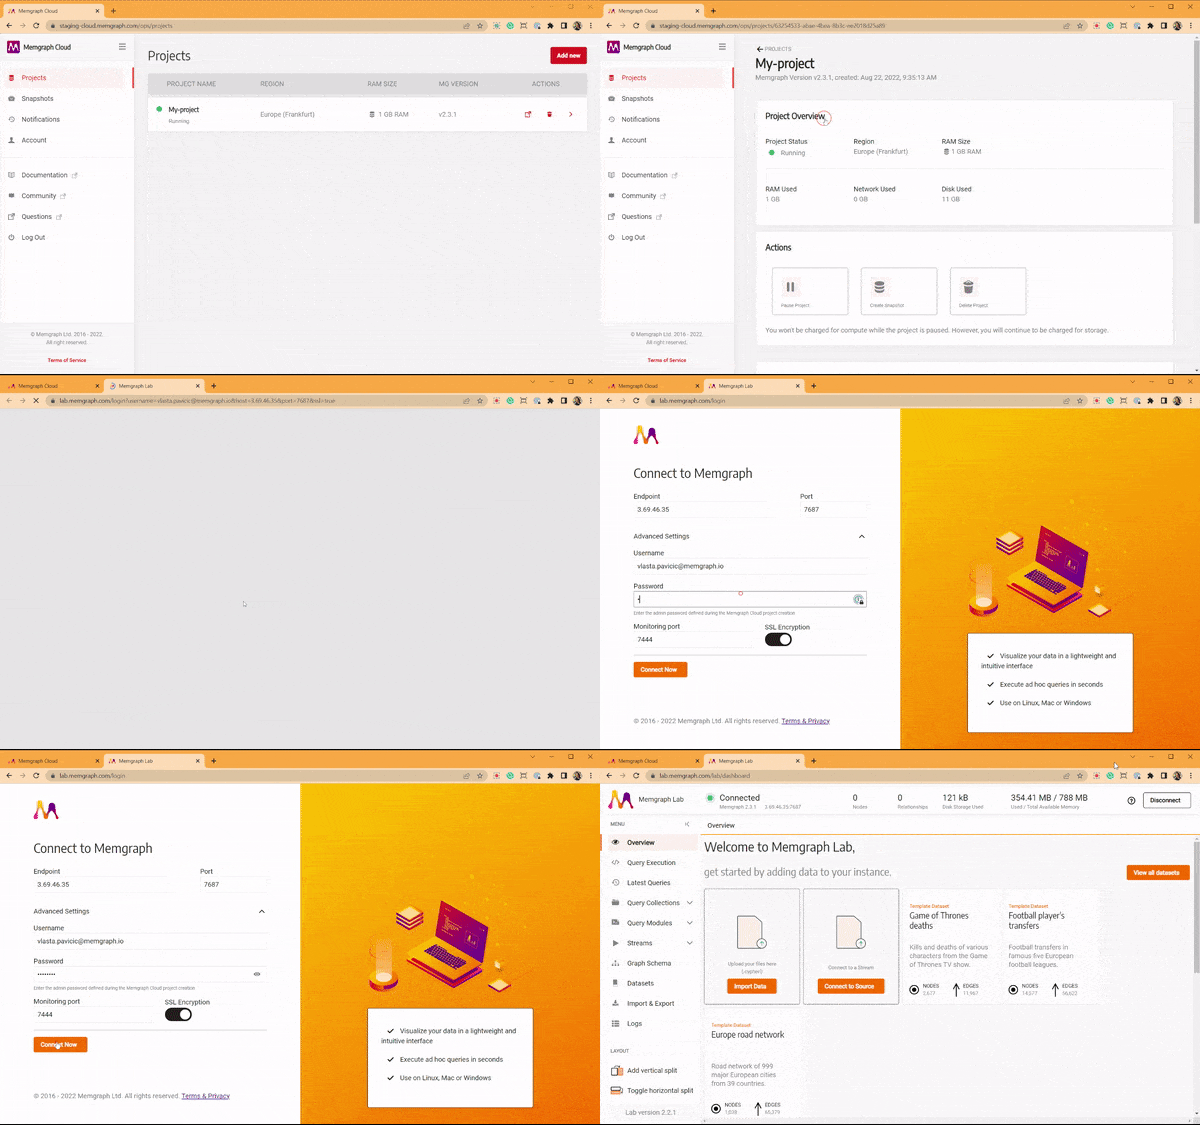
Connect Memgraph Lab to a running Memgraph instance, either on your computer or in Memgraph Cloud, then load the Europe backpacking dataset.
Memgraph on your computer
- Start Memgraph and Memgraph Lab with Docker, as in step 1 of the quickstart.
- Open Memgraph Lab at
http://localhost:3000and connect to Memgraph.
Memgraph Cloud
Memgraph Cloud comes with a 14-day free trial upon registration.
- Sign up to Memgraph Cloud.
- Once you finish the registration, log in and create a new project.
- Open the project and connect to it via Memgraph Lab.
Load the dataset
-
In Memgraph Lab, open Datasets in the sidebar and load the Europe backpacking dataset.
-
Run this query to find the path from Spain to Russia that crosses the fewest borders:
MATCH p = (n:Country {name: "Spain"}) -[r:Borders * bfs]- (m:Country {name: "Russia"}) RETURN p; -
Open the Graph Style Editor tab.
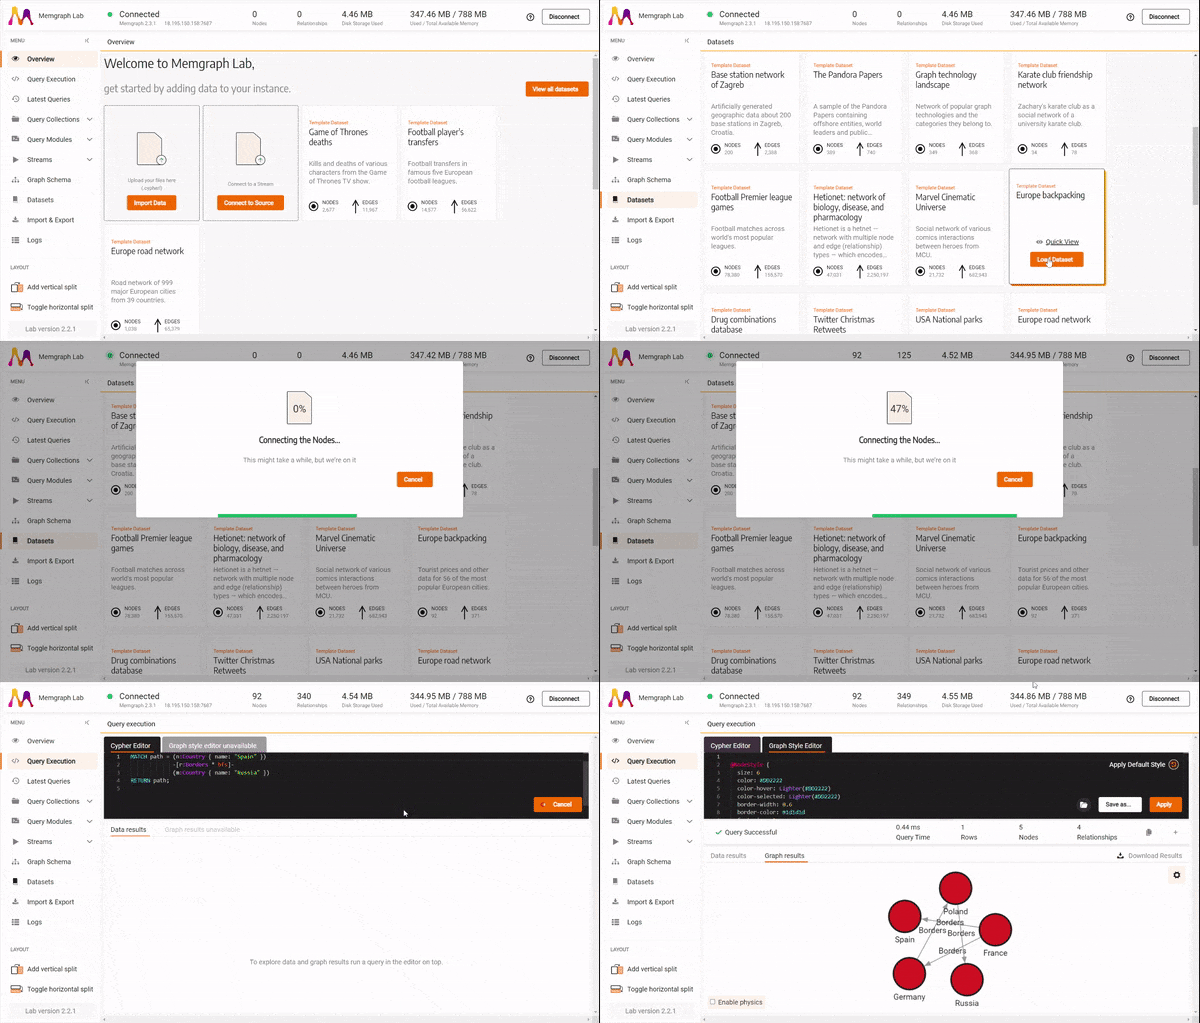
Notice there is code already present in the Graph Style Editor. In the next few steps, you’ll learn how to adjust that code to style your graph using colors and images.
Step 2 - Using colors and borders to style graph nodes
With the Graph Style Editor in front of you, you are ready to style your graph by modifying the existing style and adding some new style rules. First, let’s modify the code that defines the node style. Look for this section of the code:
@NodeStyle {
  size: 50
  border-width: 5
  border-color: #ffffff
  shadow-color: #bab8bb
  shadow-size: 6
}
This part of the code is called a directive, and it is used to define how the node looks and feels.
To start, make the node smaller but with a larger and darker shadow. Update the
values for properties size, shadow-color, and shadow-size. Set the value
of size to 35, shadow-color to #333333, and shadow-size to 20. Your
code should now look like this:
@NodeStyle {
  size: 35
  border-width: 5
  border-color: #ffffff
  shadow-color: #333333
  shadow-size: 20
}
Click Apply to see what your graph looks like now.
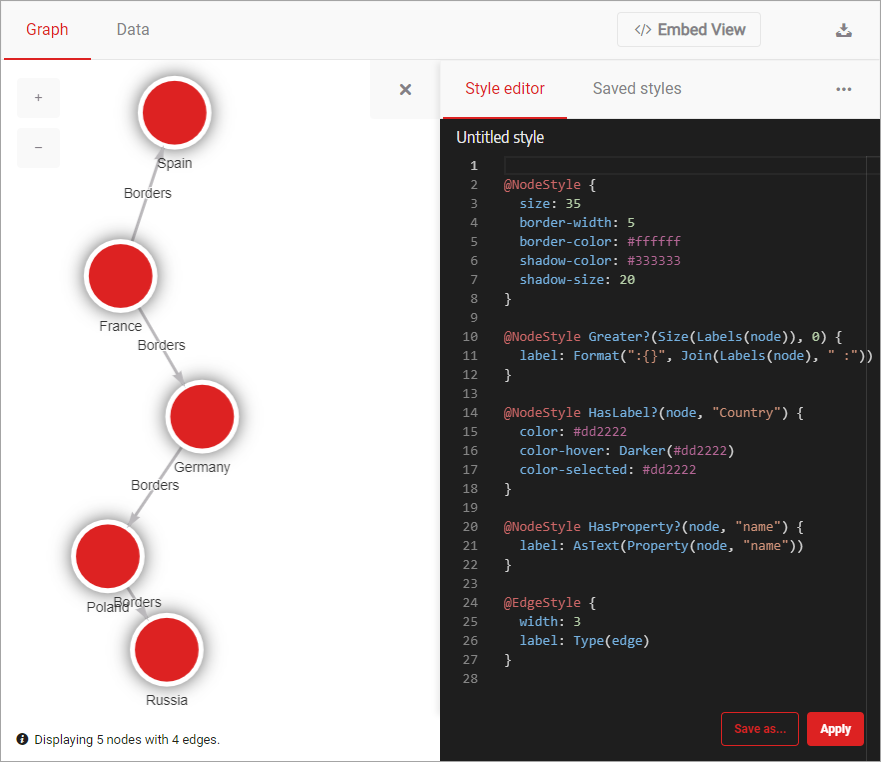
Now change the color of the nodes from red to gold and make them orange on hover. Find the following code:
@NodeStyle HasLabel?(node, "Country") {
  color: #dd2222
  color-hover: Darker(#dd2222)
  color-selected: #dd2222
}
Update value of the property color to #ffd700 and color-hover to
#ffa500. The updated code should look like this:
@NodeStyle HasLabel(node, "Country") {
  color: #ffd700
  color-hover: #ffa500
  color-selected: #dd2222
}
Don’t forget to click Apply to see your updated graph.
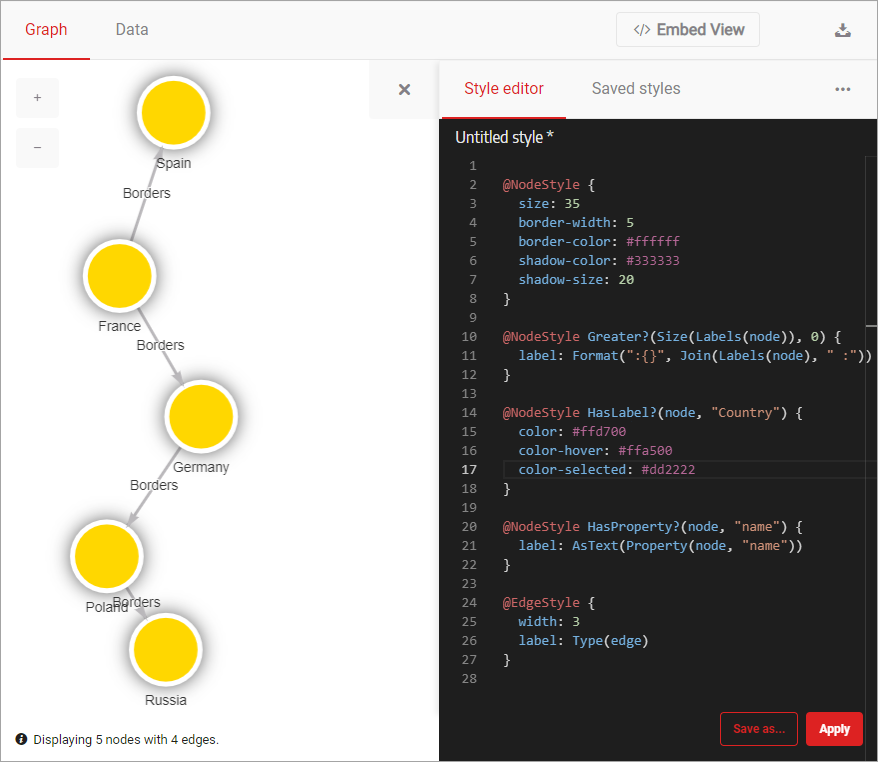
Step 3 - Add images to the nodes
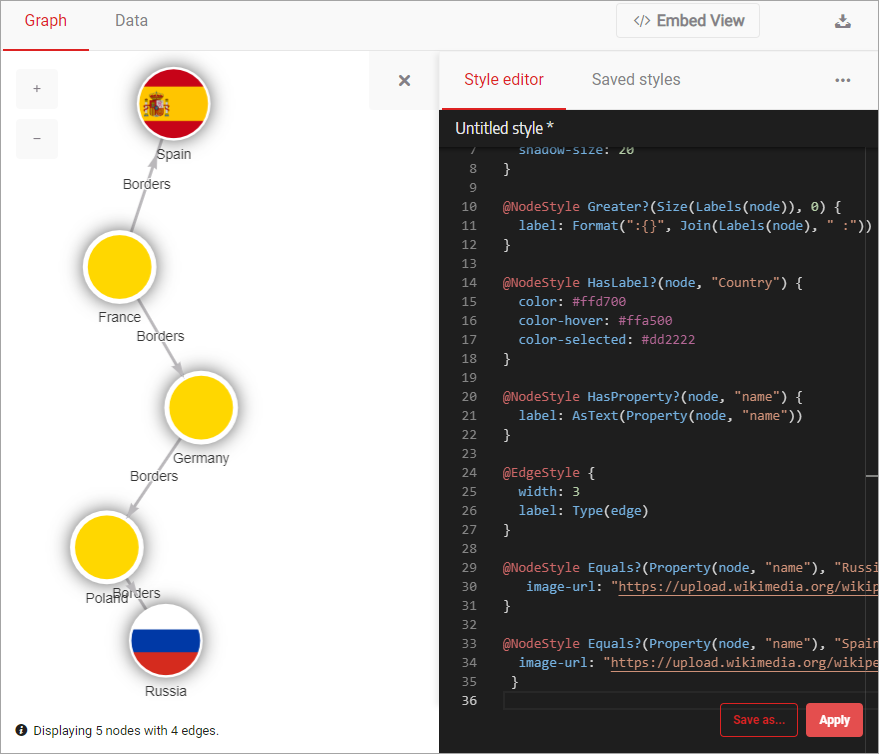
Now that all the colors and borders are just right, it’s time to add images to the nodes. Let’s add them to the first and last node using two different images from Wikipedia. You’ll use a predicate to assign a value to a node with a specific node value.
To display the two images, add the following code at the end of the style script:
@NodeStyle Equals(Property(node, "name"), "Russia") {
   image-url: "https://upload.wikimedia.org/wikipedia/en/thumb/f/f3/Flag_of_Russia.svg/320px-Flag_of_Russia.svg.png"
}

@NodeStyle Equals(Property(node, "name"), "Spain") {
  image-url: "https://upload.wikimedia.org/wikipedia/en/thumb/9/9a/Flag_of_Spain.svg/320px-Flag_of_Spain.svg.png"
 }
Click Apply to update the style of your graph. Your graph is looking better with each step, isn’t it?
Step 4 - Using colors to style graph relationships
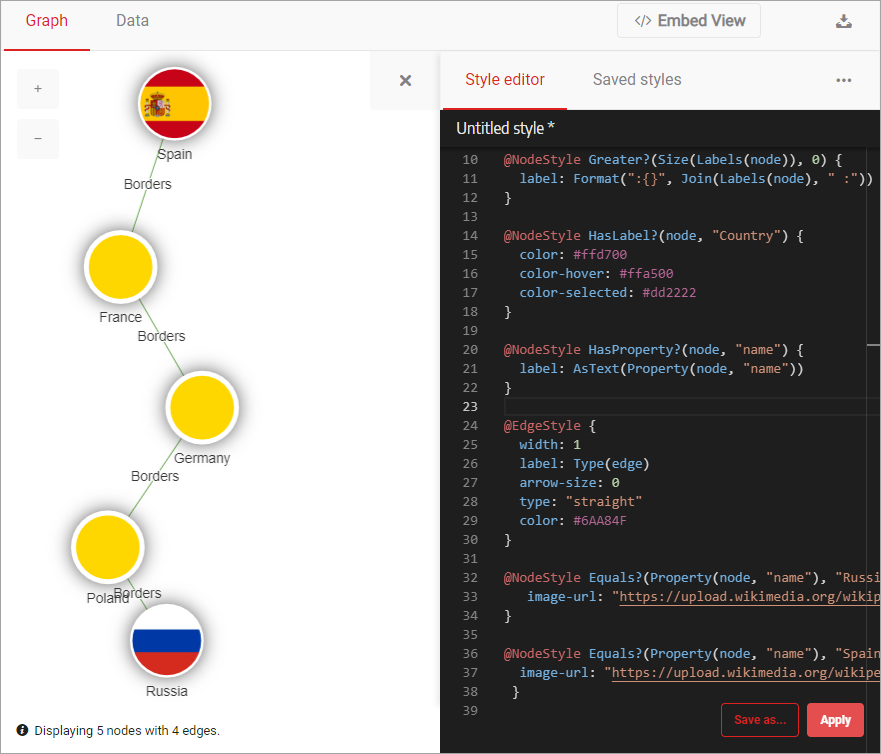
With all of the nodes looking just like you wanted them to, it’s time to style
the relationships between them. You’ll represent your relationships as straight,
thin lines with no arrows. To do that, locate the @EdgeStyle directive and the
following code:
@EdgeStyle {
  width: 3
  label: Type(edge)
}
Now replace that code with this one:
@EdgeStyle {
  width: 1
  label: Type(edge)
  arrow-size: 0
  color: #6AA84F
}
Click Apply and your relationships will have a new style!
Step 5 - Checking the final result
We are at the end of this tutorial. Move the nodes around to get the final look. Your result could look similar to the image below.
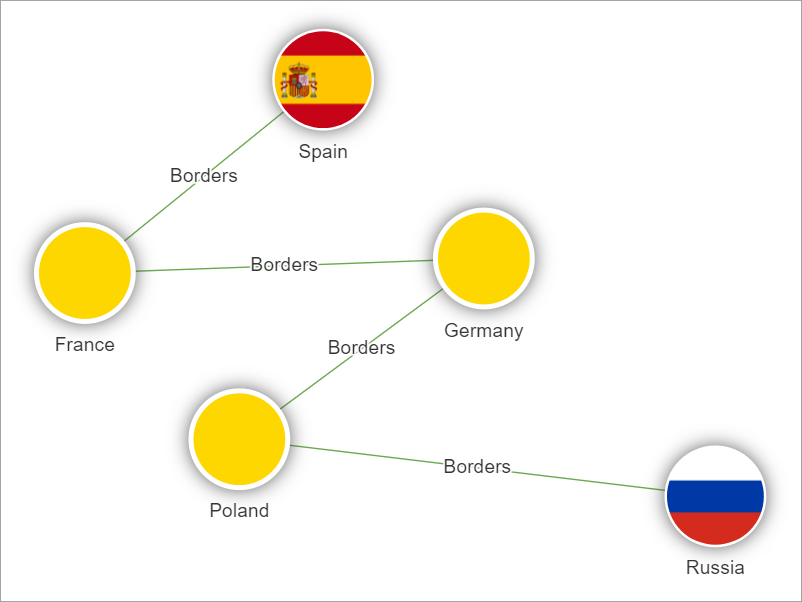
The complete styling code for this graph is:
@NodeStyle {
  size: 35
  border-width: 5
  border-color: #ffffff
  shadow-color: #333333
  shadow-size: 20
}

@NodeStyle Greater(Size(Labels(node)), 0) {
  label: Format(":{}", Join(Labels(node), " :"))
}

@NodeStyle HasLabel(node, "Country") {
  color: #ffd700
  color-hover: #ffa500
  color-selected: #dd2222
}

@NodeStyle HasProperty(node, "name") {
  label: AsText(Property(node, "name"))
}

@EdgeStyle {
  width: 1
  label: Type(edge)
  arrow-size: 0
  color: #6AA84F
}

@NodeStyle Equals(Property(node, "name"), "Russia") {
   image-url: "https://upload.wikimedia.org/wikipedia/en/thumb/f/f3/Flag_of_Russia.svg/320px-Flag_of_Russia.svg.png"
}

@NodeStyle Equals(Property(node, "name"), "Spain") {
  image-url: "https://upload.wikimedia.org/wikipedia/en/thumb/9/9a/Flag_of_Spain.svg/320px-Flag_of_Spain.svg.png"
 }
Use font awesome for node images
Font Awesome is a popular icon library. If you ever
tried to use a font awesome icon as a background image for a node, you might
have noticed you were not able to do that by using the icon directly. Memgraph
Lab doesn’t support SVG format at this time, but it supports PNG, JPEG,
GIF and WEBP formats. Here is a workaround for this problem.
- Find the Font Awesome icon that you want to convert to PNG. Go to the Font Awesome website and locate the icon that you want to use as a node background and download it in SVG format.

- Convert SVG file to PNG with your favorite image editing program, or you can use one of the dozen online services for file conversion.
-
Upload the PNG file to a web server so that you can set it for node background. If you are using an image hosting service, make a note of the URL. Some of those services use URLs unrelated to the image name and are hard to come by at a latter time.
-
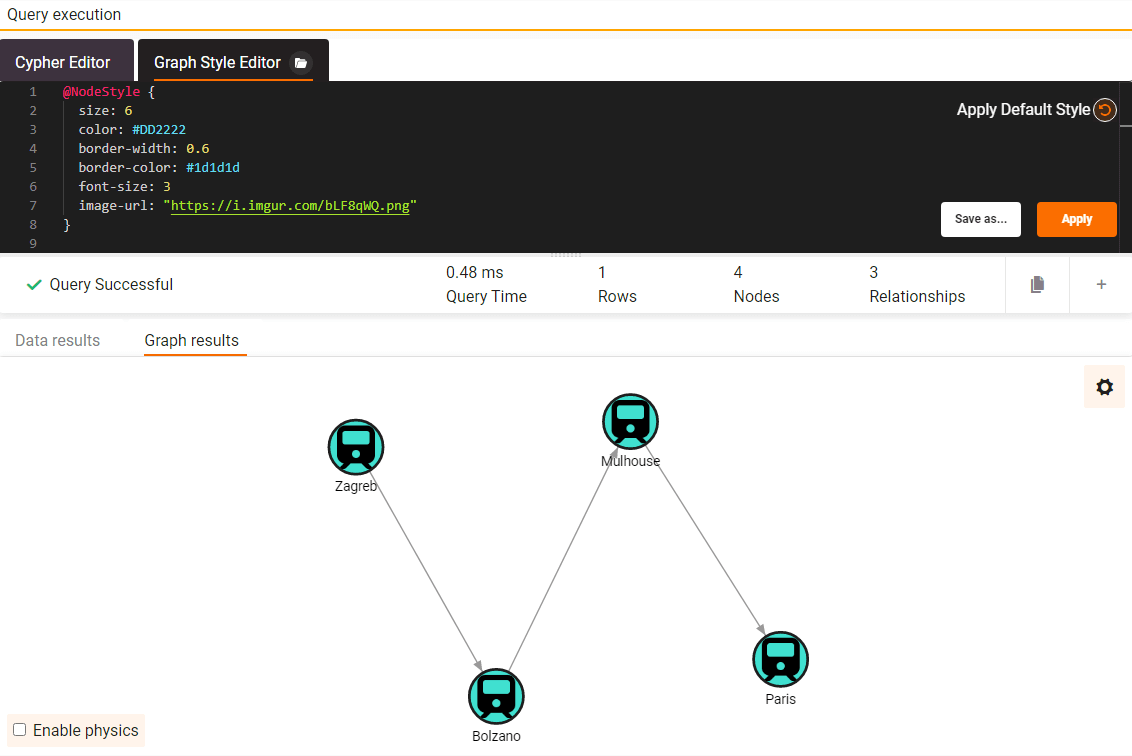
Edit the code of the Graph Style Editor in Memgraph Lab by adding the
image-urlproperty to the@NodeStyleclass. Here is an example:
image-url: "https://i.imgur.com/bLF8qWQ.png"Your @NodeStyle block of code should look something like this:
@NodeStyle {
  size: 6
  color: #DD2222
  border-width: 0.6
  border-color: #1d1d1d
  font-size: 3
  image-url: "https://i.imgur.com/bLF8qWQ.png"
}
You can look at @NodeStyle directive
properties
for additional info on the syntax.
- Apply the style and review changes.
Where to next?
In this tutorial, you’ve learned how to style graphs, nodes and relationships in particular, using Memgraph Lab. To run Memgraph in production, see install Memgraph and deployment.
To get a taste of some more advanced styling features, head to our blog post How to style your graphs in Memgraph Lab. Also, take a deep dive into the Graph Style Script reference guide to learn more about the language.