Querying
Memgraph Lab is a visual interface that simplifies interaction with the Memgraph database. It provides powerful tools for writing, executing, and visualizing Cypher queries with ease. This section covers everything you need to know about querying in Memgraph Lab — from executing queries to customizing graph visuals.
You can run Cypher queries in Memgraph Lab from several sections:
- Query execution: The main Cypher editor for writing and
executing queries. From here, you can:
- Run the selected or entire query.
- Edit the Graph Style Script (GSS) to control how results are visualized.
- Set custom parameters for your queries.
- Share queries with your team.
- View query results as either tabular data or in the graph view, allowing you to inspect nodes, relationships, and paths.
- Access the query summary, which provides query statistics, a runtime breakdown, and insights into the query’s performance.
- Run history: Access and re-run previously executed queries. Each query opens in the Query execution view for further editing or inspection.
- Collections: Run queries embedded in Collections without needing to copy them back into the main editor. Collections offer a seamless query execution experience within a contextual grouping.
- GraphChat - Interact with Memgraph using natural language. GraphChat, based on your input, picks one of the available tools backed by Cypher queries, which you can run directly in your preferred view, leading to the Query execution interface.
Core components
The Query execution section is the primary interface for working with Cypher in Memgraph Lab. It includes:
- Cypher editor – Write, edit, run or share your Cypher queries.
- Graph Style editor – Customize the visual style of your graph results.
- Parameters editor – Define and manage query parameters.
- Query status bar – View real-time feedback on query status and performance.
- Query results panel – Visualize and inspect the returned graph or tabular data.
- Query summary – Get a breakdown of execution details, including runtime and metadata.
Cypher editor
The Cypher editor is the interface for writing and executing queries in Memgraph Lab. If you need help writing Cypher queries, check out the Querying section in Memgraph documentation.

It features a code suggestion tool that can help you with clause completion and give information about signatures and parameters.

Run query
The Run query button executes the entire query written in the editor. This is the standard method for running complete Cypher queries and retrieving results from the database.
Once you Run a query (by clicking a button or pressing CTRL/CMD + Enter), you can Cancel it to terminate the transaction.
Run selected
Run selected allows you to execute only a highlighted portion of your query. It is particularly useful for testing and debugging specific segments of complex queries without running the entire script. By selecting the desired portion and clicking “Run Selected”, you can isolate and evaluate individual components of your query.

If you encounter a request limit error Uh oh! Something unexpected went wrong. Please try again or contact Memgraph support. Details: request entity too large
, you can try increasing the request limit with the environment variable
REQUEST_BODY_LIMIT_MB. The default value is 20, which means 20MB.
To change this setting, follow the instructions provided in the Configuration section.
Share query
Query sharing allows users to create a shareable link for their Cypher query, Graph Style Script, and query parameters with a single click. This enables seamless collaboration among team members. You can share the full or selected query.
Graph Style editor
In the Graph Style editor you can customize the graph results visualization using the custom scripting language developer by the Memgraph team - Graph Style Script (GSS). With GSS, you can customize various visual aspects of your graph, including node colors, sizes, shapes, and relationship styles. This level of customization enables you to create tailored visual representations that align with your analytical needs.

When saving a style, the graph results of an executed query will be used as a preview picture of the style. Custom styles can be defined as a default style applied to all following query runs.
Parameters
Memgraph Lab supports the use of parameters within queries to enhance efficiency. By defining parameters, you can write queries that accept variable inputs without altering the query structure. For example:
MATCH (n {property: $value})
RETURN n;
In this query, $value is a parameter that can be assigned different values at
runtime. Utilizing parameters not only makes your queries more adaptable but
also improves performance by enabling query plan caching.

Query status bar
The Query status bar in Memgraph Lab provides real-time feedback and essential information about your query results.

The bar shows the following:
- Query execution status - When the query has executed or failed, below the Cypher editor, you can see a Query successful message or an error.
- Execution times - Memgraph execution time (ms), with the option to click the information icon for a full breakdown. This detailed view shows how much time Memgraph Lab spent fetching results from the database and how much was spent displaying them in the UI.

- Returned objects count - The query status bar also shows the number of rows the query generated as well as nodes and relationships count the query returned (if any).
By default, Memgraph Lab displays a maximum of 5000 rows per query result.
If your query exceeds this limit, you’ll see an indication that the results shown have been truncated. The status bar will also show the actual total row count your query would return. If needed, you can adjust this maximum row display limit in the Lab settings at any time.

- Query actions - From the Query status bar you can also copy the query to your clipboard or add it to an existing or new collection.
When executing multiple queries simultaneously, the status bar allows you to navigate through each result set, ensuring you can efficiently manage and analyze multiple outputs.

Execution times
In the case of successful execution, the Lab returns the query execution times - how much it took Lab to send the query to Memgraph and show results, and how long it took Memgraph to execute the query.
The Lab full roundtrip time indicates the total time from sending the query to receiving and rendering the results in Memgraph Lab. This metric is crucial for understanding the overall efficiency of your query execution and result retrieval process.
The Memgraph execution time displays the time taken by Memgraph to execute the query, helping you assess performance. For insights into optimizing execution time, see the querying best practices guide.
Query results
Memgraph Lab offers versatile options for viewing and analyzing query results, catering to different analytical needs. Depending on the results generated by the query, Memgraph Lab offers two results views:
- Data results - Presents results in a tabular format, displaying nodes, relationships, and their properties in a structured manner. This view is ideal for detailed data inspection and is particularly useful when dealing with large datasets where a graphical representation may be overwhelming.
- Graph results - Renders results as a graph visualization, illustrating the nodes and relationships returned by the query. This view is beneficial for understanding the structural and relational aspects of your data.
Besides different results views, you can see the Summary of the executed query, copy or download the results in the JSON, CSV or TSV format and summary in the JSON format. You can also go fullscreen for better visilibility of the results.
Table rows can be expanded to show additional information about entities.
Graph results
Memgraph Lab utilizes the Orb library created by the Memgraph team for high-performance graph visualizations, ensuring a smooth and interactive experience.

When rendering a graph that exceeds the set rendering limits, which might take considerable amount of time to preview, you will be asked if you want to proceed with the graph visualization or switch to the data view. The rendering limit can be set in the Settings section.
Exploring the graph
When results are shown as a graph, you can click on each node or relationship to see additional information in a property sidebar.

You can also Expand a node to see its relationships, Collapse a node to hide its relationships, or Hide the node from the canvas. Besides clicking on a node and then on the button, you can also expand and collapse nodes with a double-click.

Moreover, you can use the search bar above the graph to quickly find nodes by name. As you type, matching nodes appear in the results list, and hovering over or selecting one will highlight it directly on the graph.
Editing and removing nodes or relationships
Memgraph Lab empowers you to not only visualize your graph, but also manage both its structure and data straight from the interface:
- Edit node: Click on a node, then select Edit node in the sidebar to modify labels or properties. Changes are instantly written back to the database.
- Remove node: Select a node and use the Remove node action. This deletes the node and all connected relationships from the database.
- Edit edge: Click a relationship, then choose Edit edge in the sidebar. You can change the relationship type or edit its properties; updates are immediately saved in the database.
- Remove edge: Choose an edge and use Remove edge to delete it both from the visual graph and from the database itself.
These actions make it easy to iteratively refine your graph data model and content as you explore, all without leaving the visualization.
Note: The ability to edit or remove nodes and edges from the visualization is available only in Memgraph Lab version 3.11 or newer.
Graph customization
To customize the appearance of the graph you can update the GSS in the Graph Style editor or change the Display options in the property sidebar which you can access by clicking on a graph object you’d like to customize.
Display options offers you the ability to change the color or text on display for the selected graph object or all the graph objects with the same label or of the same type.
In the bottom left corner of the graph, you can change the graph layout. The available layout types are:
- Force layout (default)
- Tree layout
- Map layout
Force layout (Default) simulates physical forces between nodes. You can Enable physics, which allows nodes to interact dynamically - pulling apart or drawing closer based on the strength of their relationships.
In the top right corner, under Graph Preferences, you can configure:
- Collision radius - sets the margin radius around each node from its center.
- Repel force - defines how strongly nodes repel each other.
- Link distance - determines the minimum distance required between two connected nodes.

Tree layout organizes nodes in a hierarchical structure. You can choose the orientation: horizontal or vertical.
Additional customization options:
- Level gap - sets the spacing between different levels of hierarchy.
- Node gap - sets the spacing between nodes on the same level.

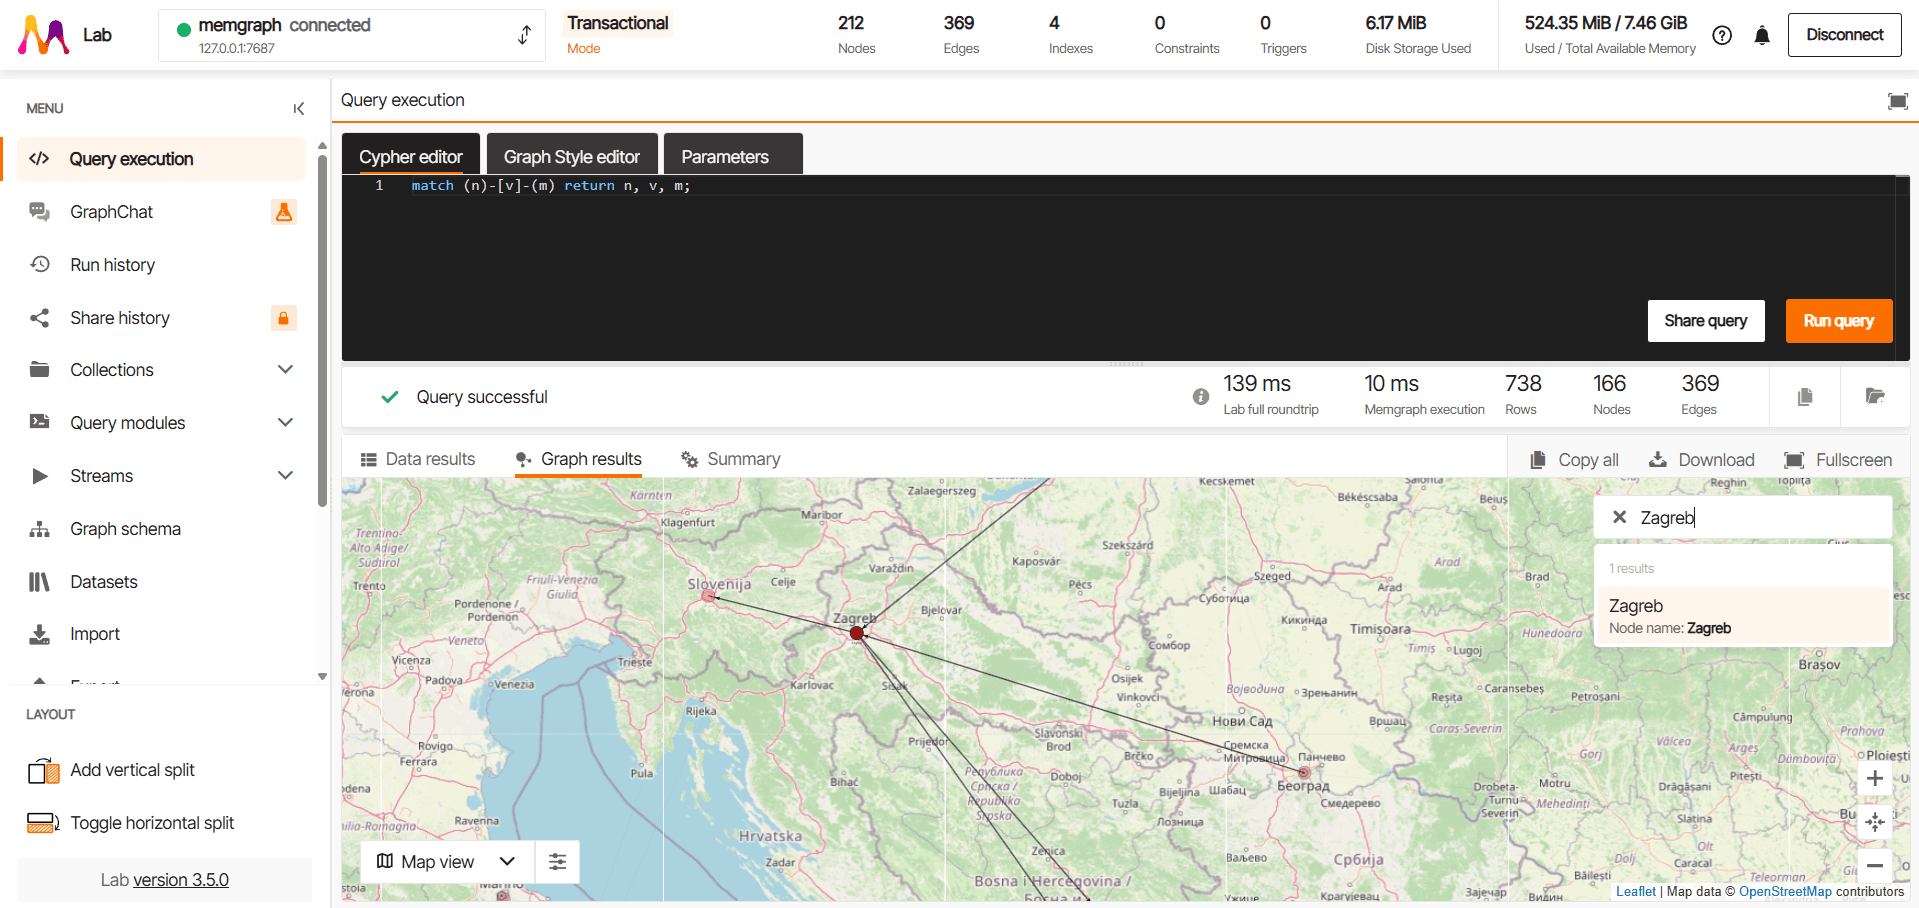
Map layout is enabled only if nodes contain geographical information. It
activates automatically when result nodes include numeric lat and lng
properties.
Nodes are positioned on a map according to their geographical coordinates.

If latitude and longitude data are not stored in the default lat and lng
properties, you can use a Graph Style Script (GSS) to map alternative fields for
location tracking. For example:
// nodes have .latitude and .longitude fields
Define(LATITUDE_FIELD, "latitude")
Define(LONGITUDE_FIELD, "longitude")

// In the case of numeric latitude and longitude properties, set them up for a switch to a map view
@NodeStyle And(IsNumber(Property(node, LATITUDE_FIELD)), IsNumber(Property(node, LONGITUDE_FIELD))) {
  latitude: Property(node, LATITUDE_FIELD)
  longitude: Property(node, LONGITUDE_FIELD)
}
Query summary
After executing a query in Memgraph Lab, the query summary provides essential metadata and insights into the execution process. This summary helps users evaluate the performance, efficiency, and impact of their queries.

The query summary shows important information involving:
- Database impact statistics: Displays key database impact metrics such - the number of hops traversed, the number of nodes and relationships created or delete, the number of labels added or removed, and the number of properties set.
- Query performance breakdown (ms): For complex queries, Memgraph Lab provides an execution plan that breaks down how the query was processed by the database. This is the visual representation of the execution times from the Query status bar. Having this kind of query performance breakdown can help users optimize performance by identifying potential bottlenecks.
- Server - Information about the server address, Bolt protocol version used by the server, and the database name upon which the query was running (useful in multi-tenant environments).
- Notifications - If there are potential issues with the query, such as missing indexes or inefficient query patterns, Memgraph Lab will provide notifications and recommendations for optimization. For detailed guidelines on query optimization, read the querying best practices.
- Query plan and profile - Analyze how a query is executed by showing detailed information about the query plan in a simple diagram. Additionally, profile the query to understand the impact of each operator. This can help you identify performance issues and speed up queries.