How to Style Your Graphs in Memgraph Lab
With the new version of Memgraph Lab comes a ton of options for customizing the visual display of query results. With the new scripting language, graphs can look almost any way you want. In this blog post a selection of features will be presented, but to explore the full power of the new scripting language, please consult the documentation.
Introduction
When using the graph view of the query results in Memgraph Lab it would be great to customize the display. It is now possible to do exactly that with the new scripting language. Style properties (size, color, label,...) of nodes and edges to be displayed can be set by defining style rules.
Rules can apply to all nodes or edges or a filter can be specified to apply the rule only to specific nodes or edges. Following rules will color all nodes green and all edges blue.
@NodeStyle {
  color: forestgreen
}

@EdgeStyle {
  color: dodgerblue
}
Imagine we have some nodes with label Important. We might want to color those
nodes red. This can be achieved by adding a filter after rule name. Here we are
checking if a node has label Important. Only if this is true, the node will be
colored red.
@NodeStyle HasLabel(node, "Important") {
  color: red
}
If two rules define conflicting values for a style property, the rule defined later has the higher precedence (like CSS). In the following example, all nodes will be colored blue.
@NodeStyle {
  color: forestgreen
}

@NodeStyle {
  color: dodgerblue
}
Adding custom styles
To showcase the new features of Memgraph Lab it is best to use an example. We
will be working with a graph of various cities worldwide. You can download all the nodes and relationships from here
(instructions for importing Cypher data can be found here).
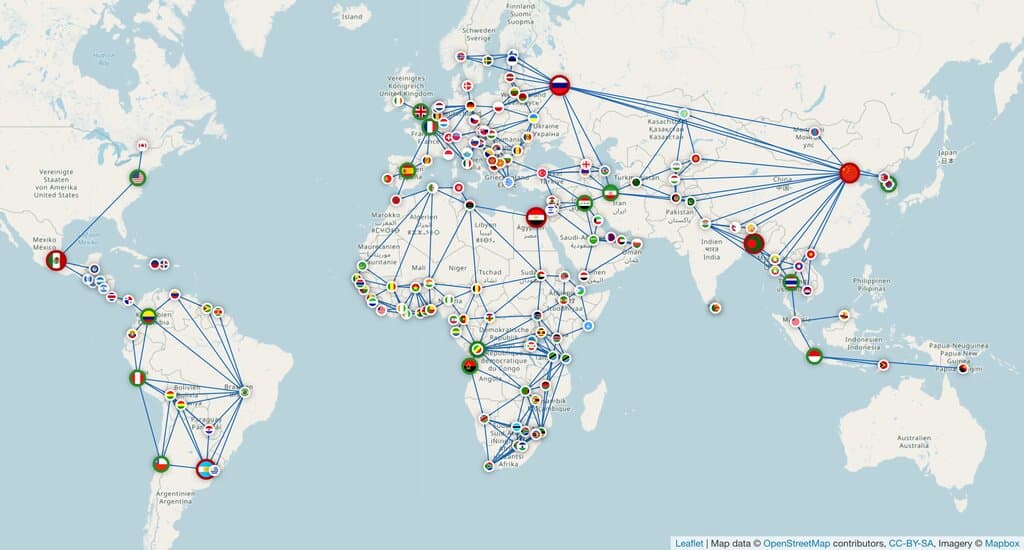
Since all nodes have lat and lng (latitude and longitude) properties,
Memgraph Lab will show them on the map by default.
To change the style in which the nodes are drawn, we will open the style editor in Memgraph Lab and from there we can add our own custom style rules using the new scripting language.
To make the nodes look nicer, we can add a white border, and a little bit of shadow. This rule will apply to all nodes because no filter is specified.
@NodeStyle {
  border-width: 4
  border-color: white
  shadow-color: black
  shadow-size: 30
}
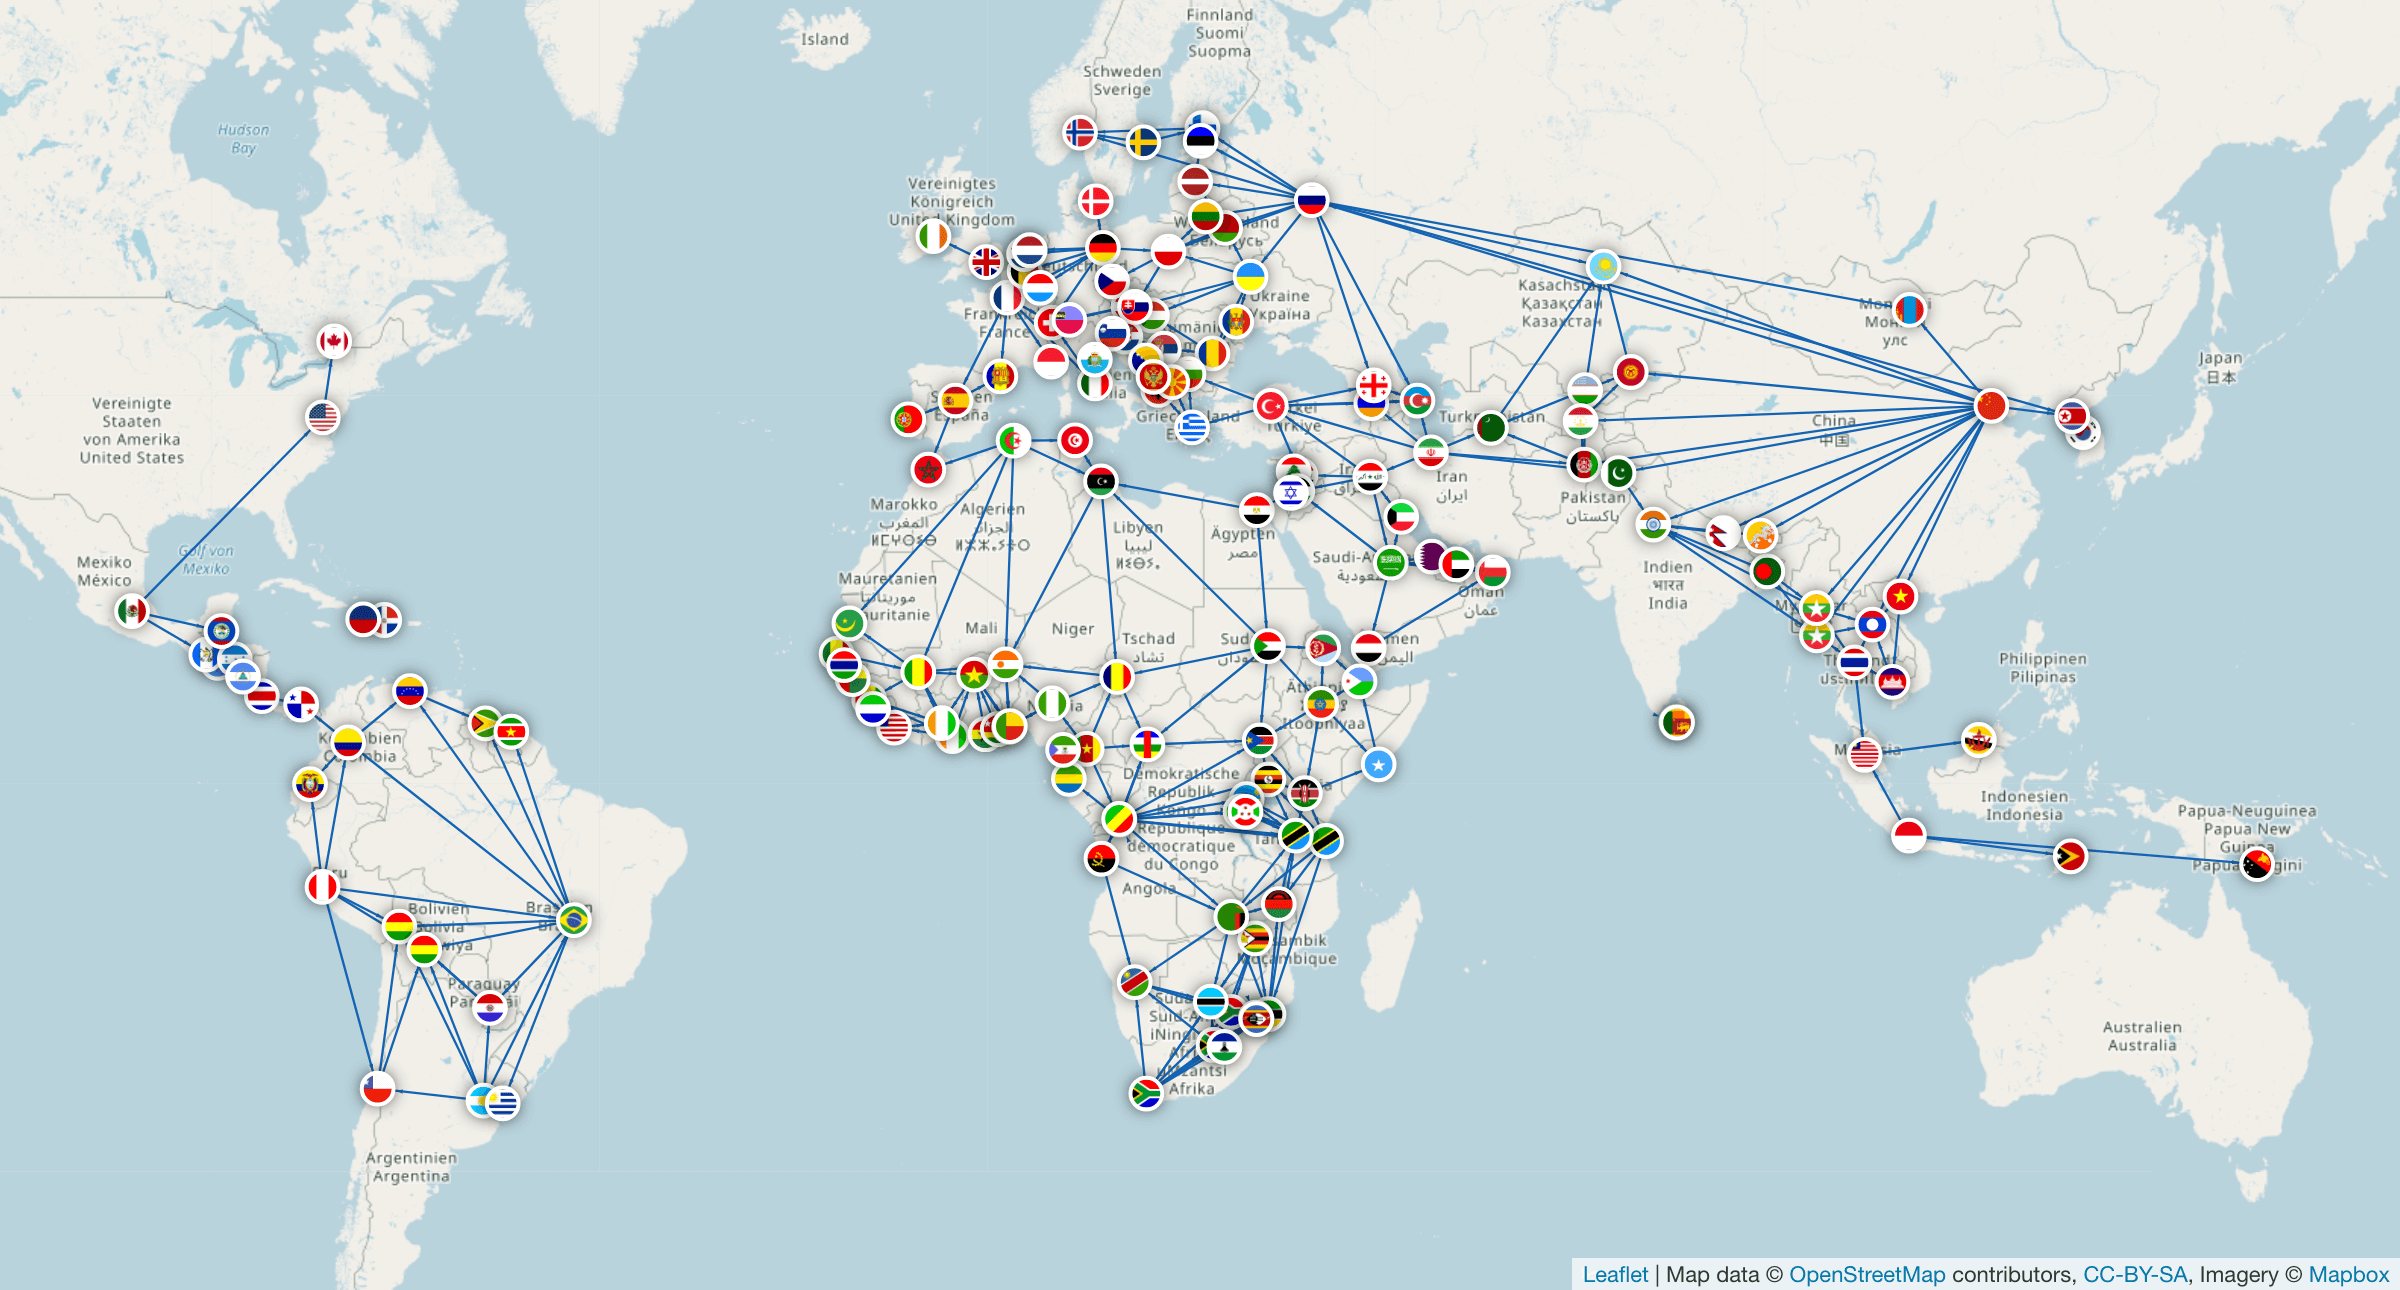
It would be nice to make nodes visually distinguishable. This can, for example,
be achieved by displaying flag images inside the nodes. Fortunately, in this
example, each node has a property flag. The value is the URL of the flag image
of the country in which the city is located. We can display those flags in drawn
nodes in the following way.
@NodeStyle {
  image-url: Property(node, "flag")
}
Memgraph Lab now displays the following graph.
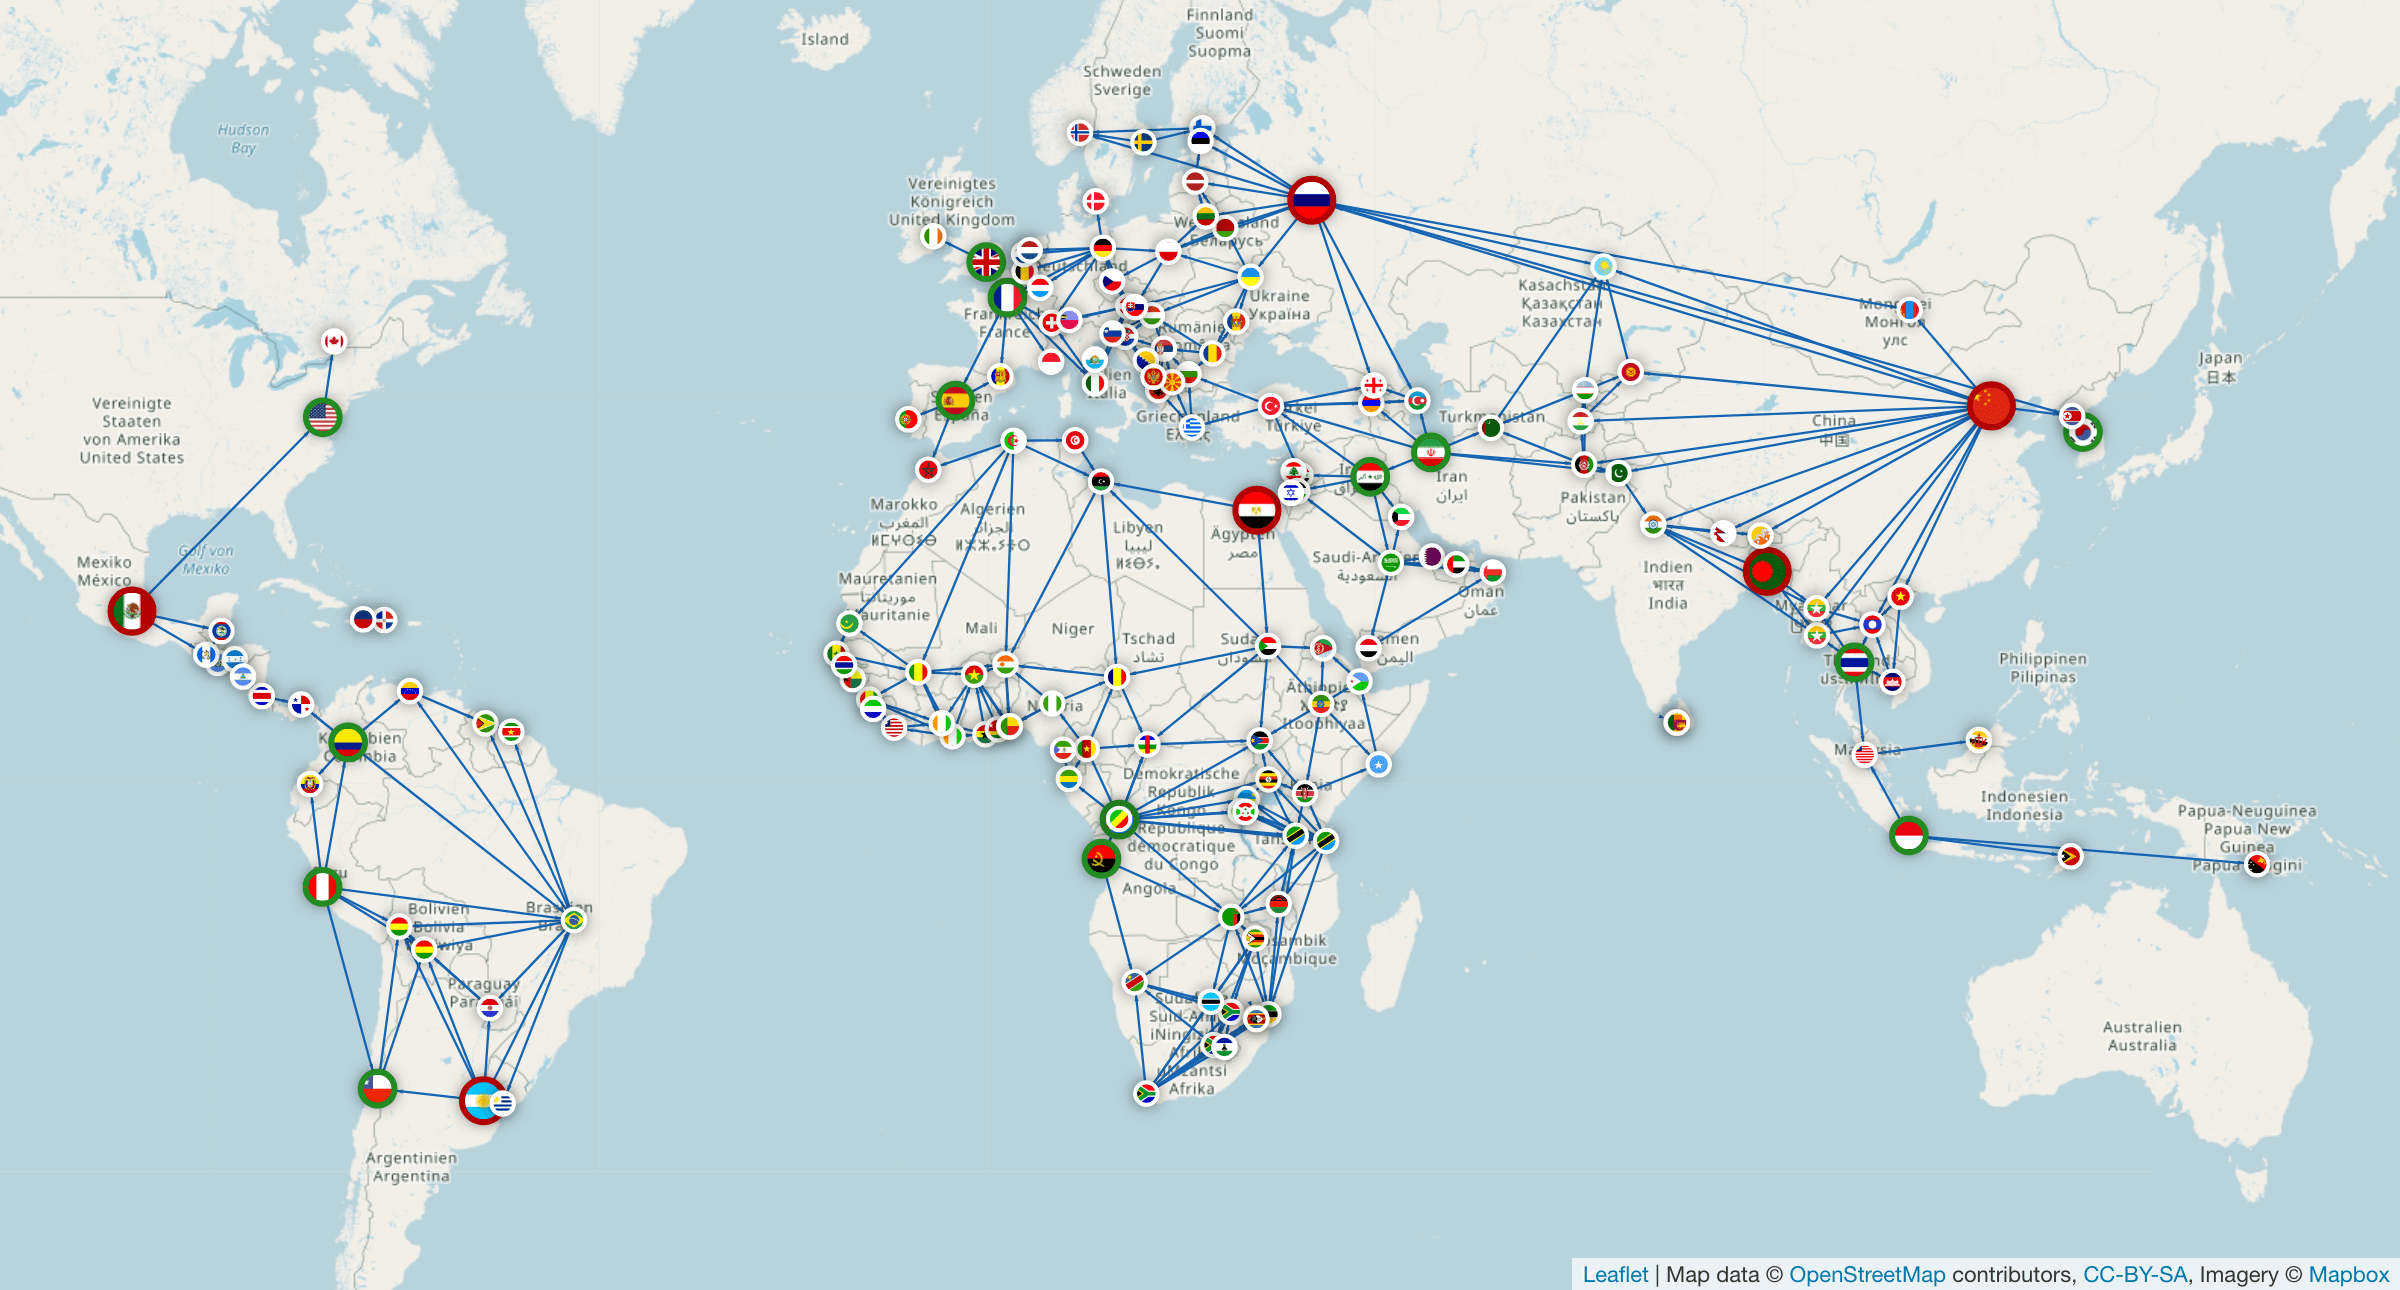
Each node also has the property population. We can use that to highlight big
cities. To achieve that we can add the following rules. Here both rules have a
filter after the rule name. This way defined rules only apply to nodes for which
the filter is true.
@NodeStyle Greater(Property(node, "population"), 5000000) {
  border-color: forestgreen
  border-width: 6
  size: 30
}

@NodeStyle Greater(Property(node, "population"), 10000000) {
  size: 40
  border-color: Darker(red)
}
This is the result we get. All the large cities now have a bigger size and a thicker border. Cities with more than 5M population have a green border and cities with more than 10M population have a red border.
Power of the styling scripting language (optional)
To show the power of the new scripting language, we can make all nodes have different sizes, according to their cities population. If we make the node size proportional to the population, some nodes will be just too big, and some will be barely visible at all. To make the differences less extreme we can use the square root function (alternatively). At the time of writing, the square root function is not a builtin function, but the language is powerful enough to implement square root from scratch using Newton's method.
We can define the following functions to implement the square root function.
Define(abs, Function(x, If(Less(x, 0), Sub(0, x), x)))

Define(newtonSqrt, Function(a, x0, Do(
  Define(f, Function(x, Sub(Mul(x, x), a))),
  Define(df, Function(x, Mul(2, x))),
  If(Less(abs(f(x0)), 0.001),
    x0,
    newtonSqrt(a, Sub(x0, Div(f(x0), df(x0))))))))

Define(sqrt, Function(x, newtonSqrt(x, 1)))
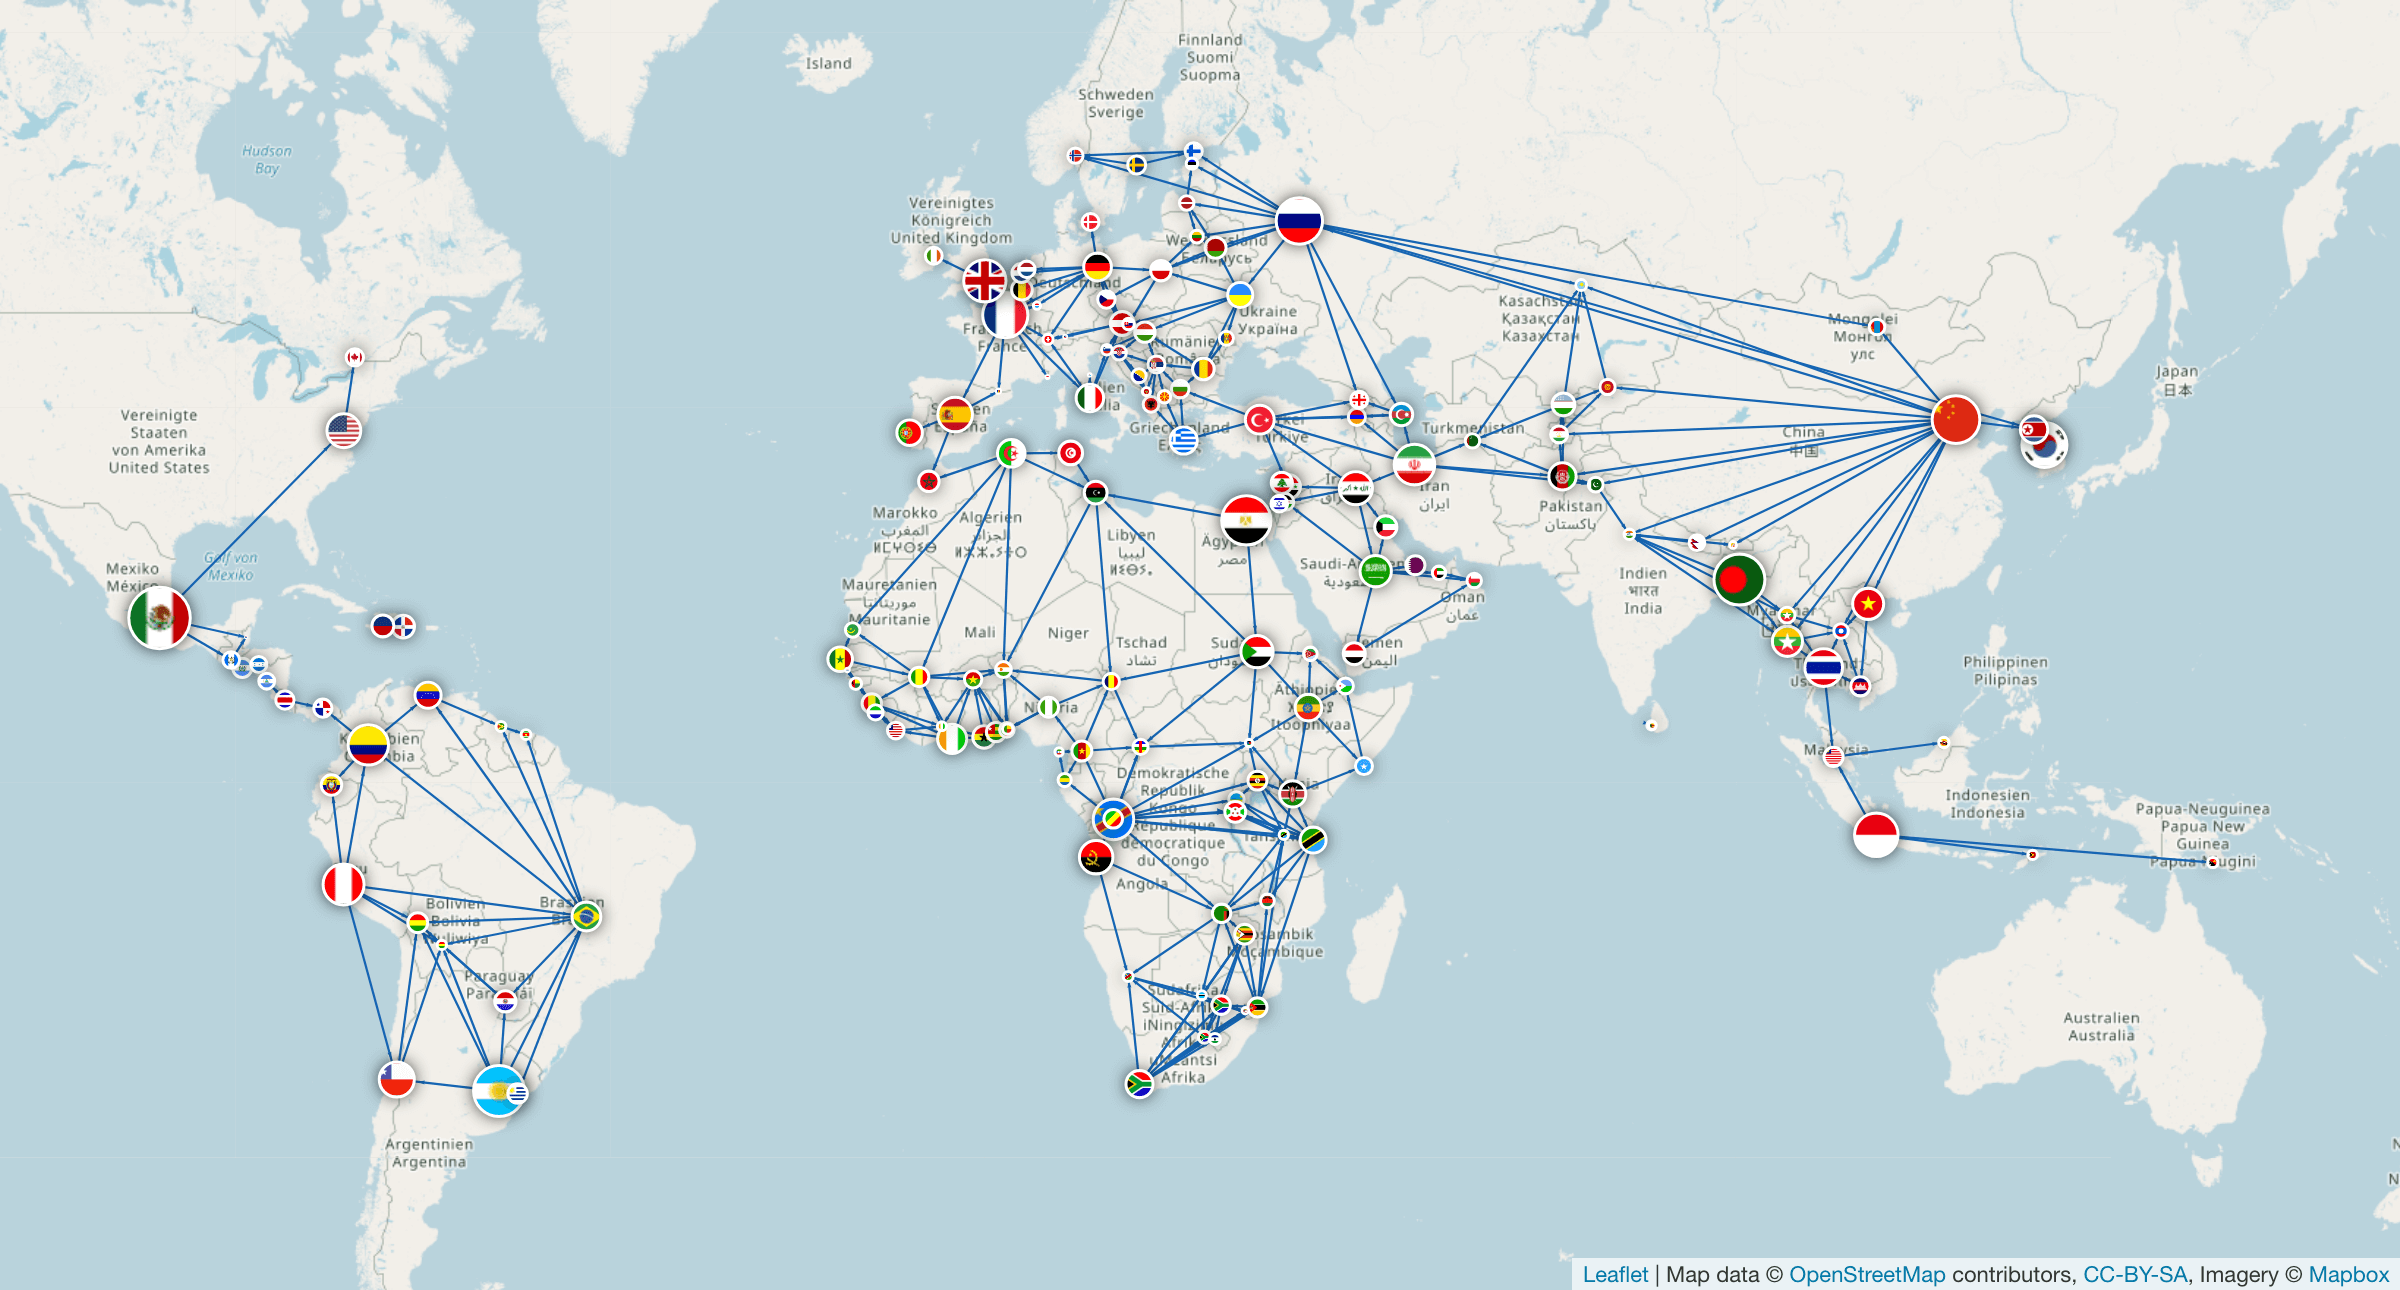
We can now make the node size depend on the square root of the city population.
@NodeStyle {
  size: Mul(0.01, sqrt(Property(node, "population")))
}
Memgraph Lab now displays the following graph. Larger cities are drawn with larger nodes.
Exploring graphs by styling
Aside from creating beautiful visual representations of graphs stored in Memgraph database, the new scripting language can be used for exploring data as well. Once Memgraph Lab has loaded the query result in the form of a graph, it almost feels like it's possible to run subqueries through the styling scripting language. This will become more clear in the following example.
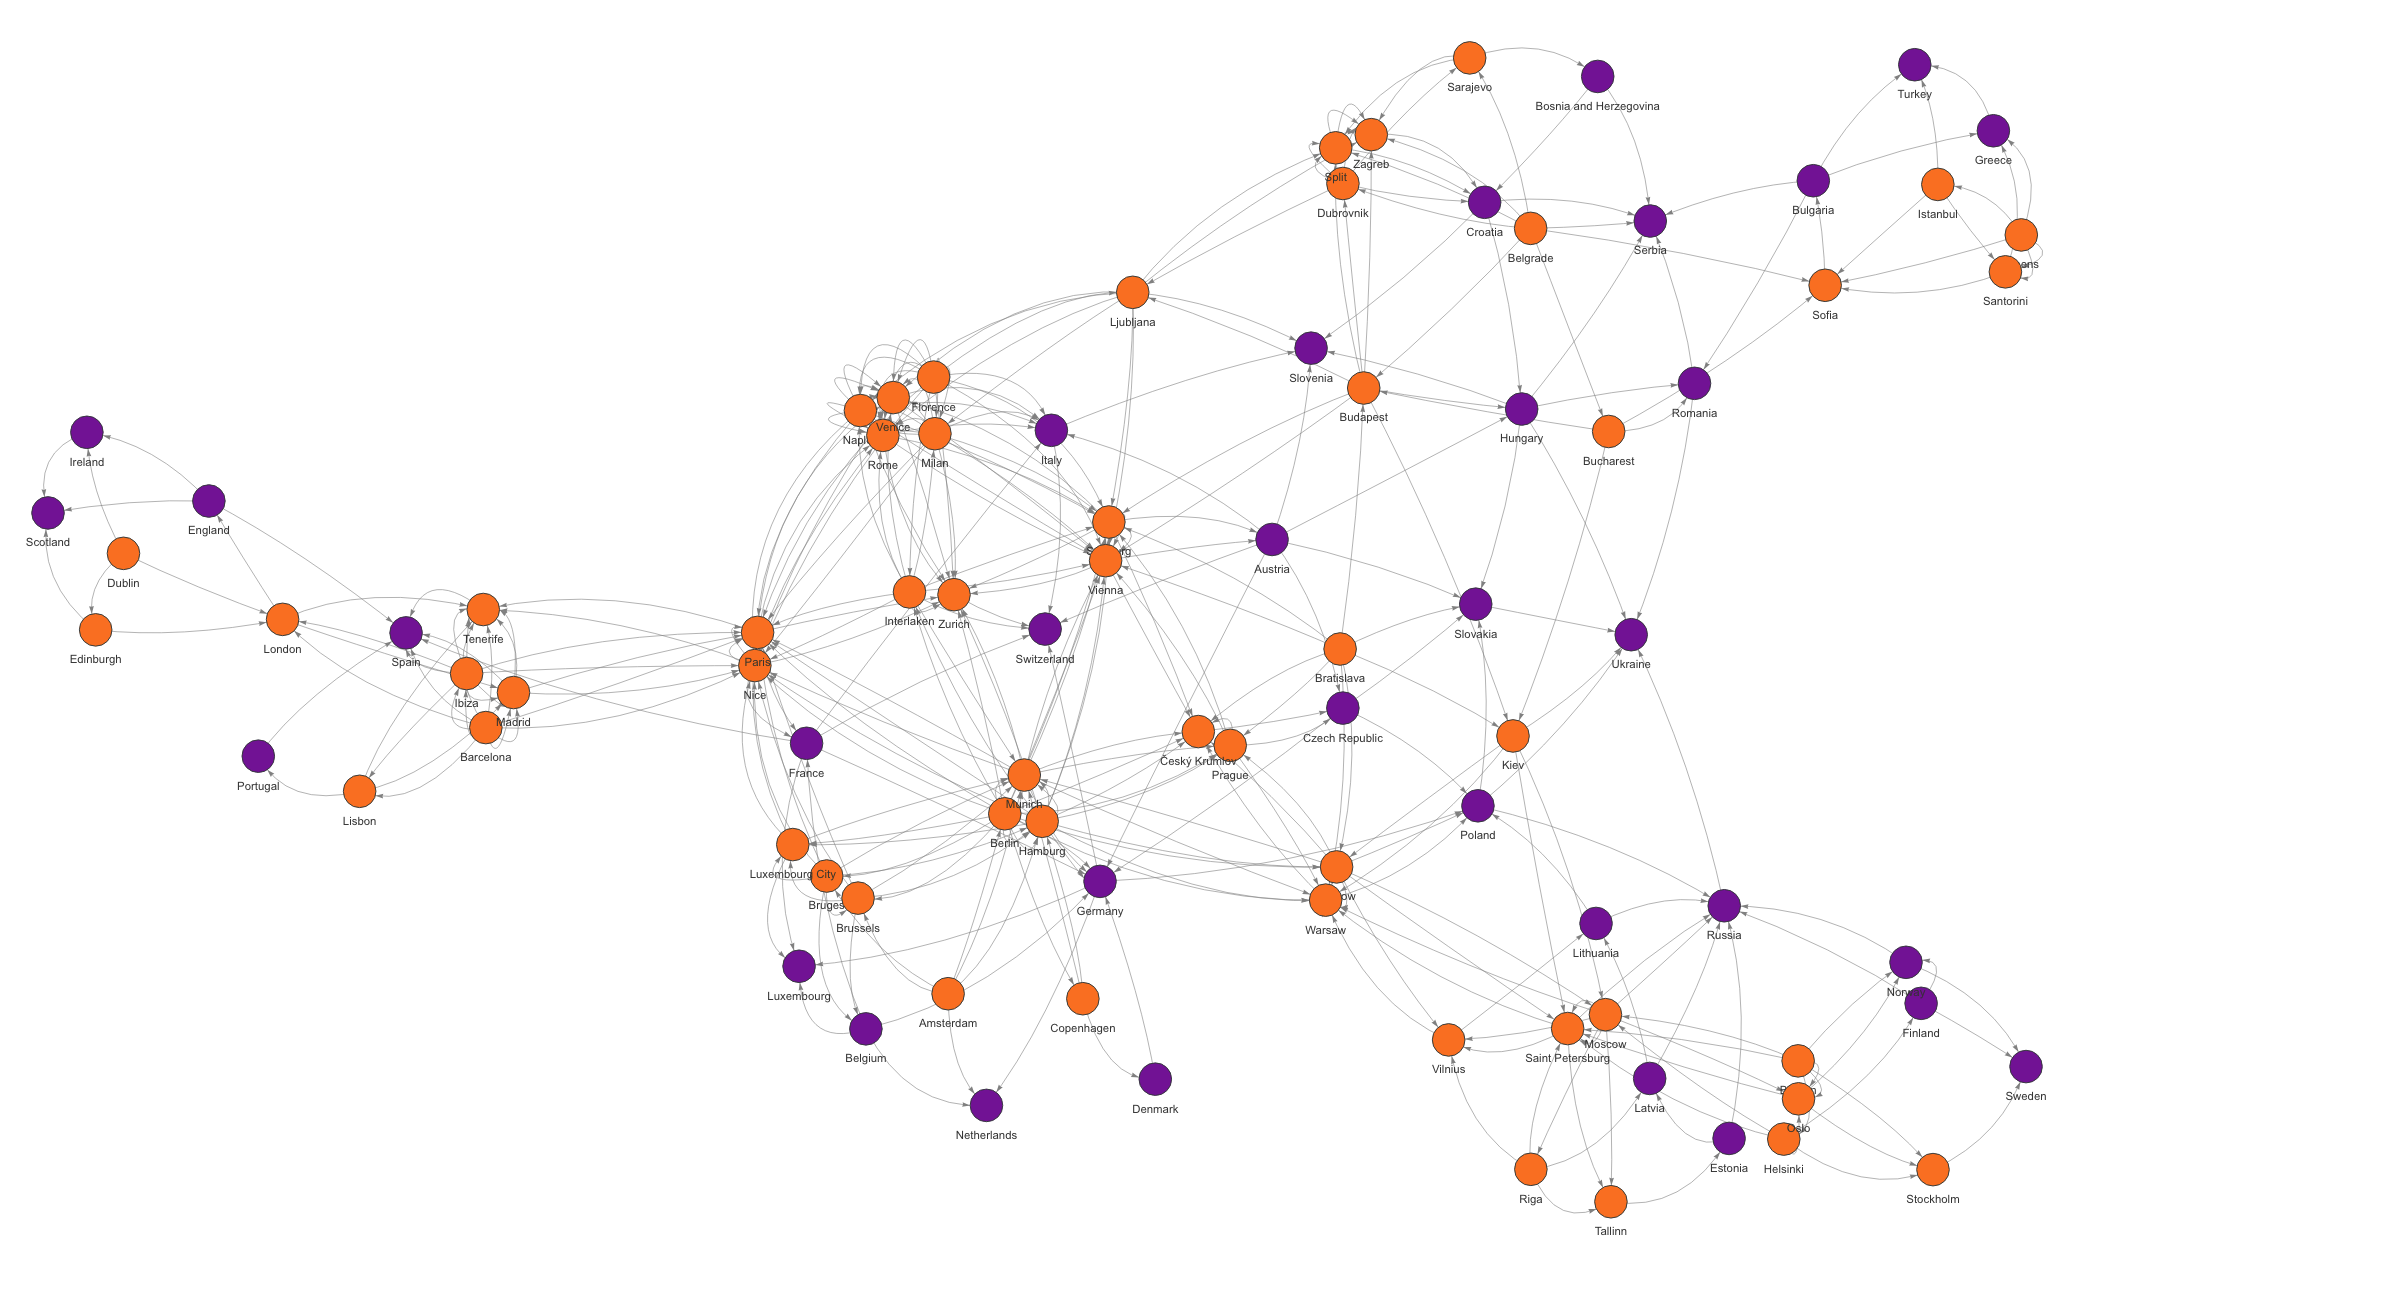
We will use the graph from Backpacking Through Europe tutorial. Various European countries and cities are stored in the database, along with information useful to tourists while planning trips, like prices of food and drinks. After running a query that returns all nodes and edges stored in the database, Memgraph Lab presents the following graph.
Suppose we are interested in cities where drinks or food are cheap. (City nodes
have properties drinks_USD and meals_USD.) To make things simpler we will
first define two functions: cheapDrinks? and cheapFood?. It is a convention
to end a name of a function that returns a boolean with a question mark. Both
functions take a node as the only argument and check the price of drinks/meals
in that node. If the price is less than a threshold, the returned value is true.
There might be nodes without drinks_USD/meals_USD property, so it is smart
to check if a node has a property before accessing it.
Define(cheapDrinks?, Function(node,
  And(HasProperty(node, "drinks_USD"),
      Less(Property(node, "drinks_USD"), 7))))

Define(cheapFood?, Function(node,
  And(HasProperty(node, "meals_USD"),
      Less(Property(node, "meals_USD"), 15))))
We can now define the following style rules to highlight the cities we are
interested in. We are using functions defined above to make the filtering of
nodes clearer. We can also add food and drink prices to node labels for easier
data inspection. (City nodes have properties drinks_USD and meals_USD.)
@NodeStyle cheapDrinks(node) {
  color: gold
  size: 30
  label: Format("{}/ndrinks: {}",
                Property(node, "name"),
                Property(node, "drinks_USD"))
}

@NodeStyle cheapFood(node) {
  color: dodgerblue
  size: 30
  label: Format("{}/nmeals: {}",
                Property(node, "name"),
                Property(node, "meals_USD"))
}

@NodeStyle And(cheapDrinks(node), cheapFood(node)) {
  color: forestgreen
  size: 40
  label: Format("{}/ndrinks: {}/nmeals: {}",
                Property(node, "name"),
                Property(node, "drinks_USD"),
                Property(node, "meals_USD"))
}
Memgraph Lab now shows us the following graph.
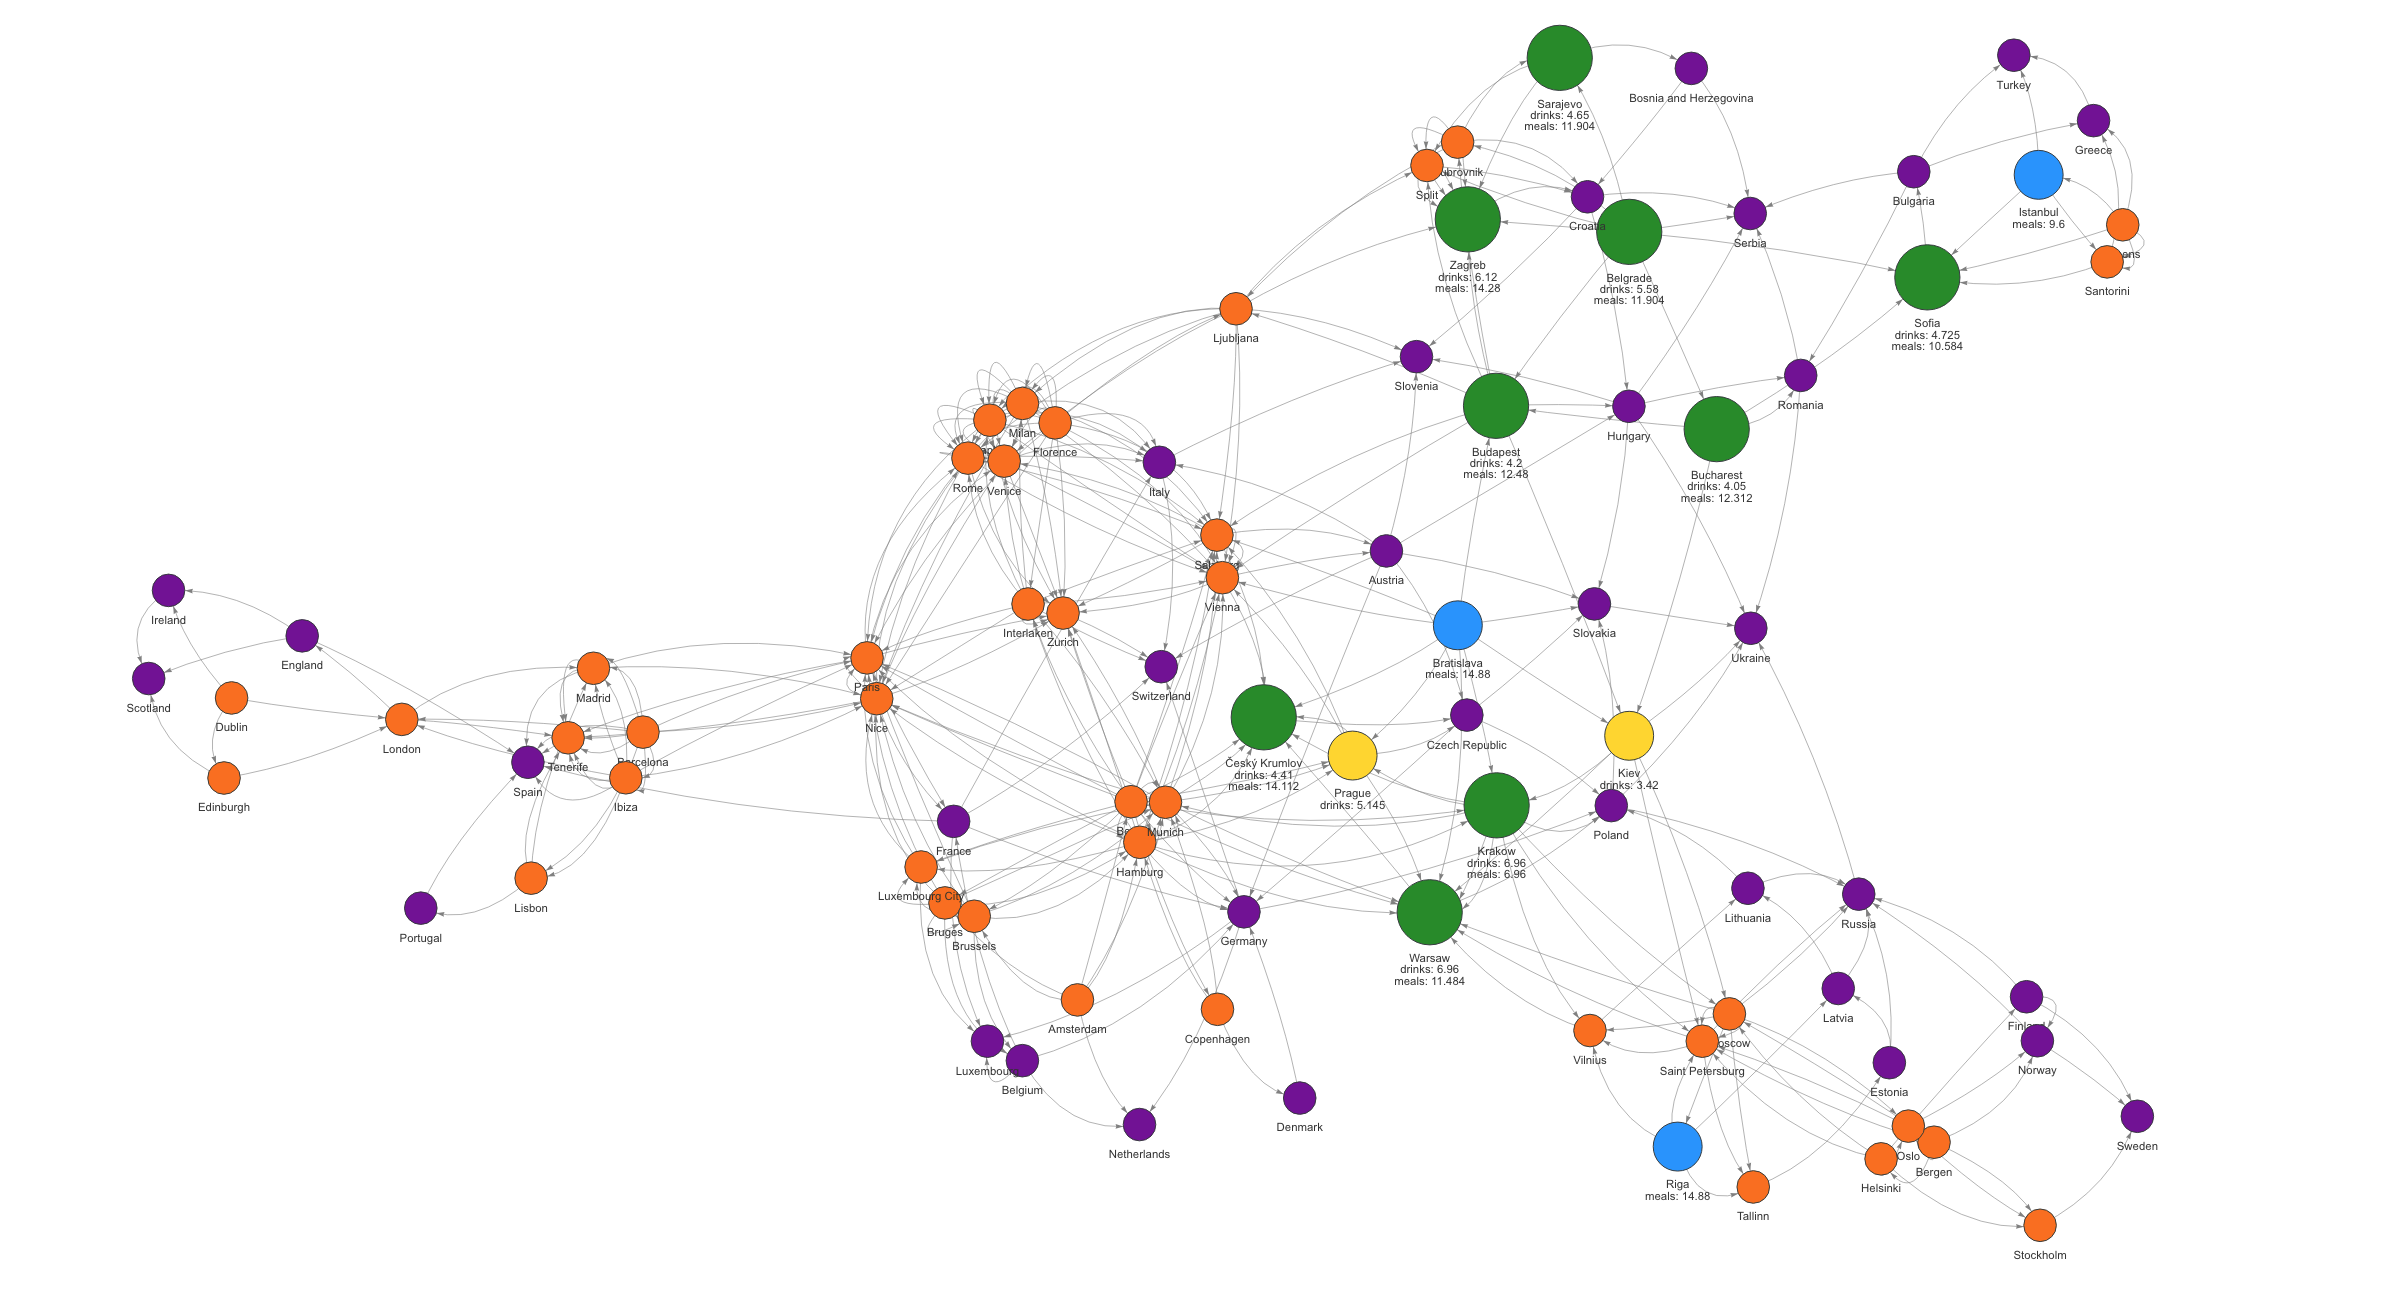
Cities with low drink price are shown in yellow, cities with low food price are shown in blue, and cities with low drink price and low food price are shown in green.
In this example, we have used the styling scripting language not only to make
the graph look better, but also to understand the data better. Filters after
style rules (in this case cheapDrinks(node) and cheapFood(node)) are used
to select specific nodes. This works almost like adding conditions to Cypher
queries, but with one large benefit: this way we can also see the relationships
of "selected" nodes to other parts of the graph.
Next steps
The best way to fully experience the new features of Memgraph Lab is to download it right away (instructions can be found here) and start playing around with the new scripting language. The possibilities are endless.