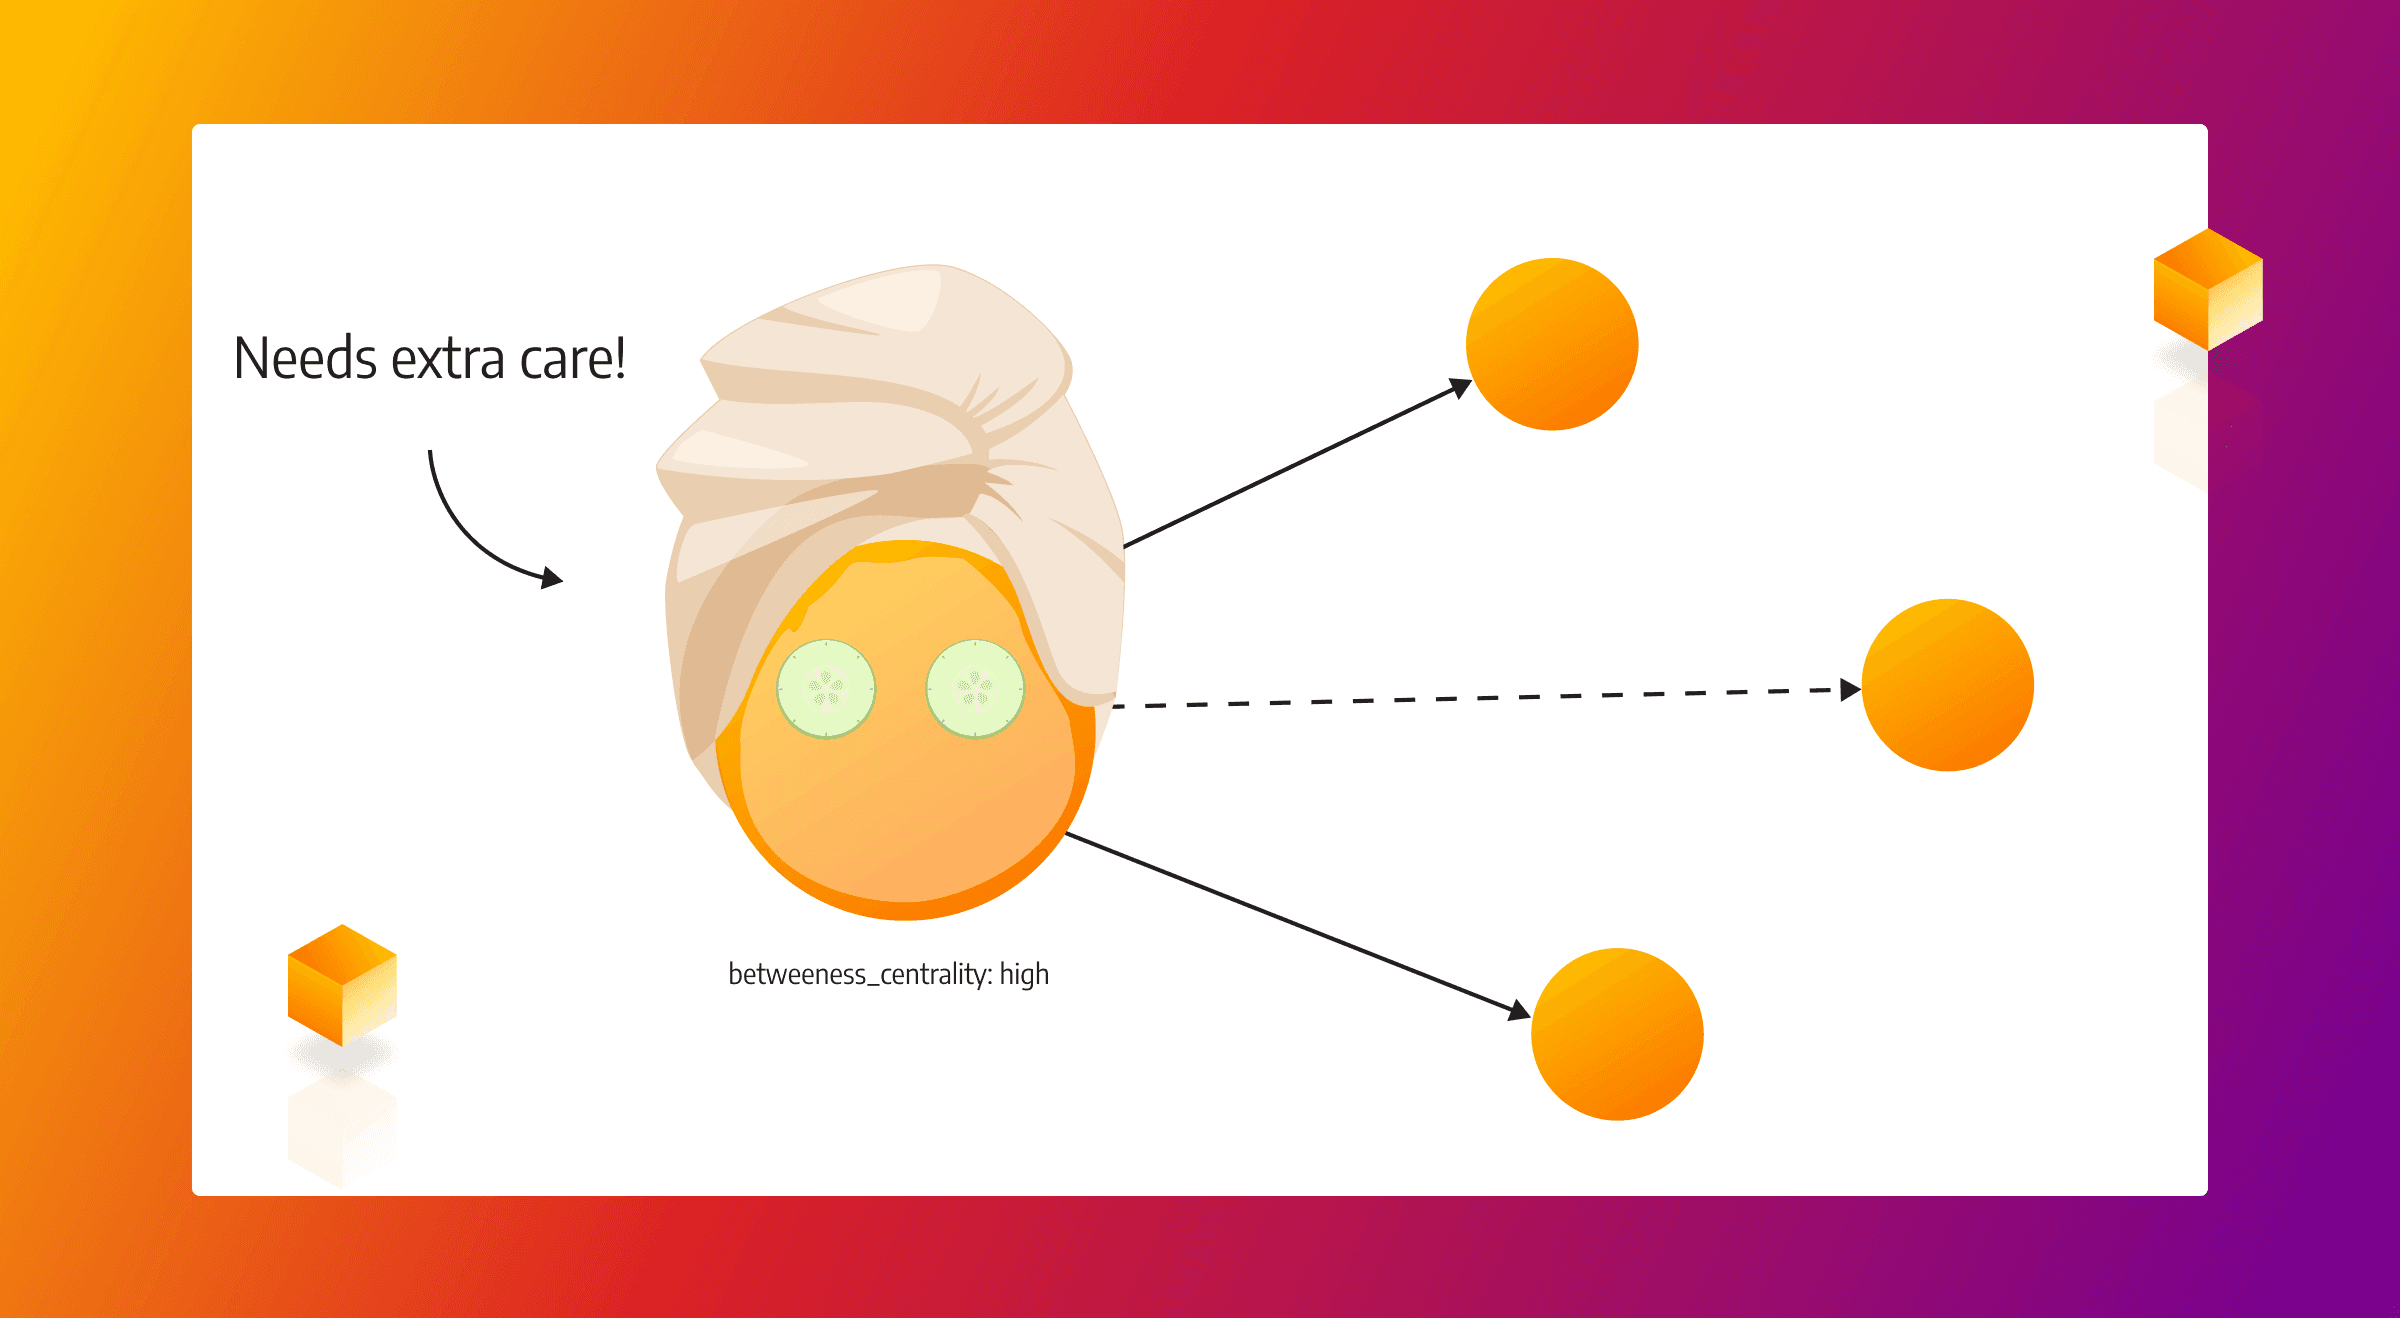
Why Are Nodes With a High Betweenness Centrality Score High Maintenance
Each process or network has very important resources you need to take extra care of - whether it’s that crucial piece of data, the unicorn dev you hired, or an expensive piece of infrastructure. Consequently, every graph dataset has very important nodes. Some nodes are important in the way they are crucial to the successful performance of your system, but some (sometimes those exact same) nodes are important because if they fail, they can wreak havoc.
To find out which nodes in a network are important based on the topological structure of the network and thus relevant to its success or ruin, run a centrality analysis of the nodes in your graph database.
Centrality analysis measures
Centrality analysis can be done using measures that examine node degrees or short paths.
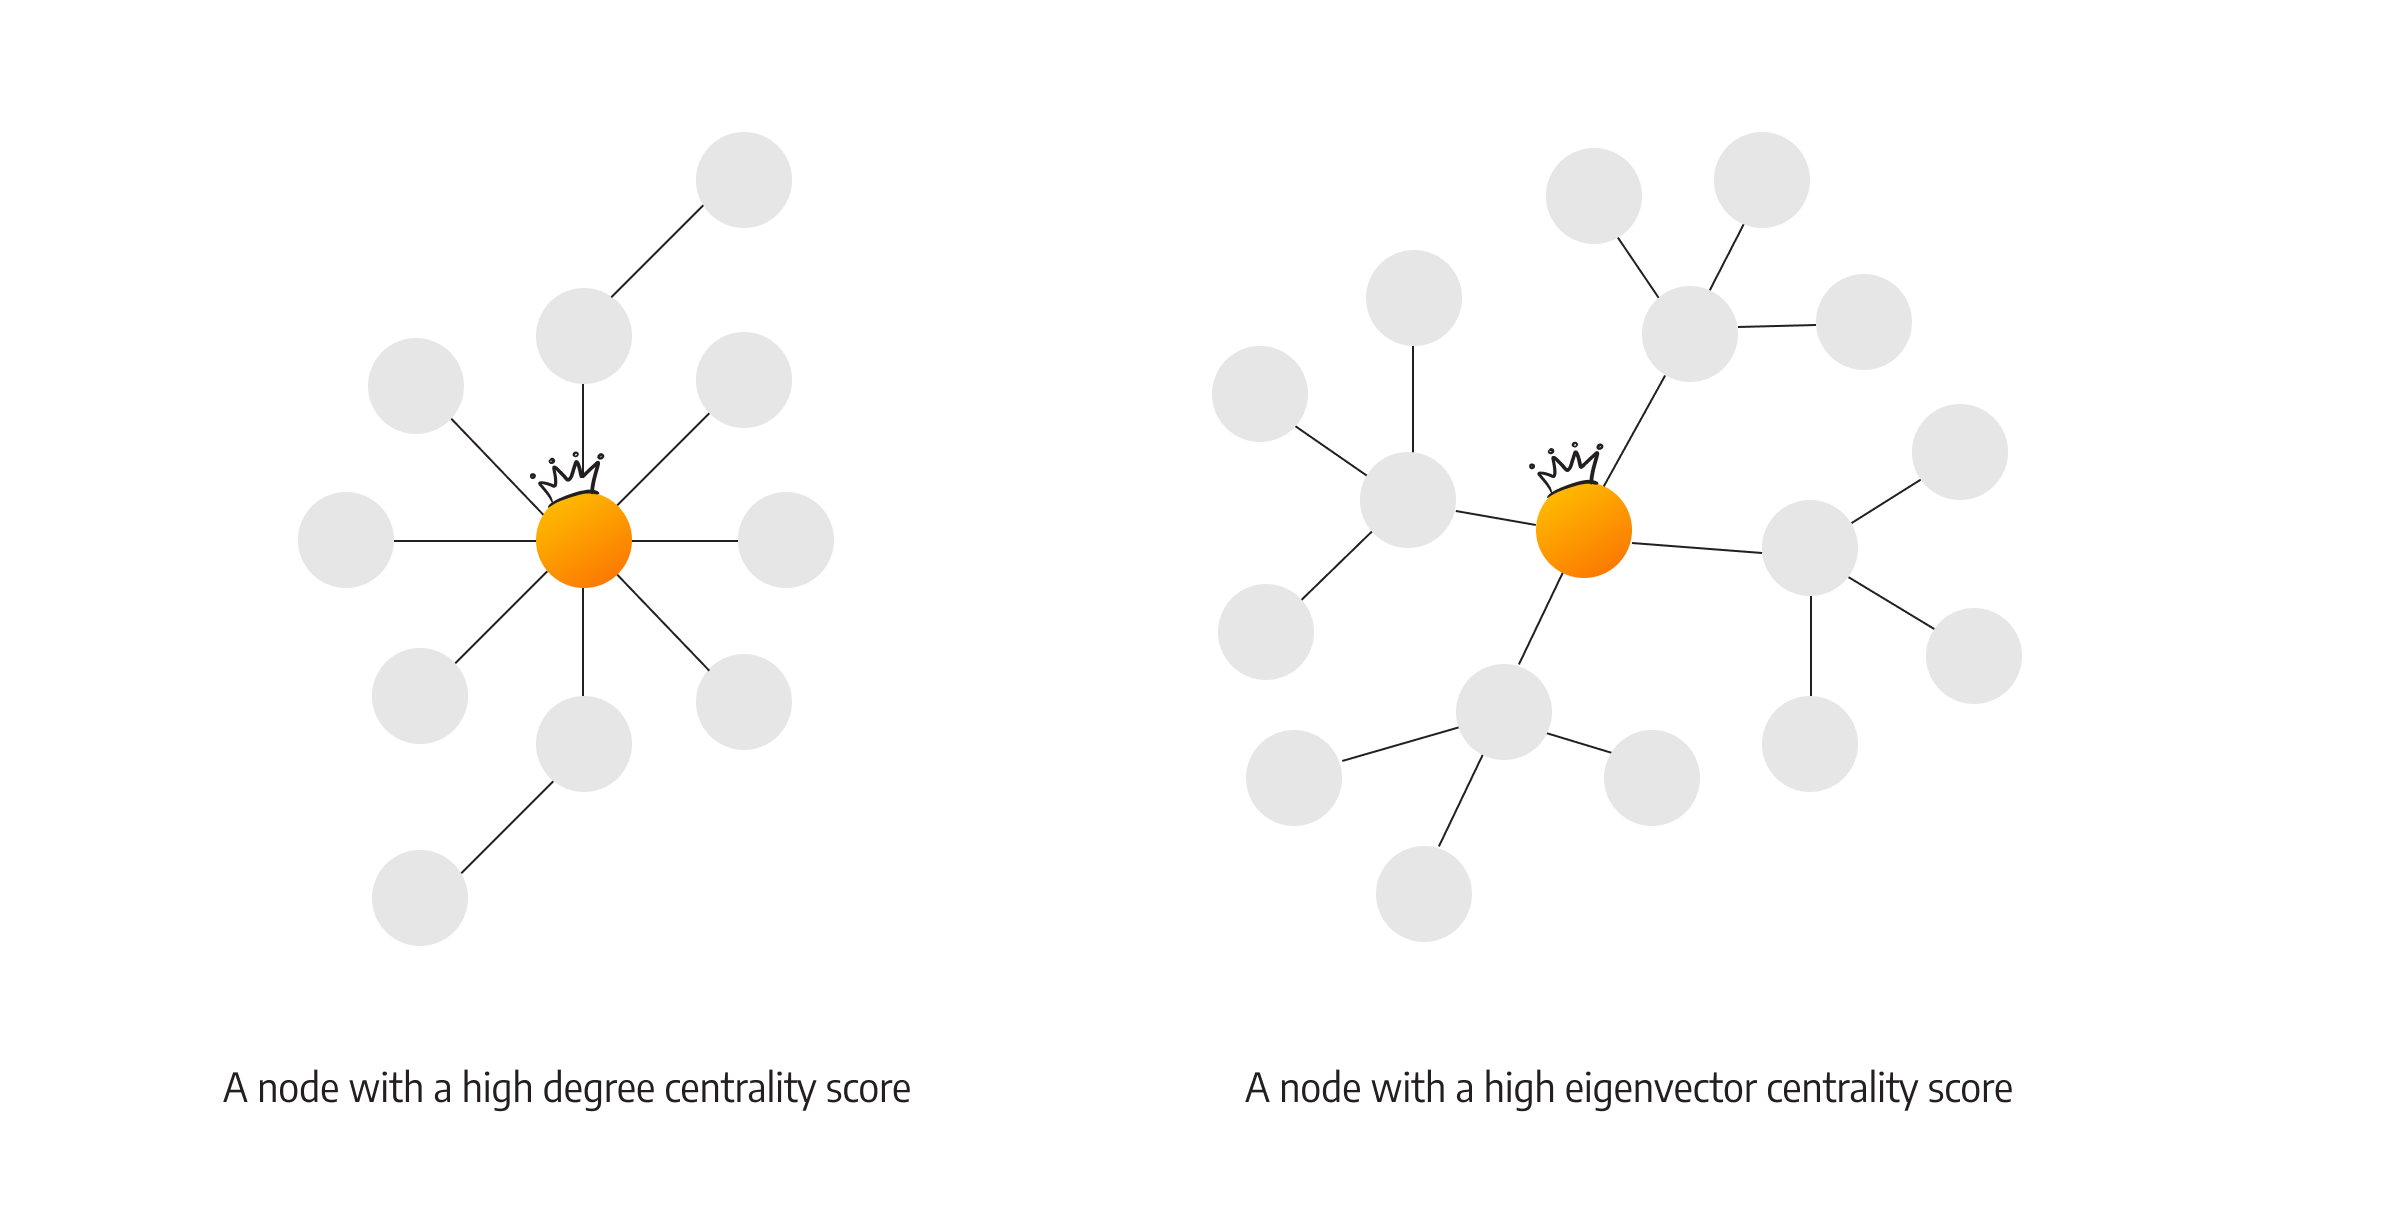
A degree is the number of relationships a certain node has. When only the relationships of a specific node are important, the analysis is done using degree centrality. But, if the degree of surrounding nodes is also included in the equation, the analysis is done using the eigenvector centrality.
Just like in real life, sometimes it’s important to have a lot of friends, but other times it’s important to have friends who have many other friends (politicians have cracked this one).
The other way of looking at the importance of a node is by examining the number of shortest paths a node is a part of. To find out which node spreads the information the quickest because it’s the closest one to many other nodes, analyze the graph using the closeness centrality (and find that one person that’s friends with everybody else and knows everything).
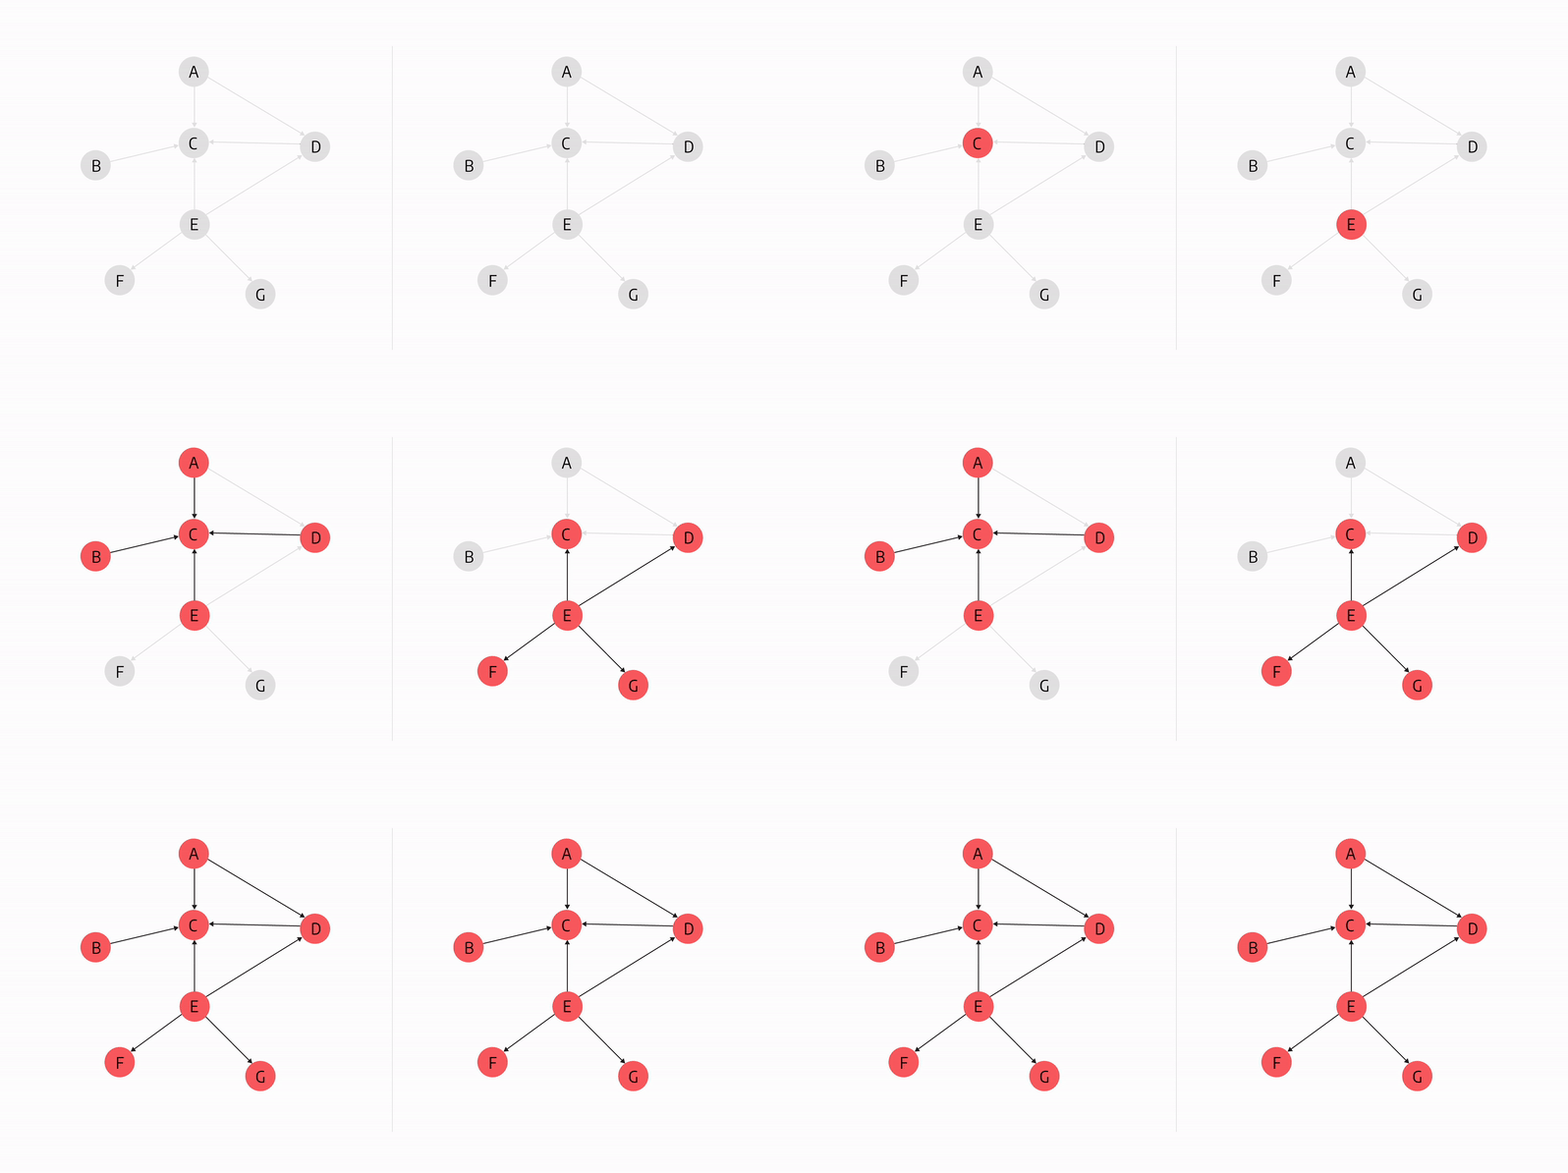
In the graph above, both C and E nodes have high closeness centrality as they can access all other nodes the fastest.
To identify the nodes that control the passing of information, you need to find out the nodes’ betweenness centrality.
Except for torturing you with spelling, betweenness centrality discovers nodes that have considerable influence over the network as they play the bridging role. Betweenness centrality is defined as the number of shortest paths that pass through the node divided by the total number of shortest paths between all pairs of nodes.
It’s the person who brings many different people together. But when that bridging person is out of town, some of their friends are left spending the night alone in front of the TV.
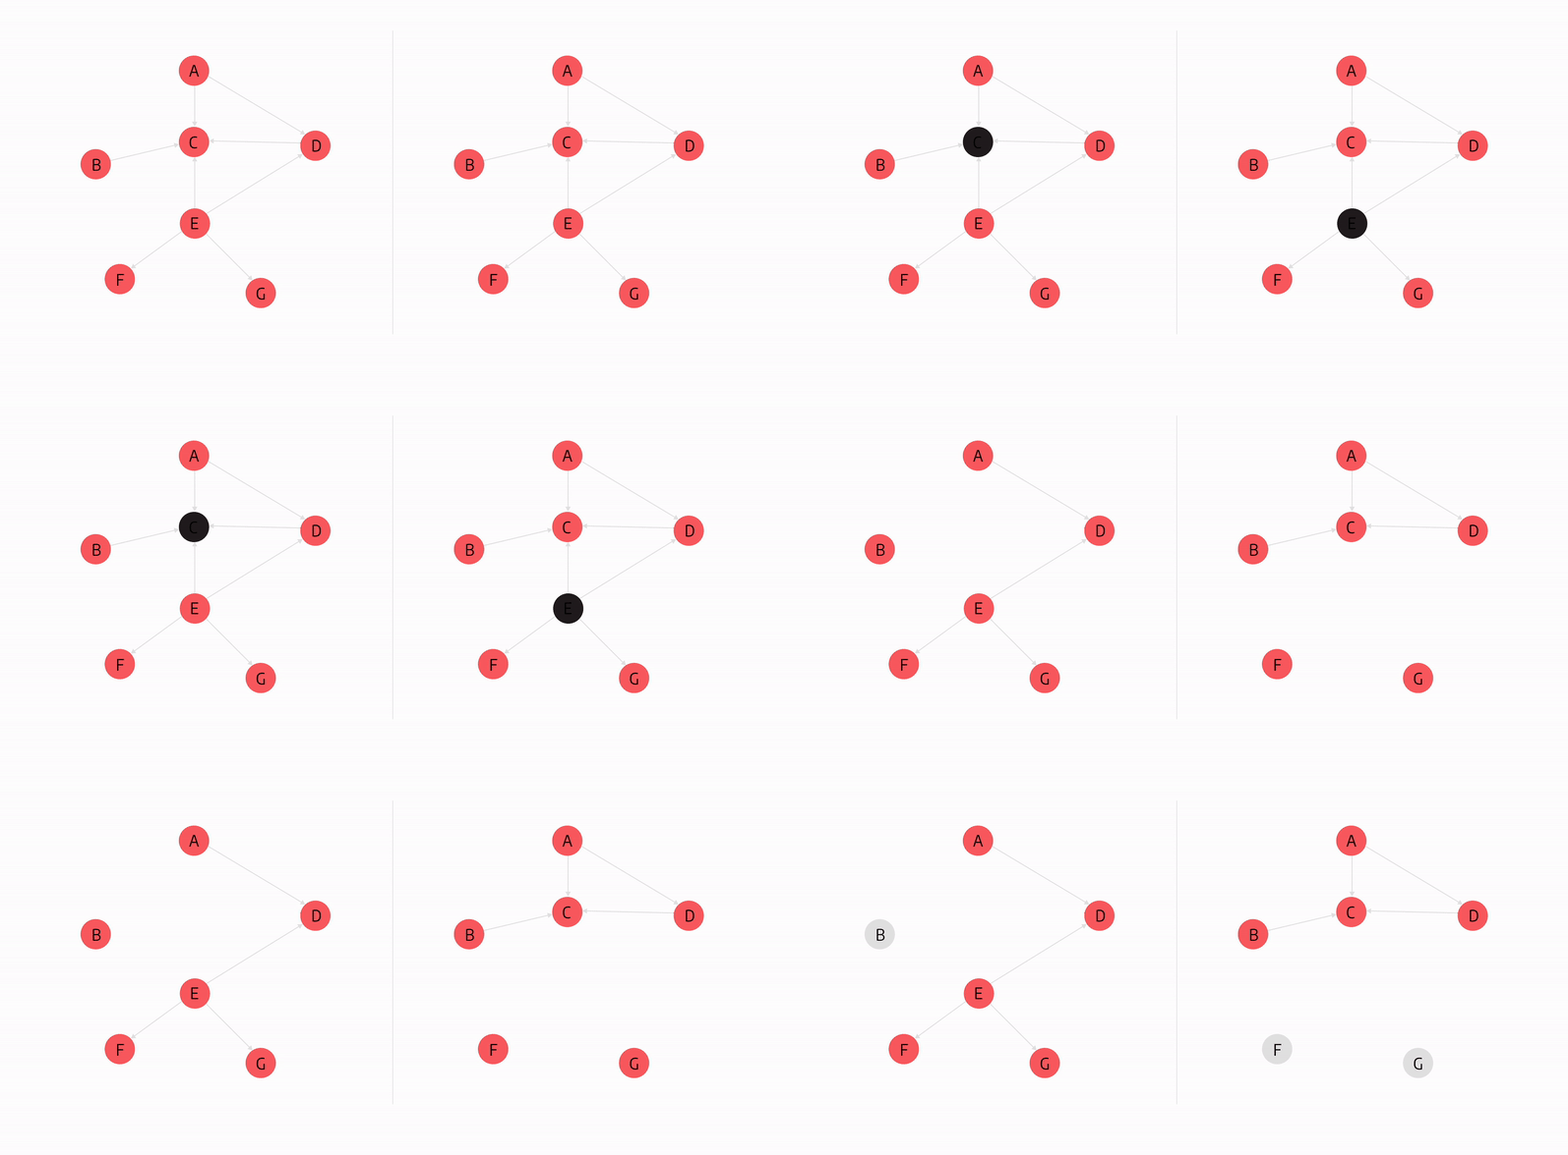
In the graph above, node E is the node with the highest betweenness centrality score because if it became unoperational, it would disconnect the highest number of nodes from the rest of the graph.
In other words, the moment the node with the high centrality betweenness score in any way fails to perform whatever it was designed to do, it’s time for fixing issues because some nodes are no longer attached to the network. So let’s look at betweenness centrality more closely to learn how to avoid problems.
Betweenness centrality use cases
Betweenness centrality can help discover pain points in networks and knowledge graphs built around various industries.
Network Optimization
Maybe the most important usage of this algorithm is transportation. In a complex and urban transportation network, betweenness centrality measures can reveal the main bottlenecks and congestions within the system. It can help organize the infrastructure of a big city and decrease time spent optimizing routes.
It can also be used to identify the most relevant landing points of the global network of submarine internet cables. Keeping a close eye on the cables between those points can avoid havoc if sharks attack and damage the cables… again.

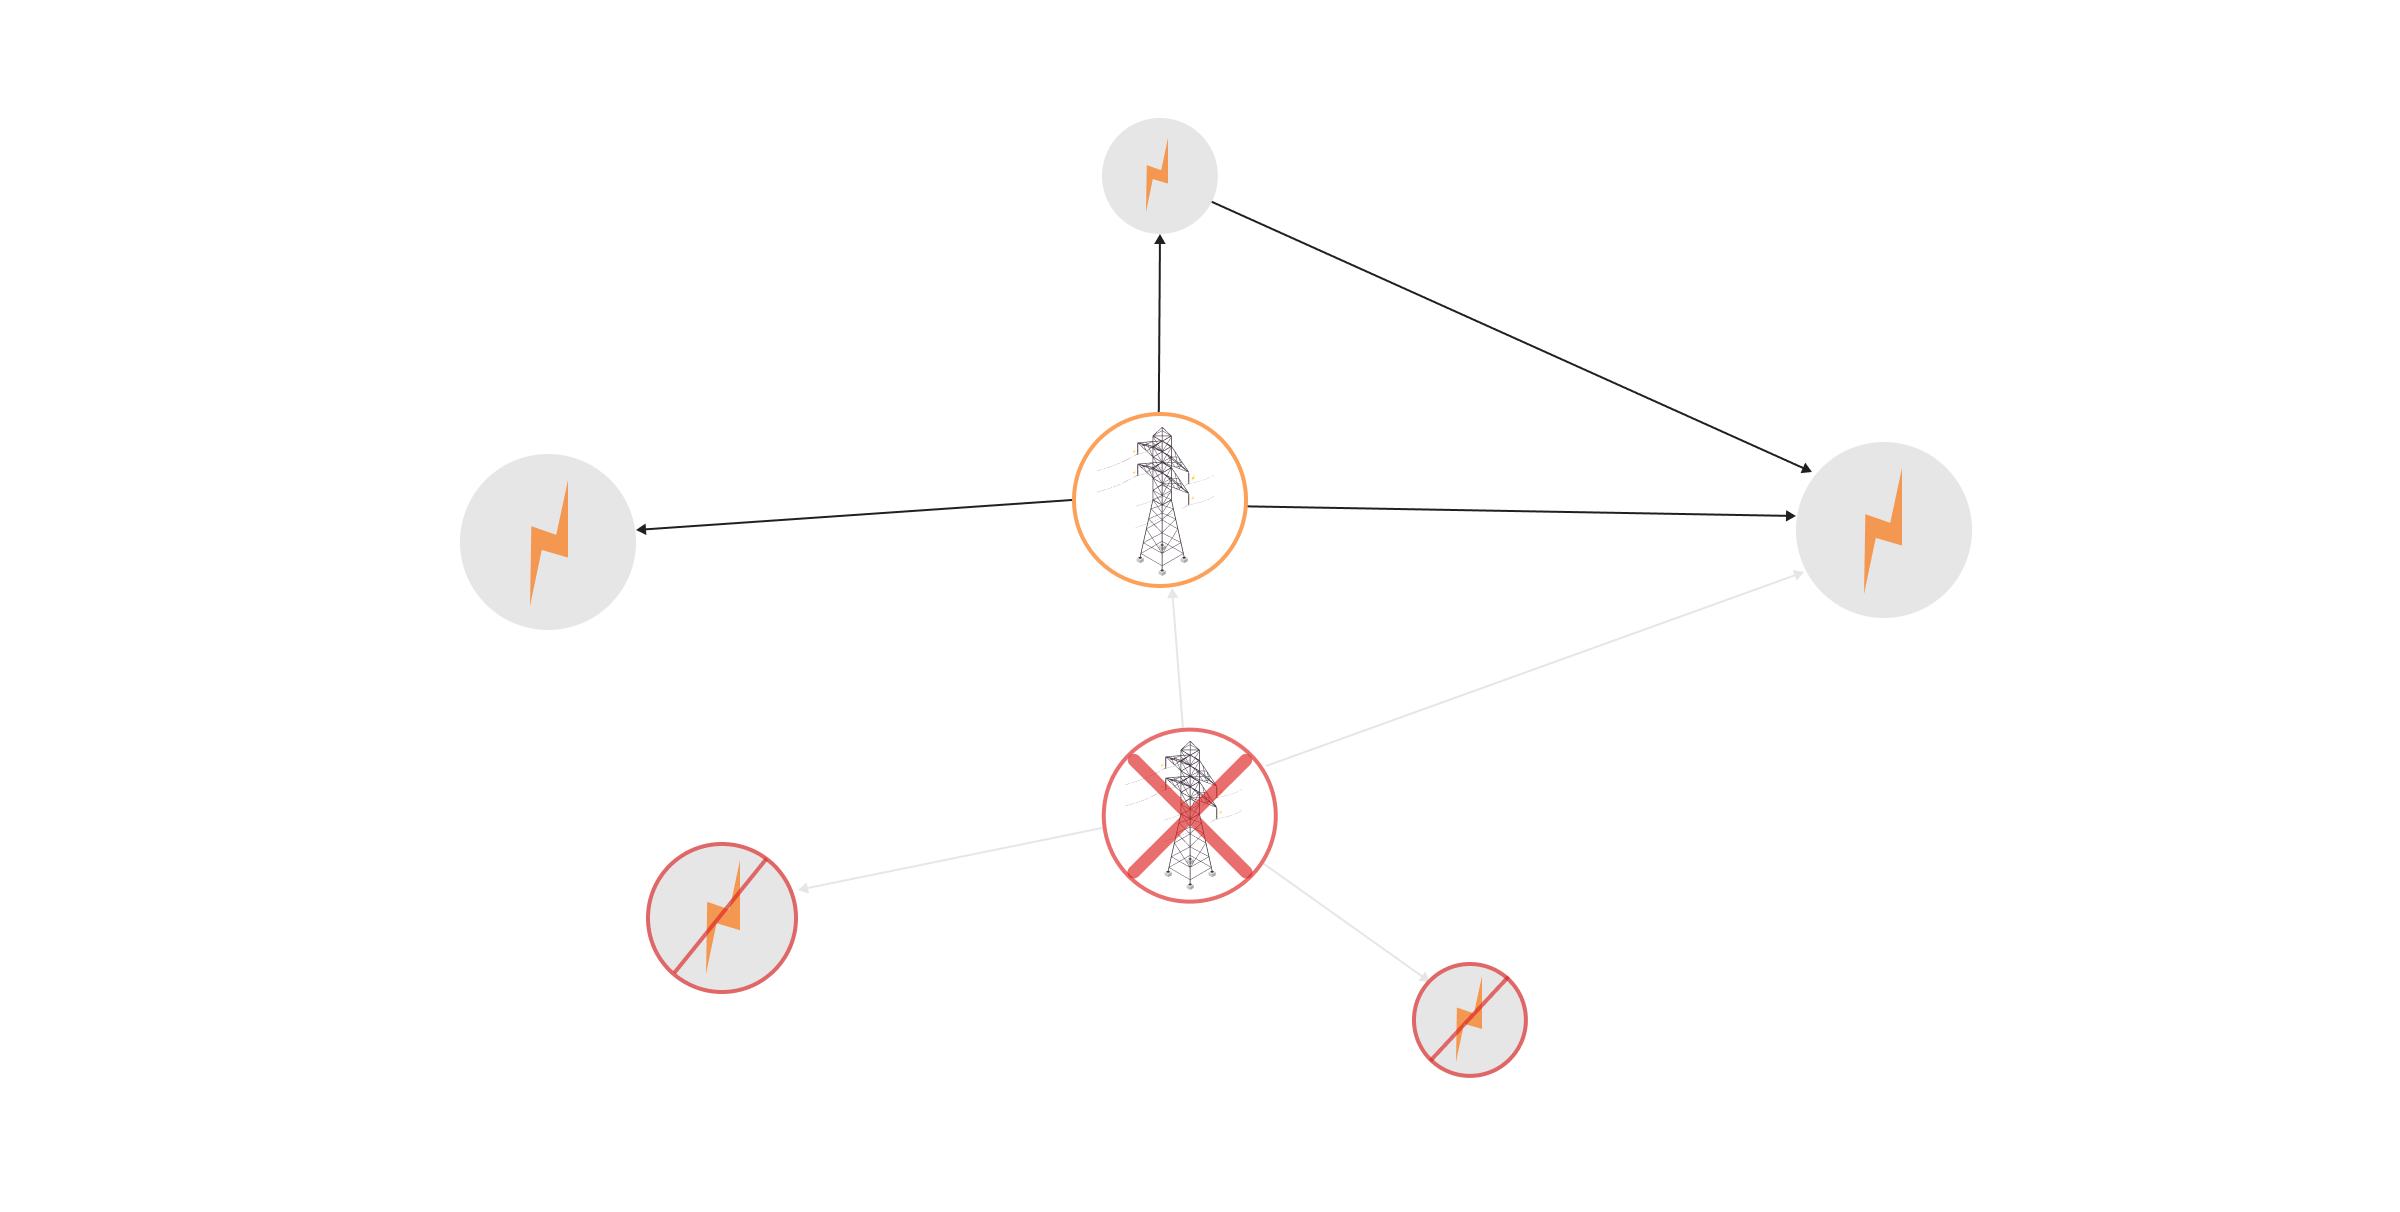
In energy management systems, betweenness centrality is an excellent indicator of weak points that could help prevent power outages between two distinct areas in the country or analyze critical points in the supply chain pipeline.
Data Lineage
In the data lineage graph, the betweenness centrality algorithm will identify nodes that are the main sources of data for other assets. Any mistakes found in those origin assets could impact the reliability of all the other connected data nodes.
Also, nodes with high betweenness centrality scores can have a large number of data sources, making them susceptible to frequent changes which propagate to other data entities. It would be wise to check the reliability of those nodes often to make sure they source their data correctly.
Fraud Detection
When analyzing a known fraud organization, betweenness centrality helps identify nodes that act as bridges between clients as they are more likely to commit fraud. Once suspicions are confirmed, data can be fed to the machine learning model to identify suspicious behaviors and clusters on larger datasets or predict fraud.
While on the topic of fraud, lots of information, goods, and activities flow through the important nodes in a criminal network, especially through those with high betweenness centrality measures. These nodes could be particularly interesting to disrupt. Identifying and stopping the most effective fraudster could slow down the activity of the entire criminal network.
Identity and Access Management
The betweenness centrality measure can pinpoint which resources are controlled by a limited number of individuals. Access limited through only a few key persons might slow down the flow of information if some of those resources or people become unavailable.
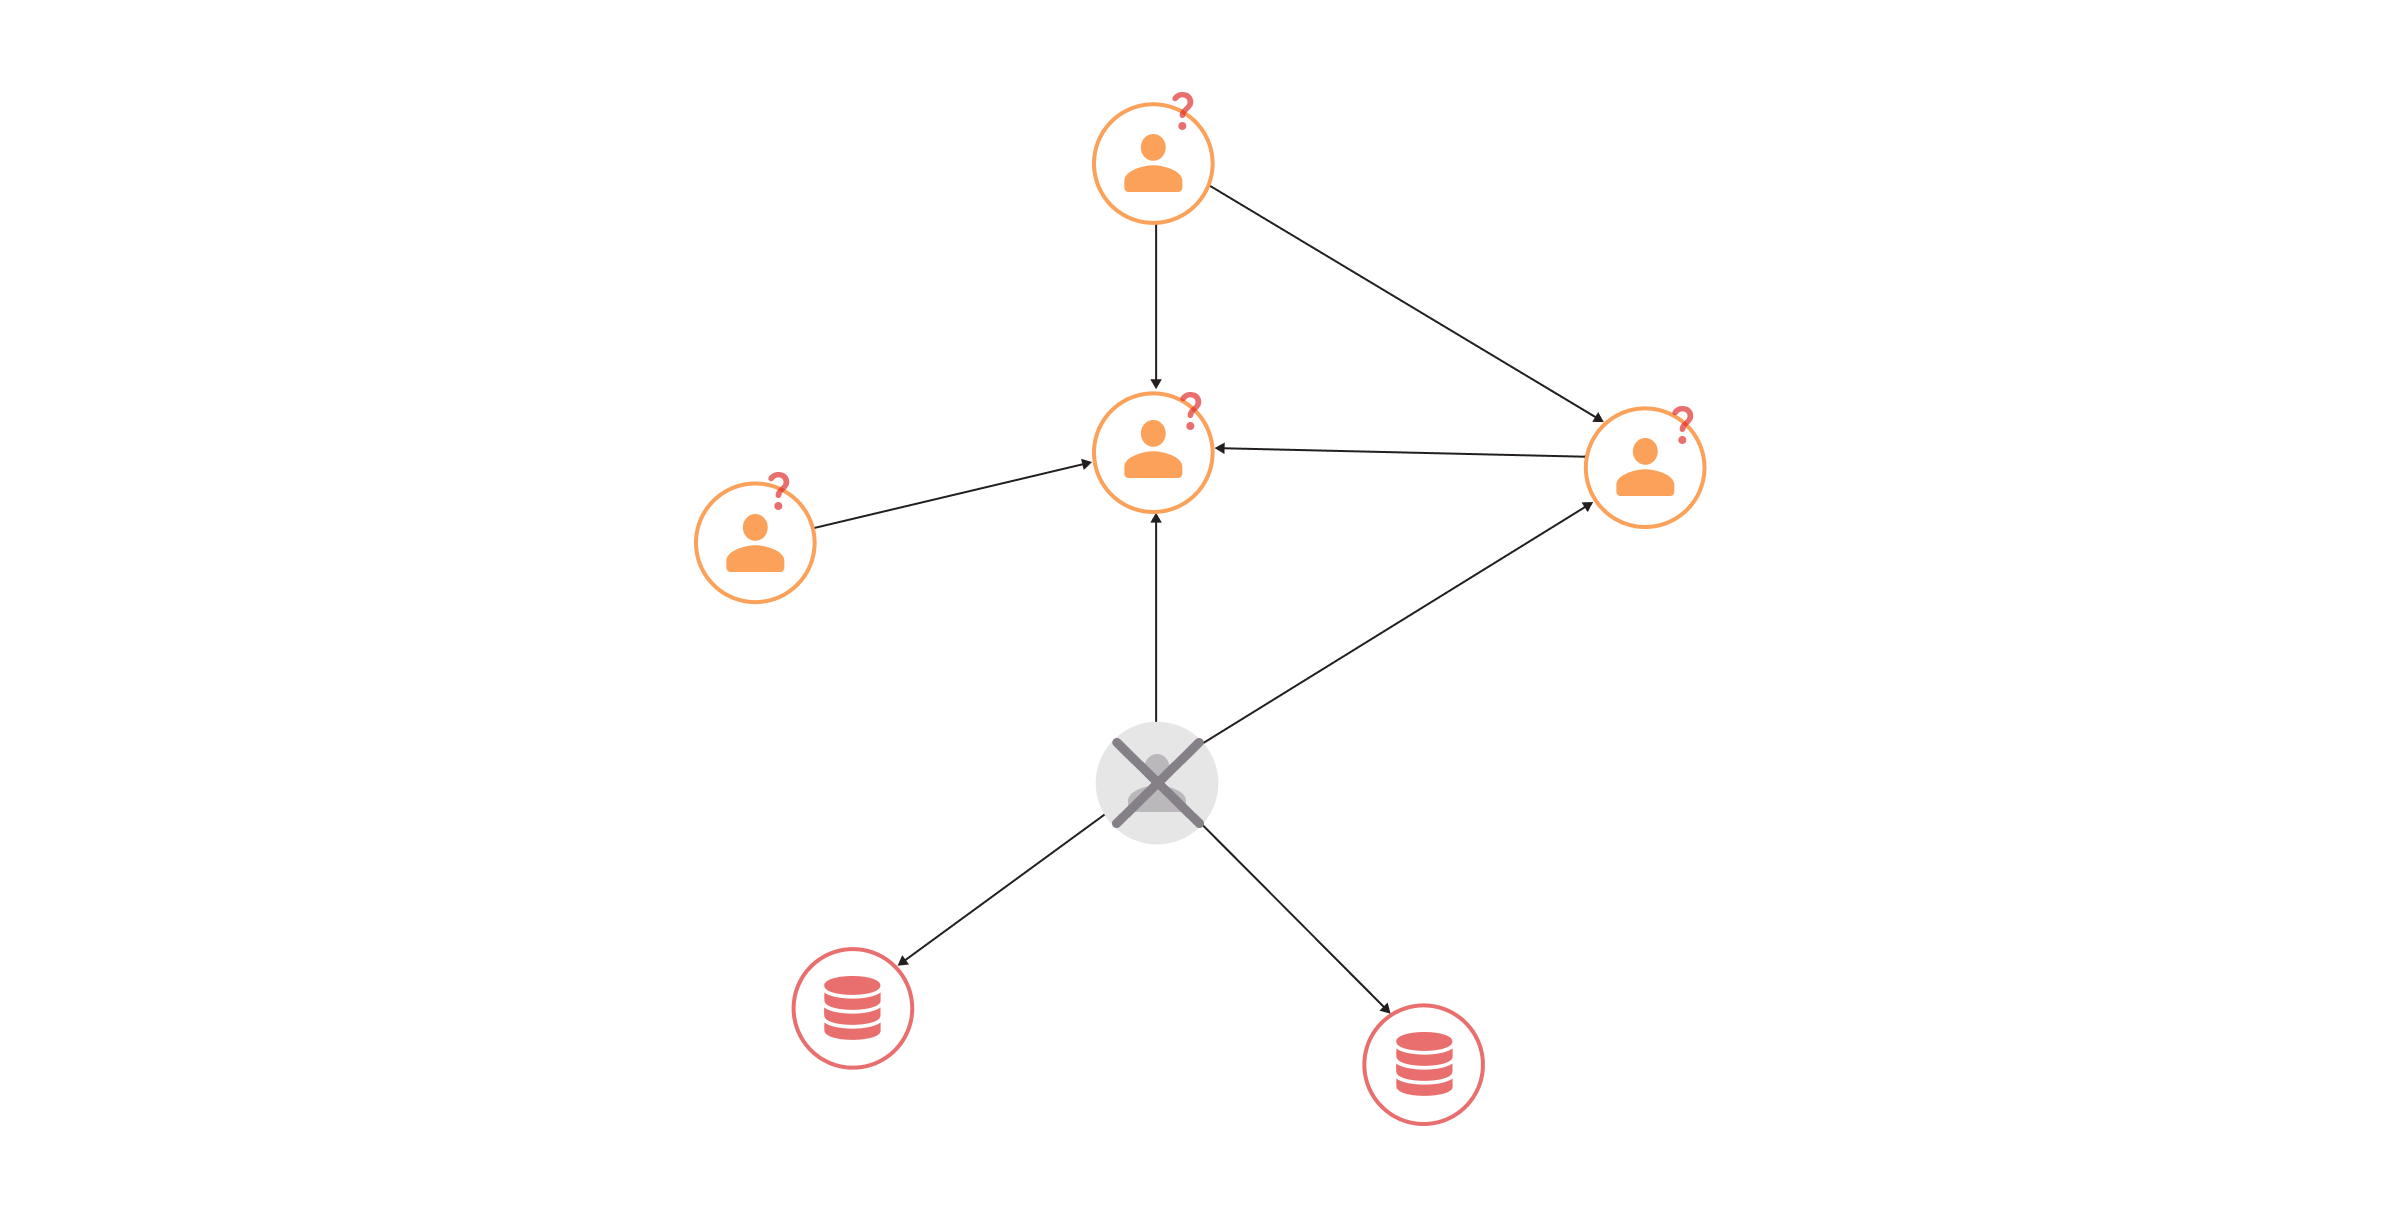
The worst-case scenario is if the flow is stopped completely. Just as PageRank can warn about excessive privileges in identity and access management systems, betweenness centrality can alert about inadequate privileges.
Cyber security
Some cyber-attacks aim to remove the most important node in the network topology, detaching its adjacent relationships and thus creating the most damage. By calculating the importance of the nodes in the network, you can direct your efforts to the most important parts of your infrastructure.
Also, as a cyberattack is a series of actions that are carried out in a certain order (path) against certain assets in the network (nodes), you can calculate through which node the most possible attack paths go. If each hop in the attack path is given a probability measure, you can use the graph as a vulnerability tree to predict which attacks are most likely to succeed. And come up with a plan to prevent them.
Recommendation Engines
This is sort of a bonus use case, as it’s more targeted towards you succeeding rather than avoiding issues. If you are struggling with what products to recommend, think of the shopping process as a path of several crucial steps for your business (adding to basket, paying and similar actions) and steps that are mostly browsing and checking stuff out.
The high betweenness centrality measure indicates that people bought certain items without too much wandering and overthinking - they saw it, added it to the basket, checkout and paid. The performed the shortest buying path and their paths might cross on a single product. Those are the products you should recommend as the must-haves.
Implementation in Memgraph
The calculation of betweenness centrality is not standardized, and there are many ways to solve it. The algorithm implemented in Memgraph is described in the paper "A Faster Algorithm for Betweenness Centrality" by Ulrik Brandes of the University of Konstanz.
Memgraph has implemented betweenness centrality using C++, which makes it ideal for use cases where performance is highly valuable. The graph can be both directed and undirected, and the algorithm doesn’t take relationships' weight into account.
Default arguments are:
directed: boolean (default=True)➡ IfFalse, the direction of relationships is ignored.normalized: boolean (default=True)➡ IfTrue, the betweenness values are normalized by2/((n-1)(n-2))for graphs, and1/((n-1)(n-2))for directed graphs where n is the number of nodes.threads: integer (default=number of concurrent threads supported by the implementation)➡ The number of threads used to calculate betweenness centrality.
The function returns the node and its betweenness centrality measure.
To call betweenness centrality in Memgraph, use the following query:
CALL betweenness_centrality.get()
YIELD node, betweenness_centrality
RETURN node, betweenness_centrality;
You can try it out on Playground, in the Sandbox of the Protein-protein interaction network dataset. Proteins found in human tissue actually make an interaction network. By calculating the betweenness centrality of proteins, it was found that there is a correlation between the APP protein and Alzheimer’s disease, which could be interpreted as a connection between essential proteins and diseases in general.
Check the protein with the highest betweenness centrality measure that could be connected to certain diseases:
CALL betweenness_centrality.get()
YIELD node, betweenness_centrality
RETURN node, betweenness_centrality
ORDER BY betweenness_centrality DESC
LIMIT 10;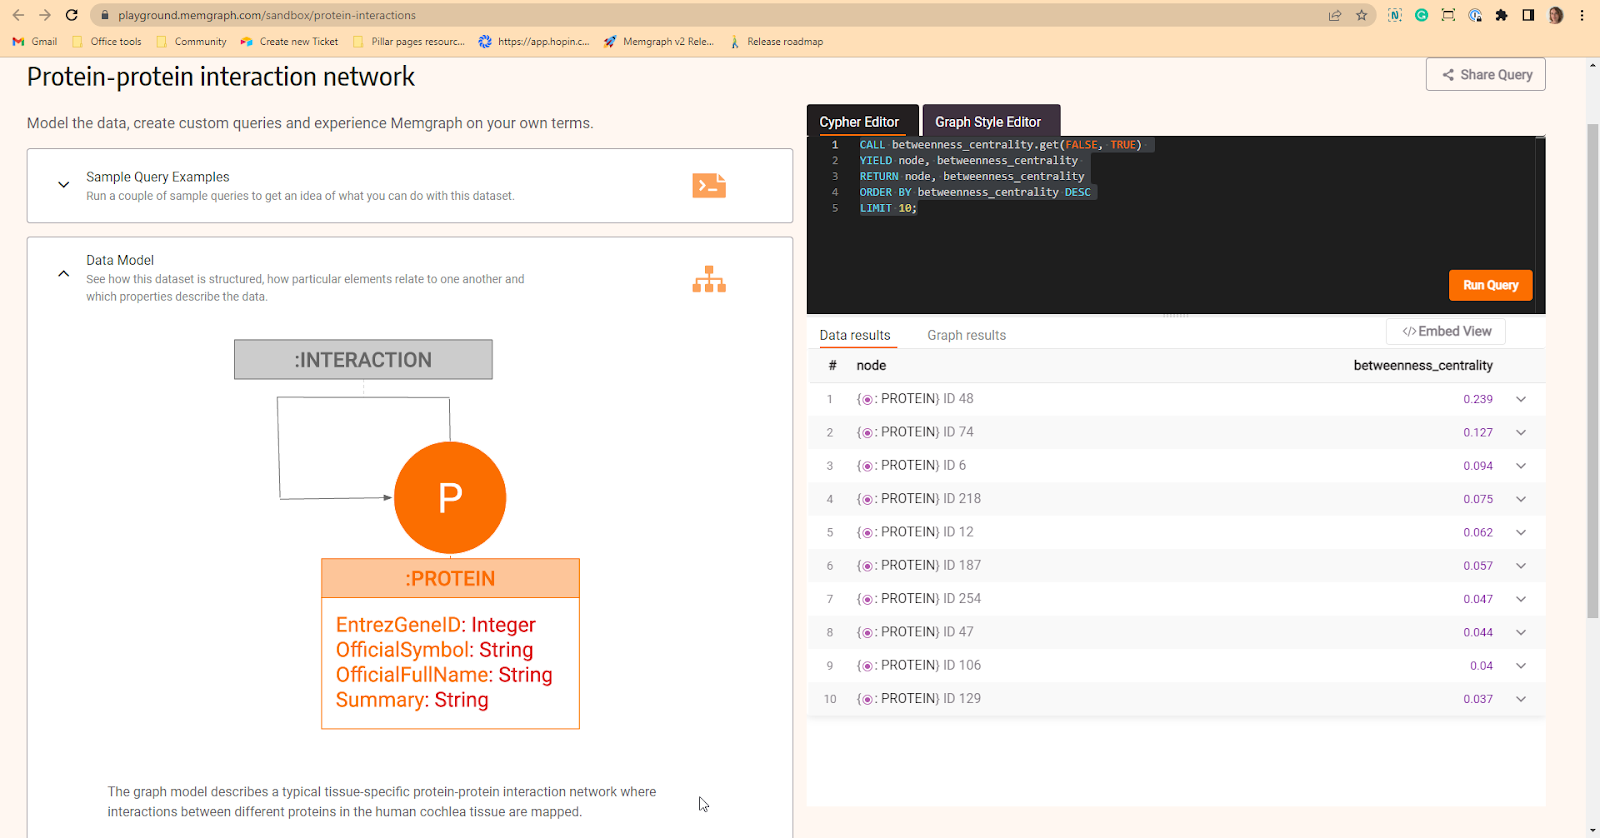
As with all the other algorithms in the MAGE open-source library, you can run betweenness centrality only on a specific group of nodes with the project() function. Save the sub-graph in a variable, then provide it as a first argument of the algorithm:
MATCH p=(n:SpecificLabel)
WITH project(p) AS subgraph
CALL betweenness_centrality.get(subgraph)
YIELD node, rank
RETURN node, rank;
If your application is highly time-sensitive and nodes and relationships are arriving in a short period of time, use the dynamic betweenness centrality which allows the preservation of the previously processed state. When entities are updated, or new ones arrive in the graph, instead of restarting the algorithm over the whole graph, only the neighborhood objects of that arriving entity are processed at a constant time.
Conclusion
Betweenness centrality will help you identify nodes that are ticking time bombs. If they fail, your network could be in trouble, as the flow between all nodes in the graph will be stopped until you come up with a fix. Keep the betweenness centrality of your nodes low, and if there is no other choice, take extra special care of them.
If you need help identifying those weak points, a welcoming community at Memgraph’s Discord server will be more than happy to help you integrate graphs and algorithms into your system. We all want you to succeed!