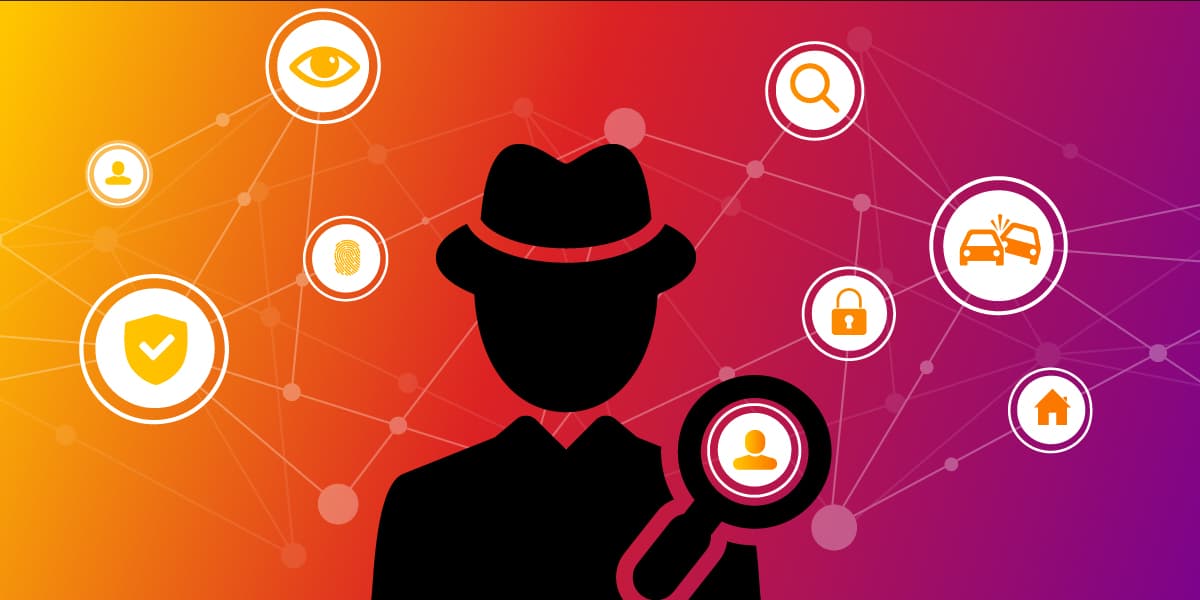
Why Should You Combine Machine Learning and Graph Tech to Build Your Fraud Detection System?
Insurance companies base their business on managing risk. Their clients are rational and act reasonable and the insurance company has that assumption baked into their risk calculation.
However, as in any other business, sometimes clients act against the company by constructing various imaginary scenarios backed up with pieces of fake evidence. They still report a claim and, if it passes the checks, extract cash from the incidents that never happened in reality. The insurance company is at a loss as it did not detect the fraudulent claim. That is a problem. Luckily, it is a solvable one.
To detect fraud, insurance companies create modern solutions based on artificial intelligence to identify such scenarios and reduce losses.
Graph representation makes a difference and helps understand hidden relations between different involved parties, especially in a domain full of interactions like insurance. If you know how machine learning works and have a fraud detection problem, this blog post is for you. It will explain how to model insurance data in graphs and how graph features can enhance the predictions of a machine learning system. Let’s dig in.
The right tool for the job
In insurance data, fraud is an anomaly. There are a number of possible ways to detect anomalies. One possible course of action is to create a rule-based system that will be triggered by an event similar to an event that already exists in the database and has been proven fraudulent. For example, if an incident occurs at the same address the injured individual lives in (at home), and the claim is made several days after the incident, this may be a reason to look into that claim. If it is found that the same lawyer is hired as in another fraudulent claim, the rule might be triggerd and flag the claim for inspection.
Unfortunately, this approach might not work for many fraud scenarios because fraudster behaviour changes over time. Fraudsters are cunning and these events are so unique and different from one another that the rule-based system simply cannot register and they slip.
One adaptable, novel solution is applying machine learning. Nowadays, machine learning provides solutions to many complex problems. It can also be a powerful tool in fighting fraud if applied correctly.
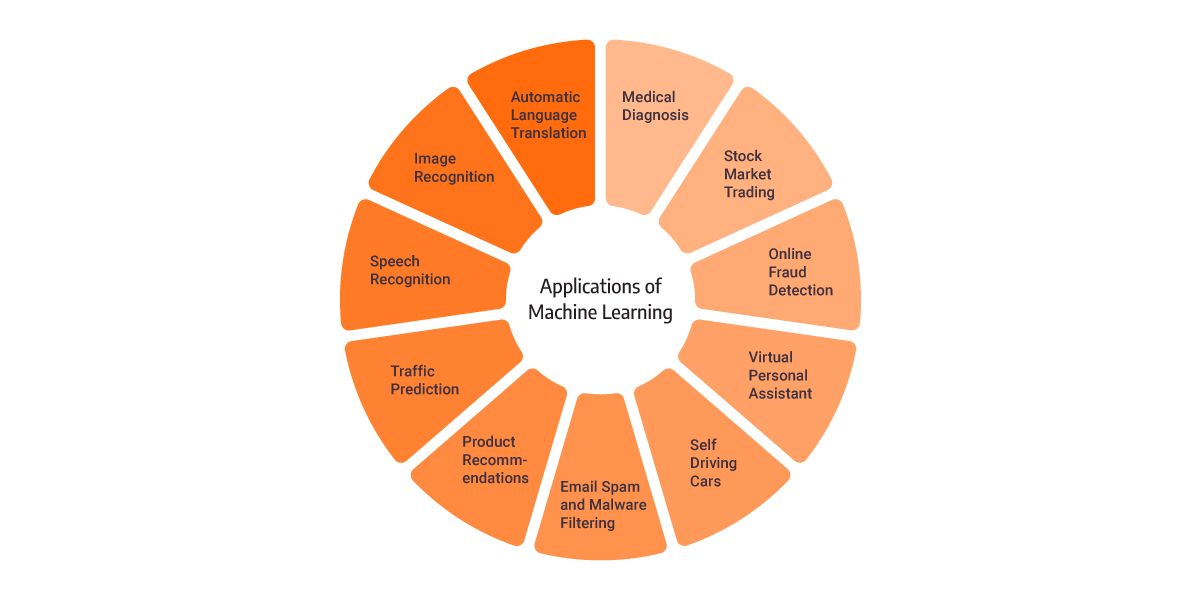 Figure 1. Machine learning applications
There are various ways how to apply machine learning for fraud detection in insurance. Let’s start with the basics. Machine learning involves a certain mathematical model, which, when applied to data, can solve tasks and process information on a level no single human could ever do. The mathematical model can start as simple regression to a complex system of linear matrices and finish as deep learning.
The mathematical model is adapted to certain needs by applying data. To generalize better, machine learning models are given large amounts of data to learn from and adapt the model accordingly. Most ML models undisputedly benefit from the amount of data they have ingested: the more data you have, the “smarter” the model gets.
Insurance is an eventful industry, and the amount of data generated daily snowballs. Even though the data is plenty, not all data can be used to train the model as the data needs to be time-dependent, balanced, and relevant.
To achieve time dependency, we decide upon a specific “current” moment in the data used for training. All the data with a timestamp before that moment is used for training, whereas the rest of the “future” data is used for testing. Based on the testing data, the model will make predictions and test its correctness. This training process is represented in Figure 2.
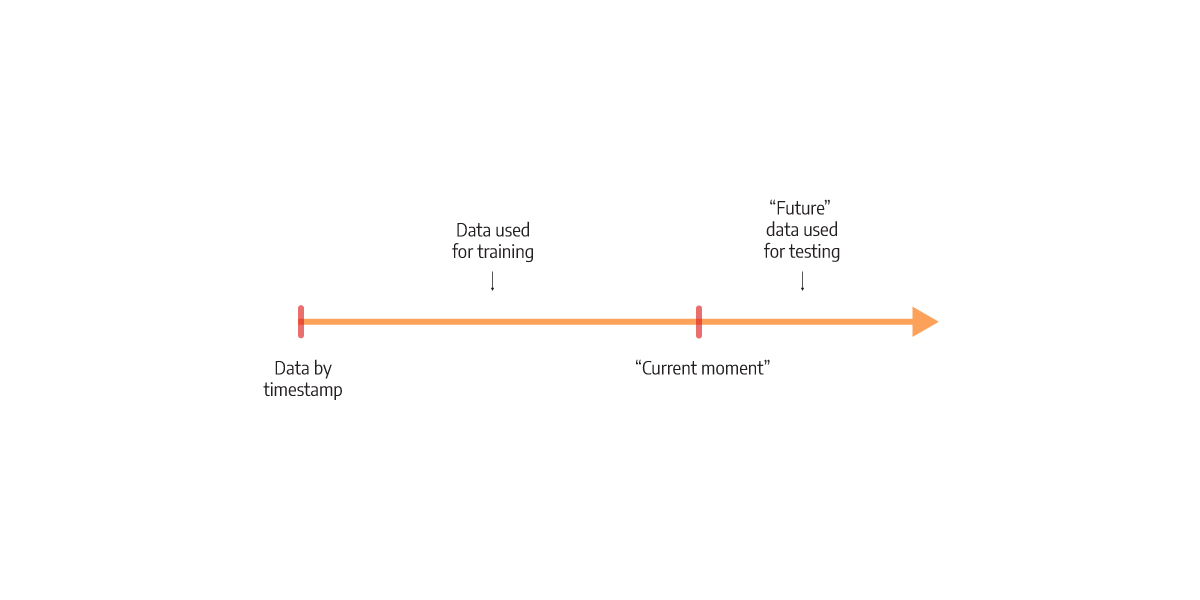 Figure 2. Training split
To make the data balanced, we need to understand what makes it unbalanced. In reality, fraud makes up a small but costly percentage of claims. When training a machine learning model, this might be a problem. If the model learns from too many negative examples, it might never be able to adapt to flag positive ones. There are multiple ways to resolve this. The most common is to upsample the fraudulent data to some reasonable extent, so it ends up more often in the model’s parameter adjusting process.
And lastly, we need to make sure the data is relevant. This includes deciding what kind of features the model should ingest. What is the right set of information that will enable the model to predict fraud on unseen data successfully? Well, let’s start by applying common sense to the problem. One idea is to include all relevant information someone would include when building a fraud detection system.
Important factors in fraud detection are the duration of the policy, policy premium mode, policy expiration date, whether the involved individual has a criminal record, how many years of driving experience the driver has, and the amount of money involved in the claim. All these can be boiled down to numbers. Numbers that can be used as input to predict fraud.
And although these factors are sometimes sufficient to classify the event, some fraudsters still go unnoticed for a long time. As experts in the graph industry, we experienced the benefits of using graphs as a tool to enrich the features with hidden connections seen only in networks to improve the flag rate of fraudulent claims.
Season it with graphs
As already said, insurance works with connections between all the entities involved. With such an intertwined network of data, previously hidden data can be obtained from graphs. One possible solution is to use popular techniques like Graph Neural Networks (GNNs). Even though they are quite effective, they are complex to maintain. To keep the simplicity of training, we propose the idea of enriching the machine learning model with additional features coming from the graph.
Graphs can find connections that would stay hidden if working with tabular data only. They also allow powerful analytics that unravel communities, calculate importance, and generate artificial embeddings based on the graph structure (similar structures have similar embeddings, or close structures have similar embeddings). On the other side, graph algorithms such as community detection, PageRank, or Node2Vec can gather the information that wouldn’t be possible with a human agent exploring the data. This is the power of graph-level features that tend to thrive in an environment full of interactions.
But because the standard factors in fraud detection are expressed in numbers, the features and connections obtained by graphs also need to be expressed in numbers. Below, we separate insurance claims with community detection (red and yellow communities). Each node then gets a property about the number of fraudulent claims in the community as a feature that is then used in training the model. Teaching the model that frauds can be connected at some point (fraudsters used the same lawyer, incidents happened on the same address or were committed by the same person, etc.) can help shape prediction, especially if the incident is already leaning towards being fraudulent.
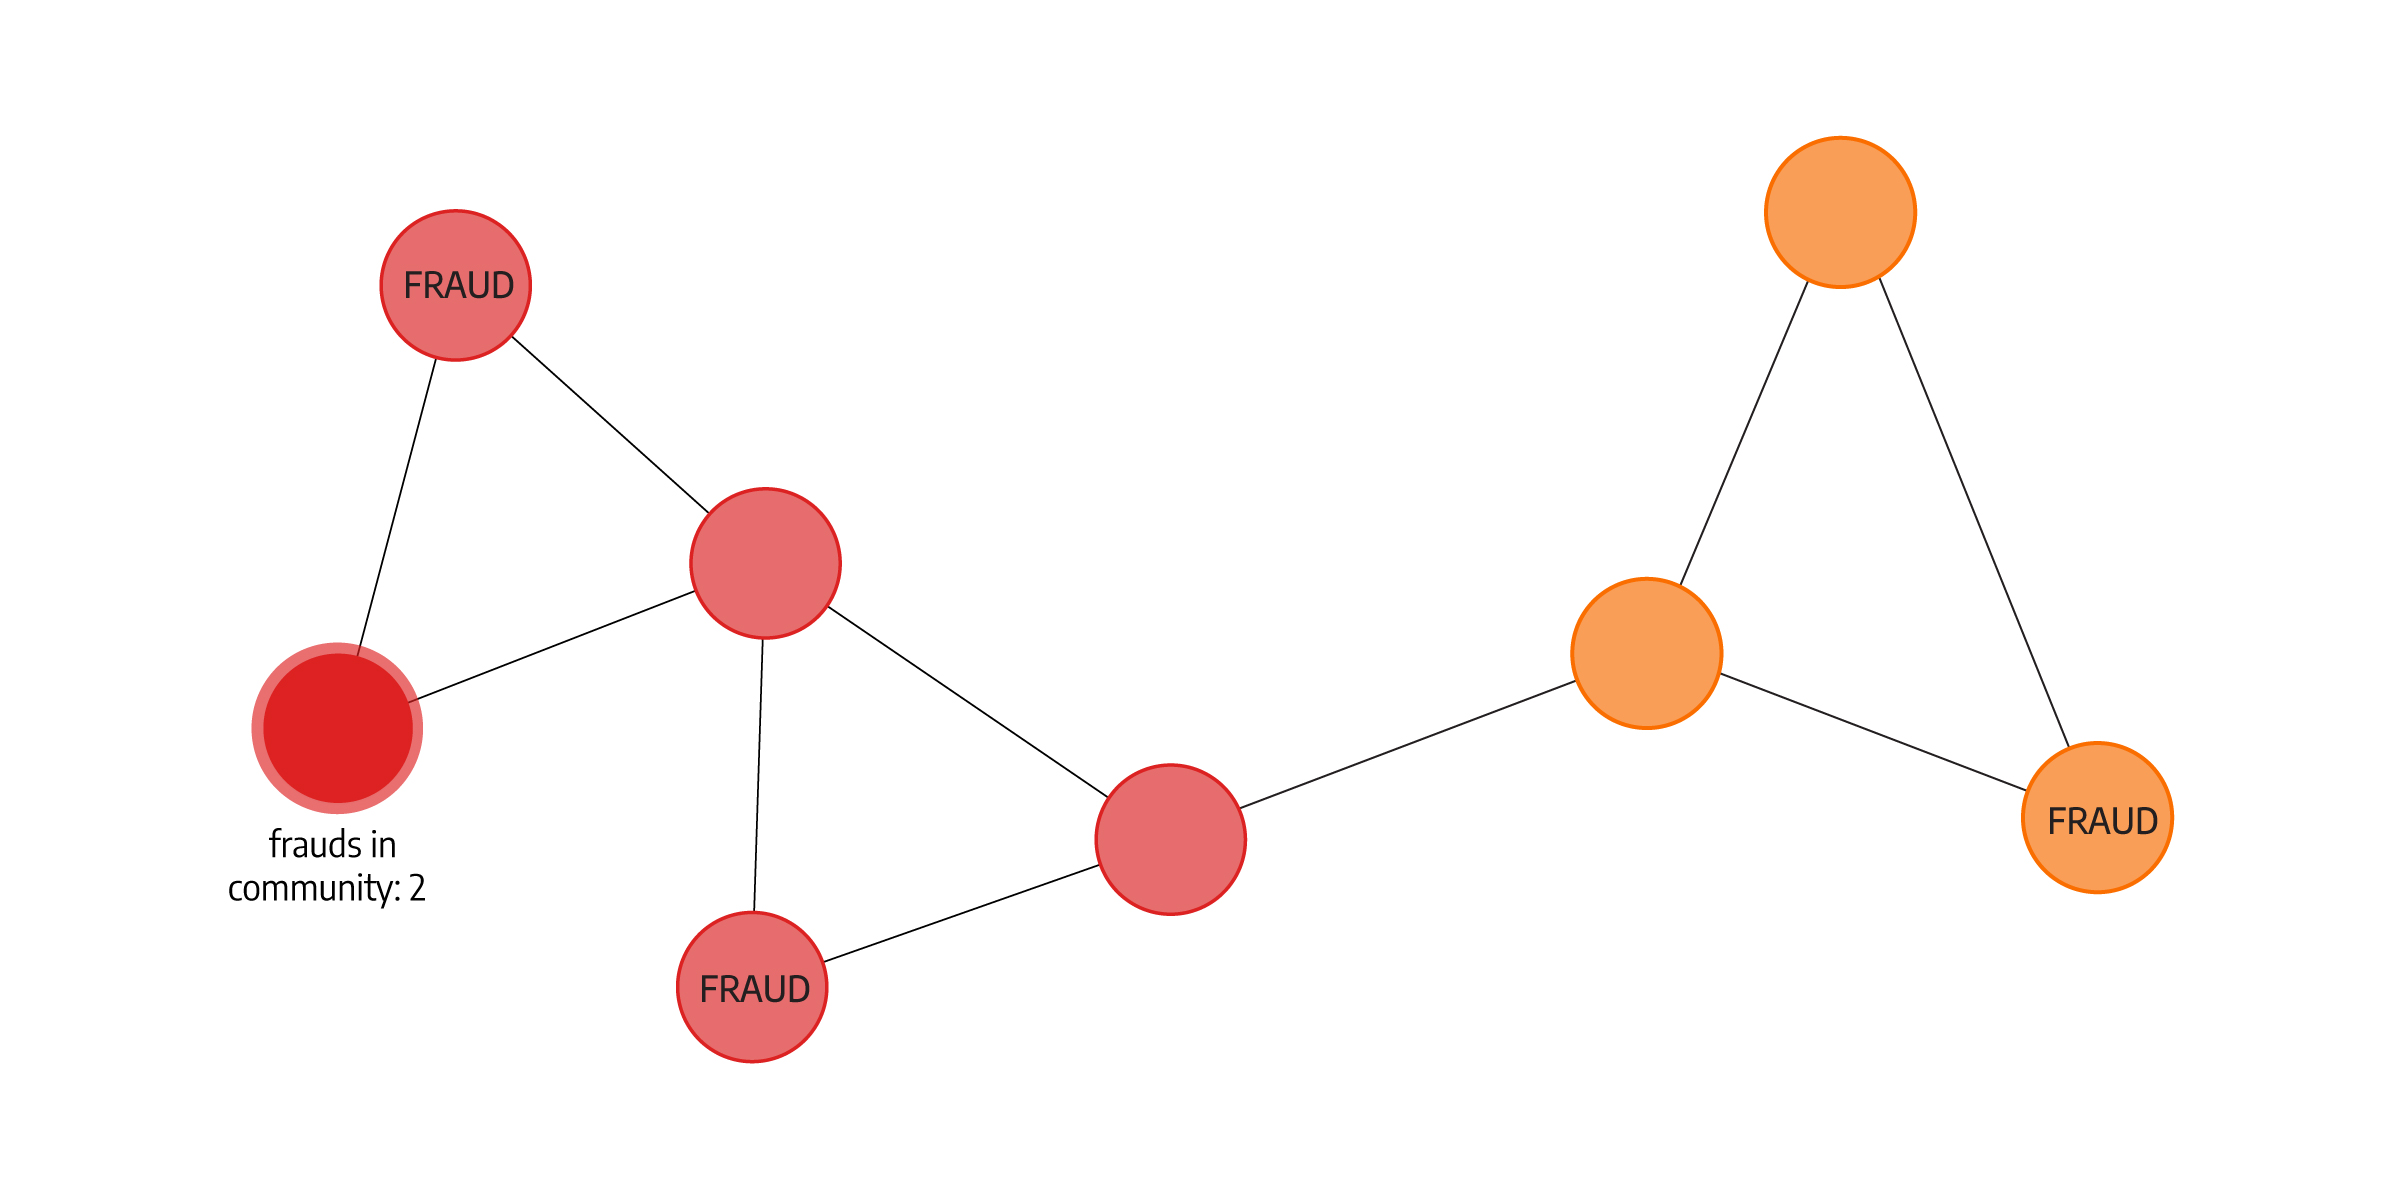 Figure 3. How Community detection might be used as a feature
Going hybrid
By combining graph algorithms and machine learning, we are using the best of both worlds and can create a powerful solution. The final machine model for fraud prediction should use both human-generated features and the ones obtained from graphs. This is the perfect solution for insurance cases where graph features play an important role in the final prediction by exploiting previously unseen frauds.
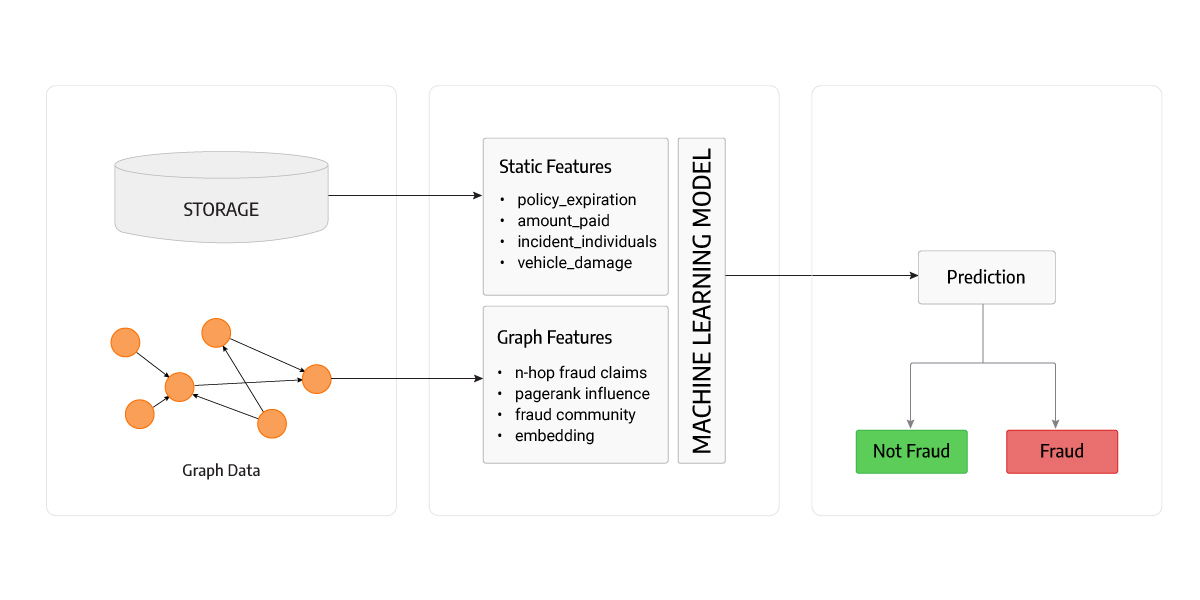 Figure 4. Model Overview
Because of the practicalities and legal aspects involved with unveiling fraud, the model’s results need to be explainable. Machine learning models are not always the best at being explainable. For an interconnected, layered neural network, it is not easy (if at all possible) to trace the output decision that the network has made to its inputs, in a way that we could point to inputs that play greater parts in the insurance claim being flagged as fraudulent. But some machine learning models are explainable, and simpler models are easier to interpret.
One approach could be using a decision tree model. This model enables full explainability, where the decision can be formulated as a list of conditions that led to that decision. We can always follow the tree branch that shaped the decision, and infer which inputs contributed in which degree to the model’s decision.
Another approach would be a simple logistic regression. In logistic regression, parameters are trained to weigh the proportion of importance for some feature. Compared to linear models, logistic regression gives us a probability evaluation of its output, and with it being a simple model we can more easily explain to which degree some inputs point to a fraudulent claim.
Lastly, experiments showed that using multiple models for specific cases can lead to better results. For instance, theft cases and related activities differ from car crash incidents. Within various specific cases, multiple models can be trained to prevent bias. The theory states that a low-variance model can be obtained by having multiple high-bias models simultaneously. This enables each model to be trained for its use case and used together with others to create a well-performing fraud detector.
Conclusion
Machine learning is a powerful tool for fraud detection. However, it comes with a set of limitations, especially when it’s being trained on a datasets that don’t contain plenty examples of fraud. Predictive models benefit from more information on insurance claims and individuals because more useful features can be identified from larger datasets. Using graph expertise, we can augment the machine learning model with features gathered from graph algorithms, thus gaining better predictions and more insight into the data. Also, using explainable or simple models such as decision trees and logistic regression can give insurance agents information about where to look for signs of fraud.