
How a Leading Retail Bank Built a GraphML Pipeline for Higher-Precision Fraud Scoring
Fraud rarely looks suspicious when you isolate it. A single payment can be normal. The signal shows up when you connect the dots. Who paid whom. How often. How quickly the money moved again. Which accounts keep showing up at the centre of many incoming payments.
In this Memgraph Community Call, Derick Schmidt, Head of Product at Capitec Bank, and Jan Ehlers, Data Scientist and Data Engineer, walked through how they use Memgraph to strengthen fraud-focused machine learning models. They also showed what it took to push that work into a daily production pipeline, including the parts that usually break first, like time leakage and class imbalance.
If you missed the live session, you should check out the full Community Call recording here.
Below are the key takeaways from the session.
Key Takeaway 1: Fraud Patterns Live in Networks
Fraud pressure in South Africa is rising. The session referenced a report claiming overall fraud increased by 86% in 2024, and “card not present” fraud increased by 26%.
The numbers are useful context. The bigger point is operational. Fraud erodes trust, and trust is what every bank lives and dies on.
The session also called out why the problem is getting harder. Scams scale. AI reduces the effort required for convincing impersonation and social engineering. The harm lands on real people.
This session focused particularly on the Authorized Push Payment (APP) fraud type. It involves a client being tricked into sending money to a scammer, then receiving nothing in return. A simple example was used: paying for a MacBook and the delivery never happening.
This fraud type creates a predictable structure. Not one victim. Many victims linked to the same destination, or to a small connected set of destinations.
Key Takeaway 2: Investigator’s Mental Model Is Graph-Shaped
Fraud investigations often start as a chain.
Alice pays Bob → Bob pays Charlie → David pays Alice → and so on…
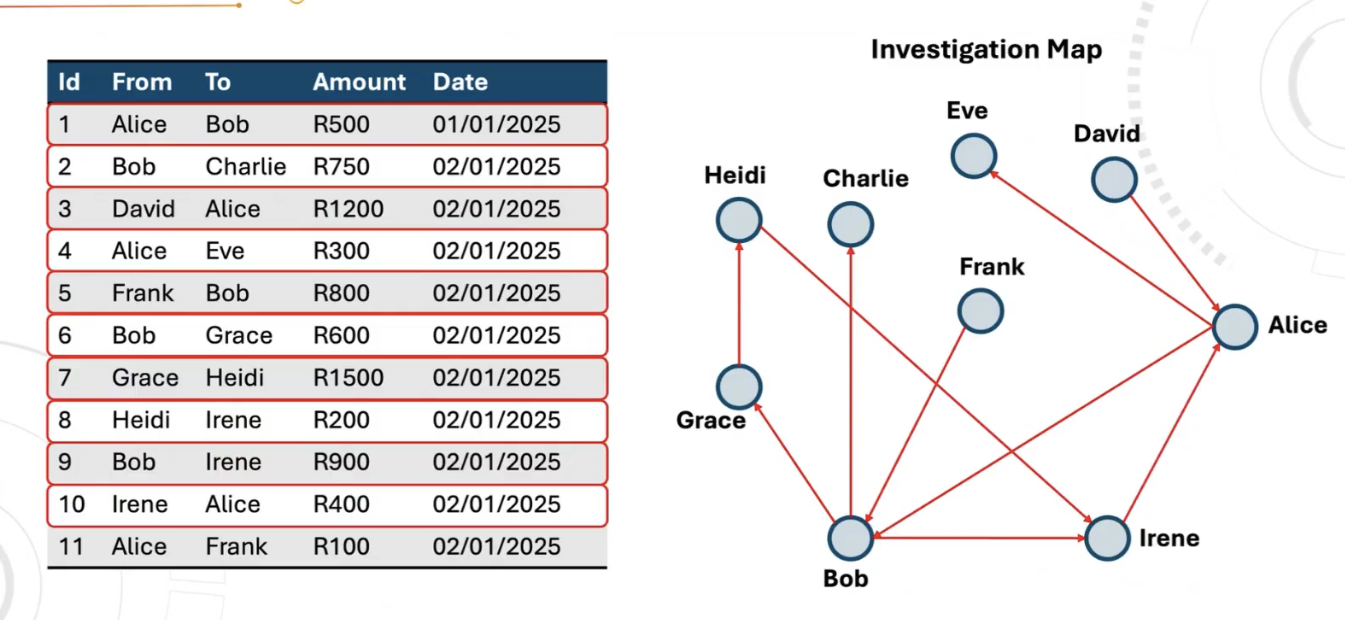
On a whiteboard, this is manageable. At bank scale, it becomes a throughput problem with too many transactions and too many hops. Too much manual effort to build and maintain those maps. At real-world scale, it becomes physically impossible to maintain by hand.
Graph databases are the natural solution for this problem. The investigator’s mental model is already a graph. Storing that structure in a graph database makes it queryable and repeatable. Hop depth is the critical element that helps catch such related scams.
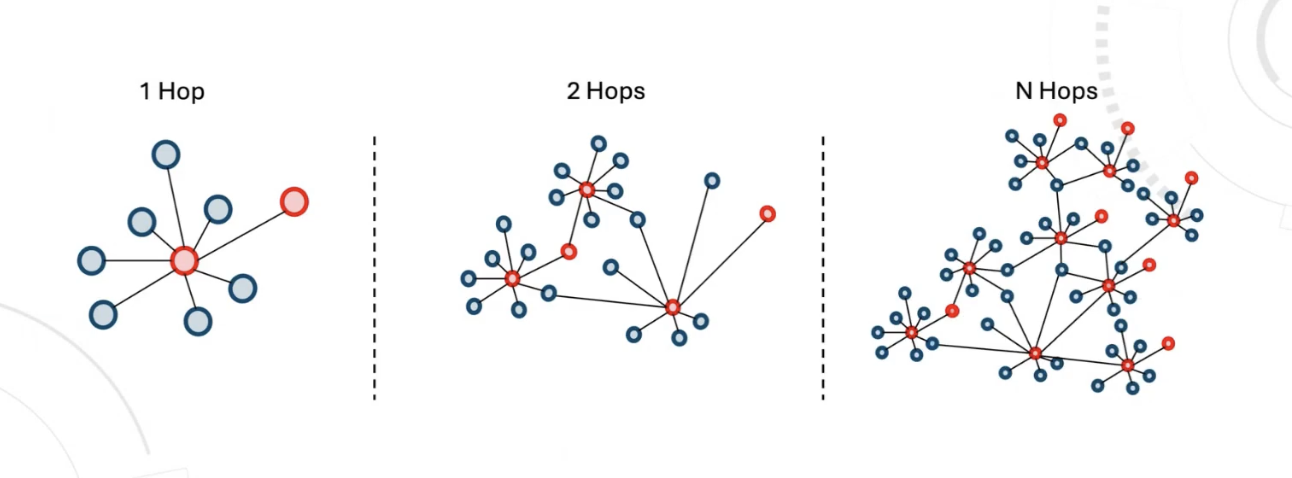
One hop shows direct neighbors. Two hops exposes shared intermediaries and hidden structure. More hops start connecting clusters that do not show up in flat lookups.
Memgraph is perfectly fit for such performant workloads, especially with the help of its built-in deep path traversal algorithms.
Key Takeaway 3: Modifying the Traditional Pipeline With a Graph-Based Approach
Rather than building an entirely new pipeline, the Capitec team upgraded their standard ML setup.
Here's what the traditional approach looked like:
- One preprocessing table feeds tabular feature engineering.
- Consolidate and preprocess each client's data
- Generate features in relational database
- Persist the final model input data
- Train a model on that table and score clients.
Here's what the upgraded graph-based approach looks like now:
The same preprocessing table also becomes a graph, and the graph features are then computed inside Memgraph.
After that, everything stays the same. The model still trains and scores from a feature table. The only difference is that the feature table now includes neighborhood and structure signals that tabular engineering struggles to capture.
Key Takeaway 4: Simplifying the Graph Schema
Initial modeling started as heterogeneous. Clients and accounts were separate node types. A single client could have multiple accounts, which increases complexity quickly. Transaction direction also mattered, so incoming and outgoing flows were modeled. That design increases fidelity and compute cost.

It is recommended to simplify it into a more homogeneous graph as much as possible before running computationally heavy graph algorithms like PageRank at large scale.
Key Takeaway 5: Generating Graph Features
Feature ideas do not magically appear just because a graph exists. When the network is unlabelled, everything looks the same. The workaround was simple. Write the label onto the graph.
A fraud status was added to client nodes using custom logic, then visualized in Memgraph Lab using styling such as blue and red. With the labeled graph visible, it becomes easier to spot candidate structures worth testing, with triangles mentioned as one example.
Graph features are numeric summaries of a node that depend on neighborhood structure, not just the node’s own attributes. In fraud, this can capture what tabular features miss, for example whether an entity sits in the middle of unusual money flow or is connected to suspicious clusters.
Two feature families were used:
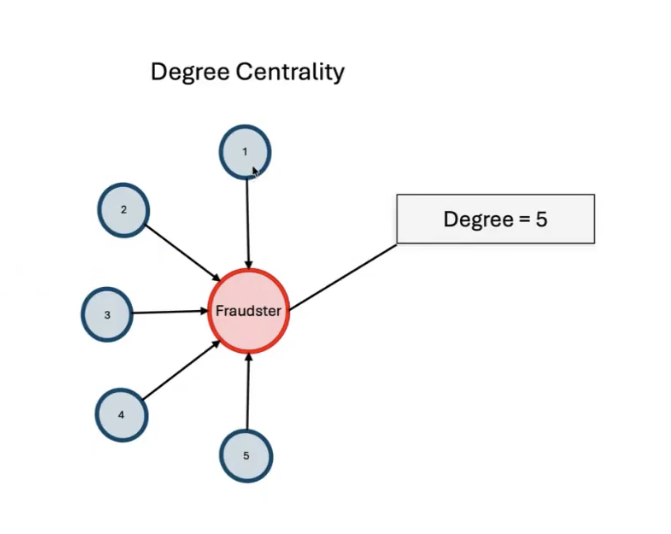
- Algorithm outputs such as PageRank, degree centrality, and community detection.
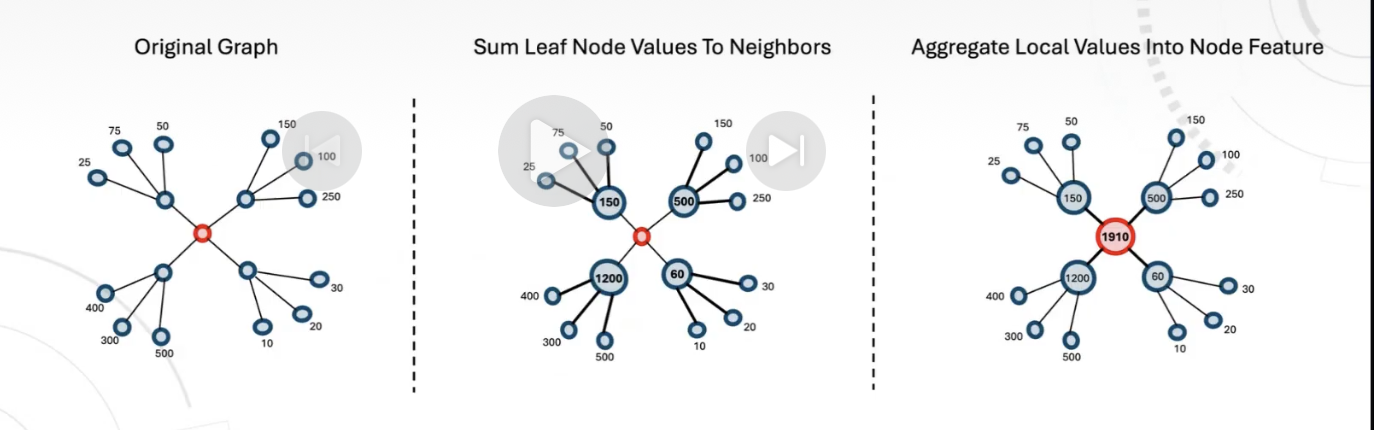
- Connection Behavior Features where values on connected nodes are aggregated toward the target, repeated until the target receives a summarized value. Candidate base values mentioned included total inflow and total expenses.
Time handling decides whether these features help or harm. Features were persisted daily. The graph changes daily. Algorithm outputs change daily. Fraud labels also have a day when an entity becomes fraudulent. A feature like “number of fraudulent neighbors” is invalid if it counts neighbors labeled after the event date being modeled.
Only fraud labels that existed before the event date should be included. Sorting by fraud date in ascending order was also mentioned as a control to keep the timeline consistent.
Key Takeaway 6: Representing Graph Features as Tables
Once graph features exist, the model still expects a table.
Each client ends up represented in tabular form with:
- graph features such as PageRank, degree, and similar structural signals
- the target label
- the target event date
That event date is not optional. It is the anchor that keeps training honest. The session illustrated this with a simple timeline.
A node can gain new connections day by day, and feature values like PageRank can change day by day. Then, on a later day, the node becomes fraudulent. The fraud date is the moment that label becomes true, and it must be tracked.
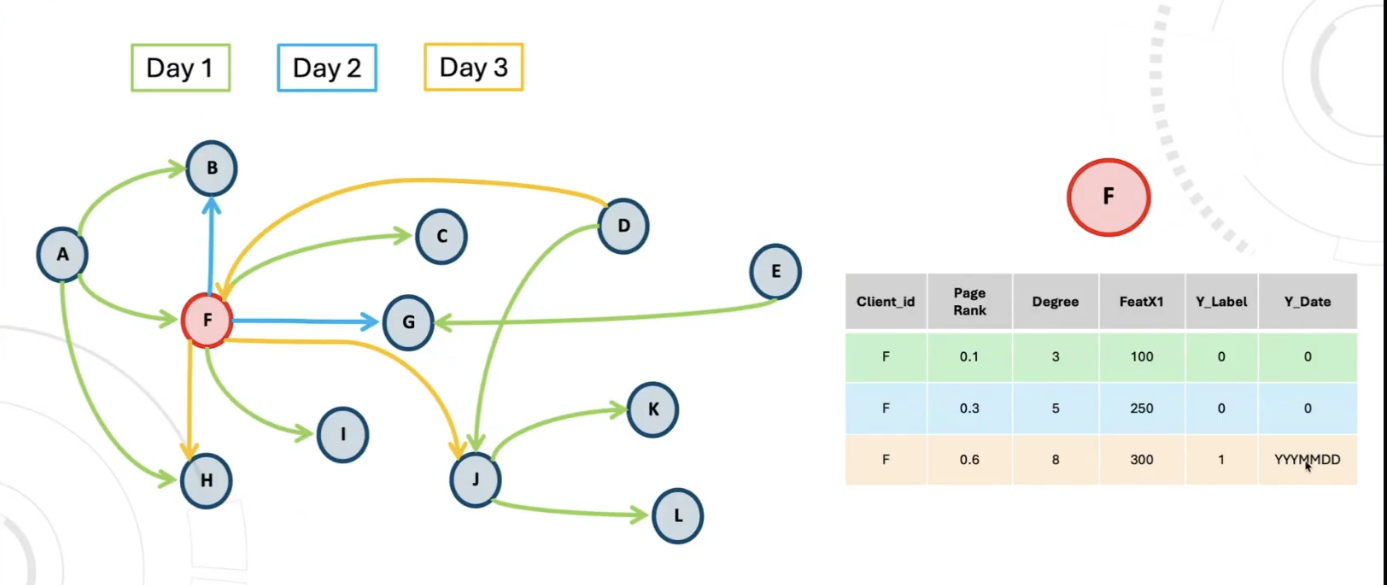
This is also why features were persisted daily into the feature store. The feature store is not holding one static snapshot. It is holding a sequence of daily feature states.
Key Takeaway 7: Solving the Data Leakage Problem
Data Leakage is a data scientist’s worst nightmare and needs to be carefully avoided. Let’s illustrate it using a feature like “number of fraudulent neighbors.” Counting all fraudulent neighbors looks reasonable, until the timeline is checked.
If a neighbor was labeled fraudulent after the event date being modeled, that label would not have been known on the day the prediction is supposed to happen. Including it gives the model future knowledge during training, which inflates offline results and fails in production.
Hence, a strict rule should be enforced. Only fraud labels that existed before the event date should be included. Sorting by fraud date in ascending order was also mentioned as a control to keep the timeline consistent.
Key Takeaway 8: Sampling Matched Daily Graph Structure
Fraud class imbalance was treated as a first class constraint. Fraud is small. Non fraud dominates. Aggregate plots can hide the signal.
Sampling was done daily.
- Keep 100 percent of fraudulent clients each day.
- Randomly sample 1 percent of non fraud clients each day.
Sampling also preserved graph structure, not just class balance. To ensure the 1% of non-fraud clients represented the actual population, their connection patterns were represented using a binary vector containing the following elements:
- incoming connections element
- target node in the middle, represented as zero in the illustration because the depicted target was non-fraud
- outgoing connections element
Pattern frequencies were plotted per day, then non-fraud sampling was performed while preserving the daily pattern distribution.
By applying all this sampling and logic, a final table comes into shape. The feature table scale came up to be 259 total features, out of which:
- 64 tabular (final features selected were 23)
- 195 graph (final features selected were 27)
Overall, it is not recommended to go graph-only immediately. Start with tabular plus graph, then shift over time as graph features mature.
Key Takeaway 9: End-to-End GraphML Architecture
The production path connected Memgraph-based feature generation to Capitec's fraud case management layer. Here's a high-level flow of the architecture:
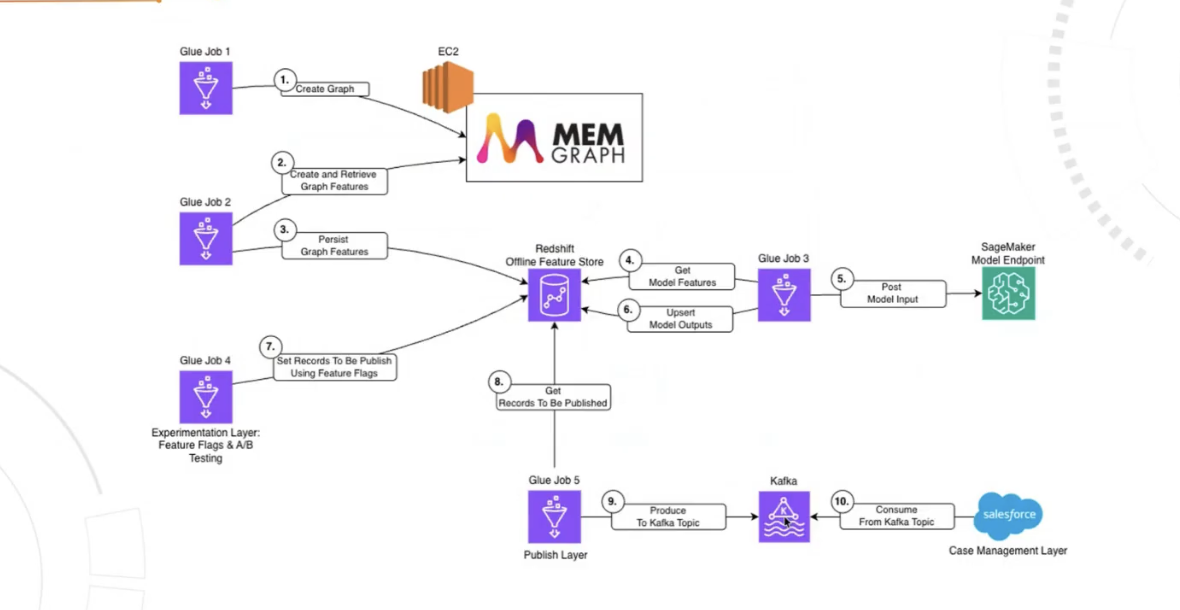
- Build the graph in Memgraph from the node and edge tables.
- Compute or retrieve graph features in Memgraph.
- Persist those graph features into a feature store.
- Score via an AWS SageMaker endpoint.
- Upsert scores back into the feature store.
For distribution, selected records were published to Kafka and consumed in Salesforce for case management.
This pipeline proved to be highly successful at scale with:
- Over 3.5 million records were scored daily, with growth expected.
- End-to-end runtime averaged about two hours per run over a month.
- A low monthly average false positive rate of 2.1.
Wrapping Up
Fraud teams do not need more dashboards. Fraud teams need fewer blind spots.
Watch the full on-demand recording for all the key details behind the key takeaways mentioned in this article, especially the feature design choices and the data leakage example.
Fraud detection gets sharper when transactions stop being treated as isolated events and start being treated as connected behavior. Graph features add missing structure, and the rest of the pipeline becomes easier to reason about.
If that matches the problems being worked on, the full recording is worth the time.
Check out the full Customer Story here!