How to Audit Public Company Filings With a Knowledge Graph
A public company filing rarely contains every fact an auditor needs. Revenue figures may appear in a quarterly report. IPO details may sit inside an S-1 filing. Underwriters, related parties, risk disclosures and supporting financial information may be spread across several more documents.
Answering one audit question can therefore require finding the right passages, reconciling entities and figures, and tracing the conclusion back to its original sources.
In this Memgraph Community Call, Vishal Singh from Quark Labs demonstrated how to turn public company filings into a connected knowledge graph. Using real Reddit filings, he showed how Quark Labs extracts structured information from documents, loads it into Memgraph and helps answer questions that depend on evidence from multiple sources. Watch the full Community Call ing to see the workflow in action.
Key Takeaway 1: Why Are Audits Cross-Document?
Auditors and financial analysts rarely work with one clean dataset. The evidence they need may be distributed across:
- S-1 filings
- Quarterly financial reports
- Financial results
- Risk disclosures
- Offering information
- Related-party disclosures
- Tables embedded inside PDFs
The problem is not simply finding a document that mentions revenue, an underwriter or a related party. The analyst must understand how the facts in one document relate to the facts in another.
In the demo, Vishal used three Reddit documents, including its S-1 filing, financial results and quarterly information. Each document contributed a different part of the company’s financial and organizational context.
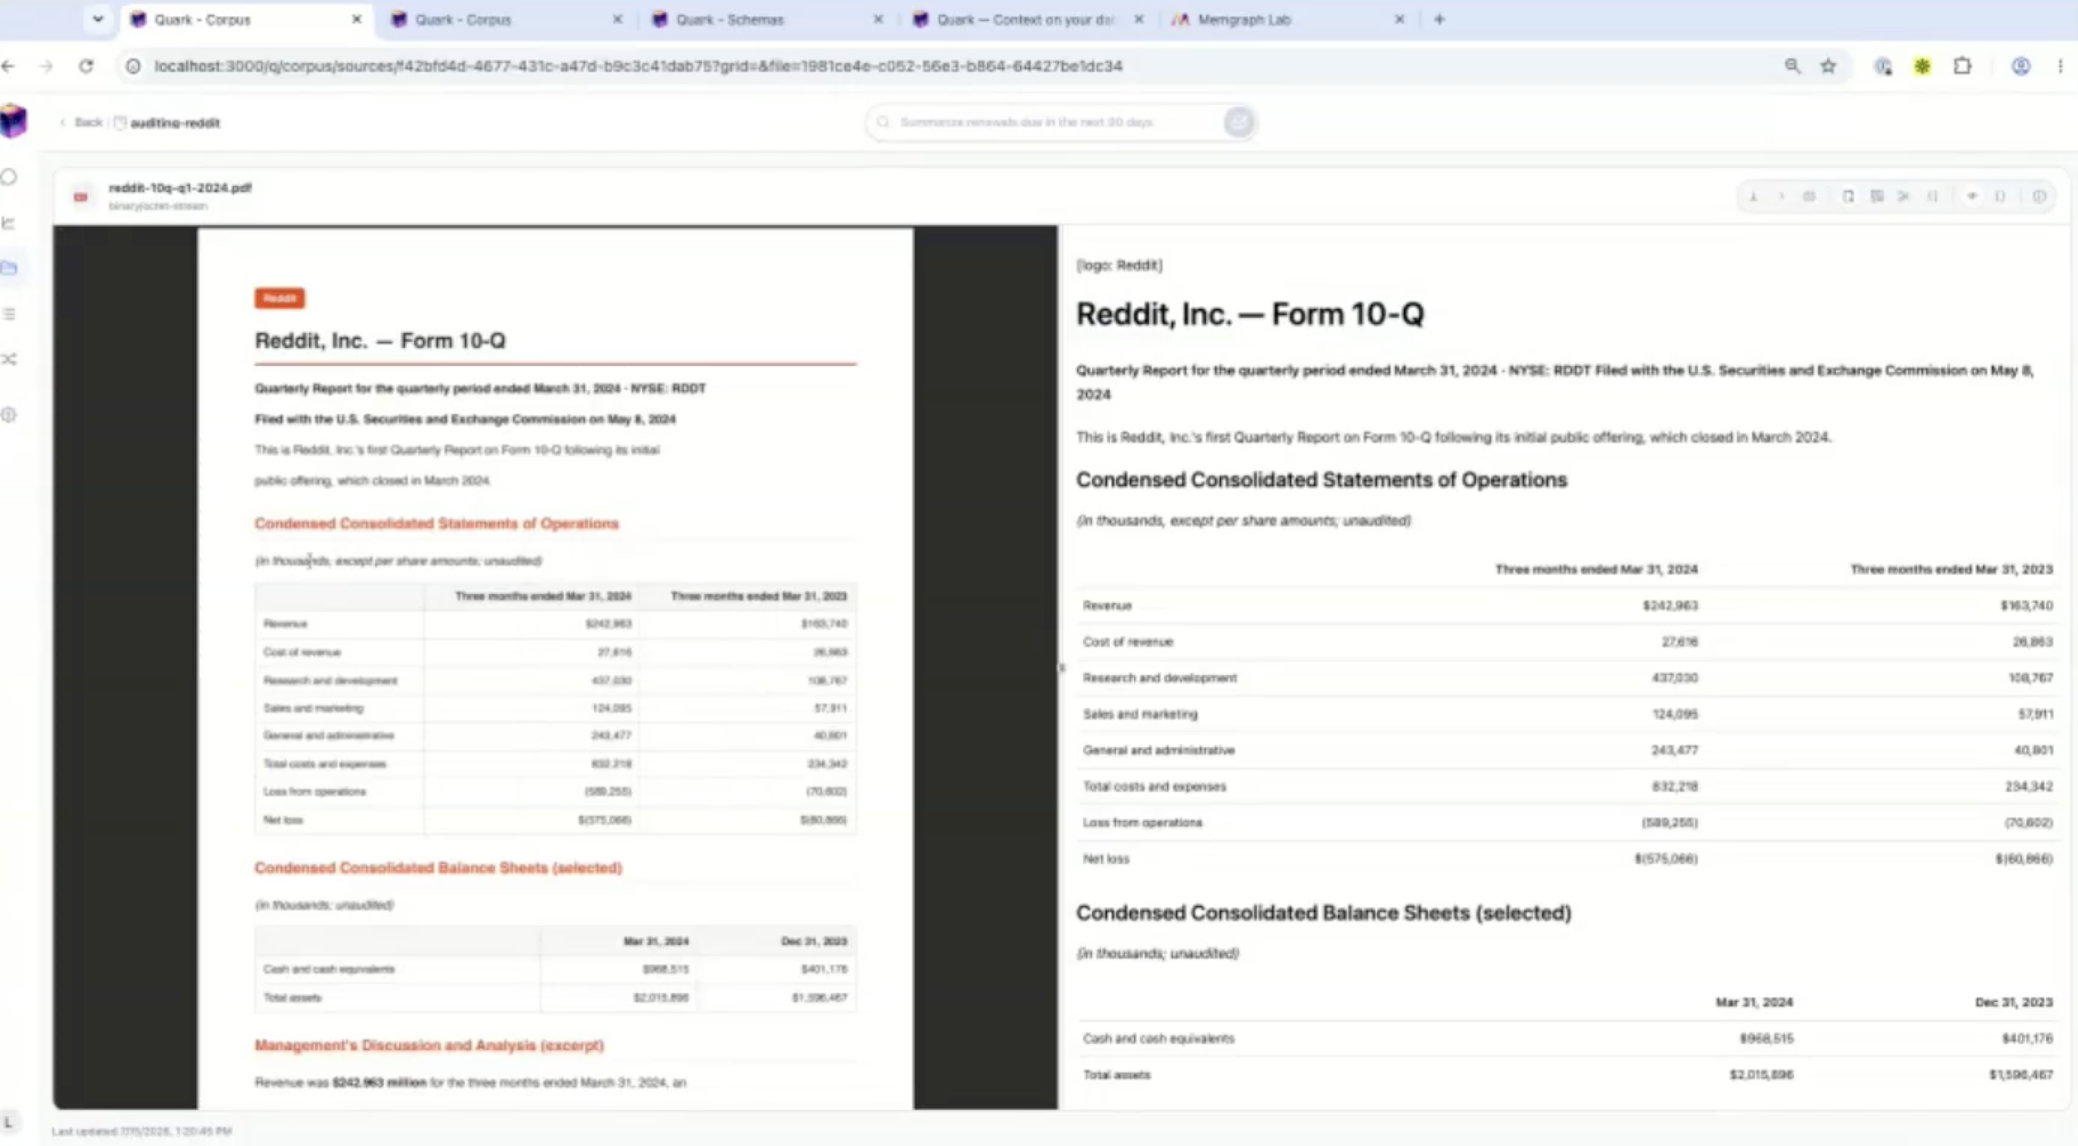
A traditional document search can help locate relevant passages. It does not automatically connect the entities, figures, reporting periods and relationships found across those passages.
That is where a knowledge graph becomes useful.
Key Takeaway 2: What Makes Information Extraction Hard?
Many document-processing tools can convert a PDF into text or Markdown. That solves the first formatting problem, but it does not solve information extraction at scale.
A filing may contain narrative sections, irregular tables, risk factors, financial metrics and entity references. Another filing may present the same information using a different layout or naming convention.
Processing a few documents with custom extraction logic may be manageable. Processing hundreds of differently structured files is a different problem. You may otherwise need to build and maintain separate extraction flows for:
- Different document structures
- Different file formats
- Different entity types
- New reporting requirements
- Changes to the target schema
Vishal described this as one of the main problems Quark Labs is designed to address. Instead of first locating every relevant file and building a dedicated extraction flow for each format, users connect the platform to their data sources and specify the information they need.
Quark Labs then performs discovery, classification and extraction across the available files.
Key Takeaway 3: Where Does the Data Come From?
The source documents do not need to live in one location. During the session, Vishal discussed connecting data from systems such as:
- Amazon S3
- SharePoint
- Google Drive
- Local storage
- Blob storage
- APIs
- Snowflake
For the Community Call demo, the public company filings were uploaded to Amazon S3.
Quark Labs could connect directly to that storage location. When a new file appeared, the platform could ingest it and process its information without requiring the user to upload it manually into each downstream system.
This matters for recurring financial analysis. Public company information does not remain static. New quarterly reports, amendments and supplementary documents continue to arrive. A useful auditing system must update its context as the underlying sources change.
Key Takeaway 4: How Is a Knowledge Graph Built?
Once the documents are connected, the next step is deciding what the knowledge graph should contain. Quark Labs uses classification and entity extraction to identify relevant information inside the files.
Users can provide the graph schema they want or use AI-assisted schema generation when the model has not already been defined. The workflow demonstrated during the session followed this general structure:
- Connect the relevant documents or storage systems.
- Discover and process the available files.
- Identify the entities and information required for the use case.
- Map the extracted information to a graph schema.
- Load the resulting entities and relationships into Memgraph.
In the Reddit example, the resulting graph contained information related to capital, underwriters, related parties and other details extracted from the filings.
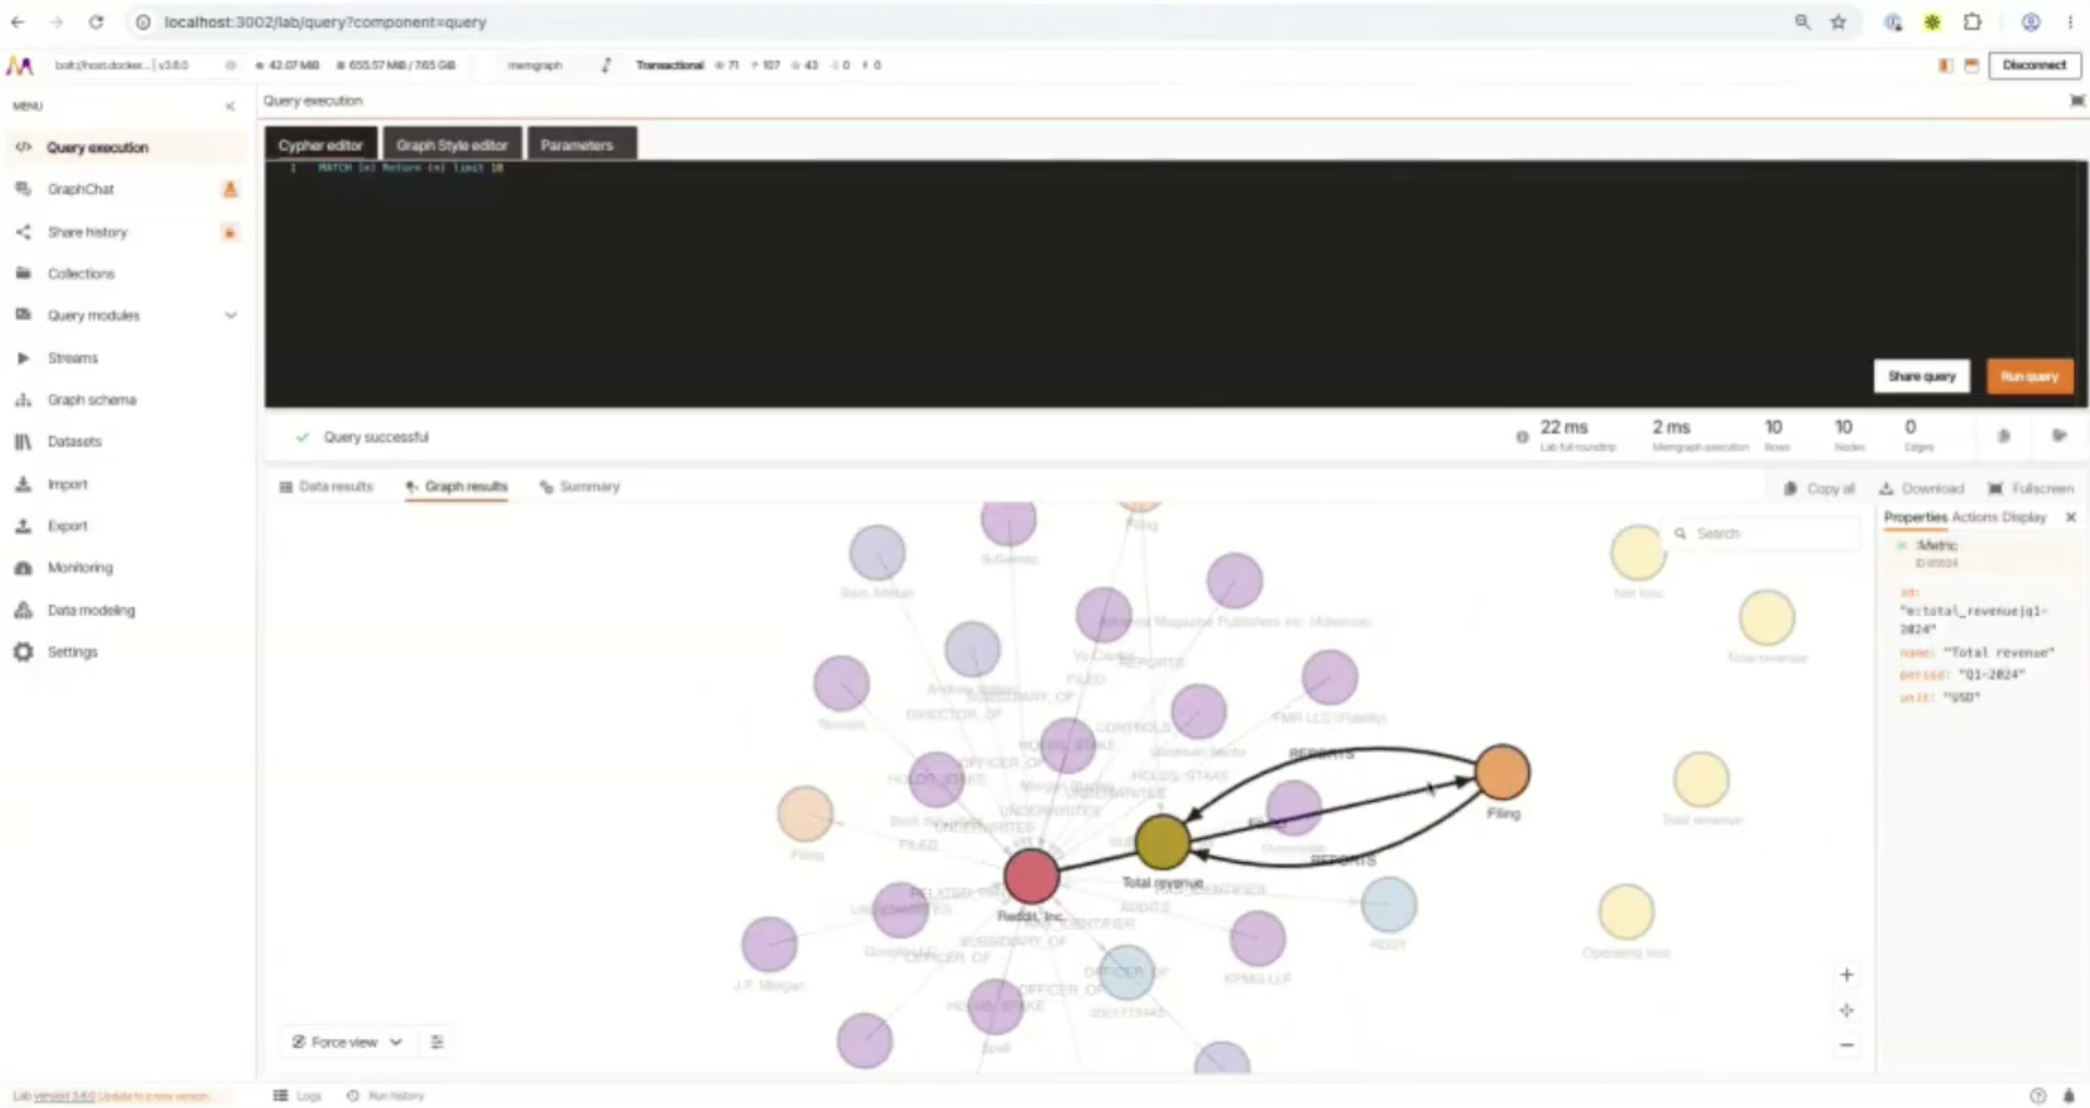
Instead of treating each mention as an isolated text result, the graph connects the information through defined relationships. This gives an application a shared context layer across the full document set.
Key Takeaway 5: How Does Memgraph Connect Data?
Once the extracted data is loaded into Memgraph, the application can work with relationships that span multiple source documents.
For example, an underwriter identified in an S-1 filing can become an entity in the graph. Related offering information, company details and other entities extracted from separate documents can connect to the same structure.
This creates a model that reflects how the information fits together rather than where it originally appeared.
Quark Labs also built a GraphRAG layer on top of Memgraph for querying this connected context. In this setup:
- Quark Labs handles document ingestion, discovery and structured extraction.
- Memgraph stores the resulting entities and relationships.
- The GraphRAG layer retrieves relevant, connected context for a question.
- The application returns the answer alongside its supporting sources.
The session focused on the data pipeline and graph-building workflow rather than the internal retrieval or language model configuration.
Key Takeaway 6: Why Does Traceability Matter?
The value of the graph becomes clearer when a question cannot be answered from one document alone.
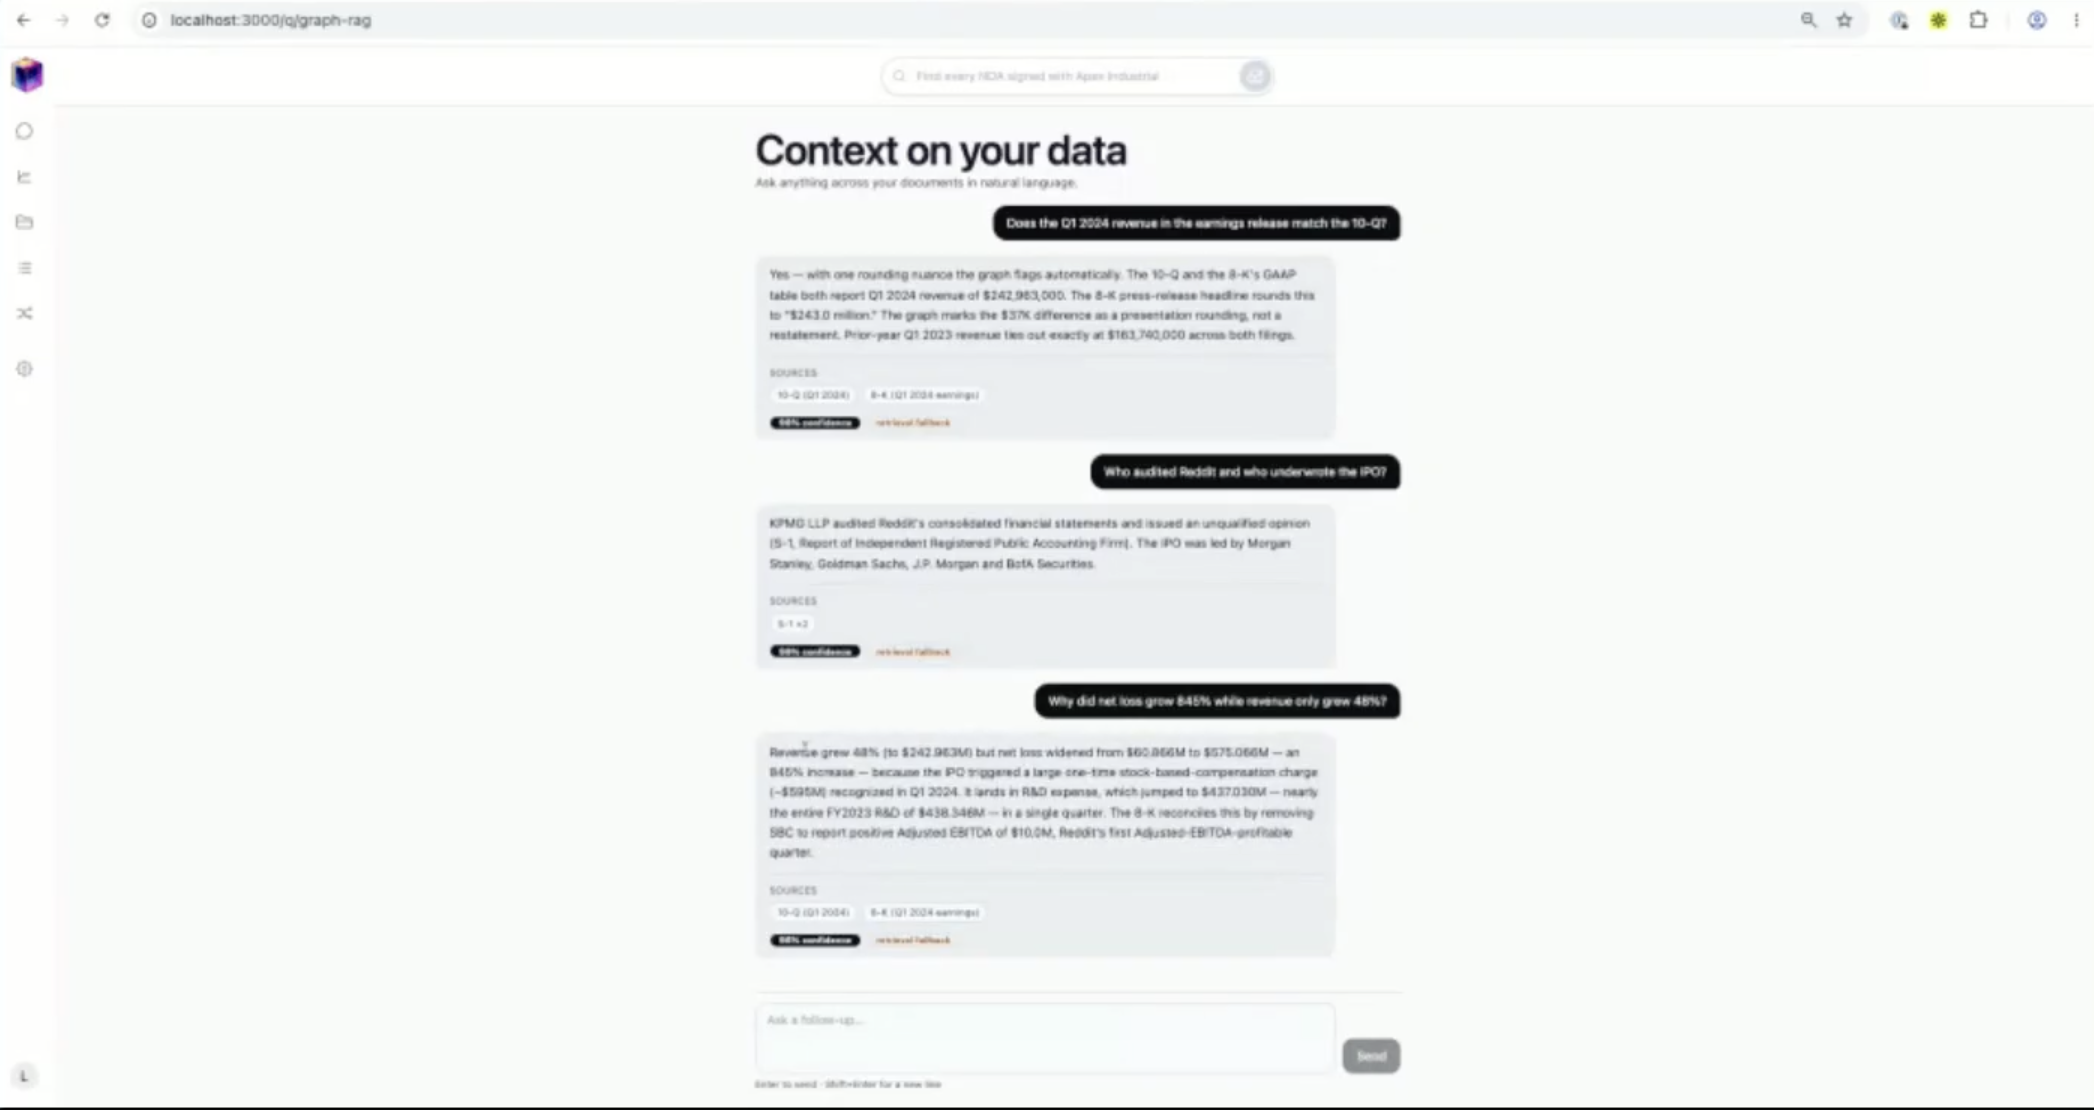
During the demo, Vishal asked how net loss changed while revenue was growing. The answer relied on information obtained from two different sources. The system connected the relevant figures and indicated that the net loss had widened across the compared periods.
The exact financial figures were not the main point of the demonstration. The important part was the path from question to evidence.
The system could:
- Retrieve information from more than one filing.
- Compare related financial data.
- Generate an answer using the connected context.
- Show which sources contributed to that answer.
That last step is critical in an auditing workflow. An answer without provenance gives the analyst another fact to verify. An answer linked to its underlying filings gives the analyst a starting point for reviewing the evidence.
The knowledge graph does not replace professional judgment. It organizes the information needed to apply that judgment more efficiently.
Key Takeaway 7: How Do Pipelines Stay Flexible?
Source documents and business requirements change.
A team may begin by extracting 10 entity types and later require 100. A new filing may use a different structure. The destination may change from a data warehouse to a graph database, or the organization may need to send the structured data to both.
In a pipeline built around hard-coded document formats, each change can require additional engineering work. Vishal described Quark Labs as an adaptive data pipeline that adjusts to changes in:
- Source systems
- File formats
- Extraction requirements
- Graph schemas
- Business use cases
- Data destinations
Users define the information they need and where it should go. The pipeline then adapts its extraction and mapping process around those requirements.
Memgraph was used as the destination for this auditing use case because the application required connected context. Quark Labs can also send structured outputs to Snowflake, data warehouses, data lakes and other systems when the use case calls for a different destination.
Want to See the Full Demo?
The Community Call provides a compact walkthrough of the full process, from connecting the original filings to questioning the completed graph. Watch the recording to see how Vishal Singh from the Quark Labs:
- Extract entities and financial information.
- Define or generate a graph schema.
- Load the connected information into Memgraph.
- Ask questions across multiple filings.
- Trace the returned information to its sources.
Together, this approach shows how turning fragmented filings into a connected knowledge graph can make complex financial analysis more transparent, traceable and scalable.