
How GraphRAG Reduces AI Hallucinations in Retail, Law, Supply Chain, and Banking
A fashion retailer asked an AI agent which in-stock items could be grouped into a new spring collection. The answer named a dress and returned a SKU. The problem: neither existed.
That is what hallucination looks like in production. A confident answer tied to fake inventory.
That is the failure Max Latey from Pinboard Consulting unpacked in a recent Memgraph Community Call. Not as an isolated retail problem, but as a pattern that shows up whenever LLMs answer questions without a reliable model of what exists, how entities connect, and which relationships they are allowed to use.
The solution Max walked through was schema-first GraphRAG: use a defined ontology, ground agents in real entities and relationships, and mix generated graph queries with validated query paths where accuracy matters.
In case you missed the session, you can watch the full replay here!
Below are the key takeaways from Max’s presentation.
Key Takeaway 1: Missing Data Grounding
Companies are moving past GraphRAG POCs and into production or near-production systems. That changes the bar.
A demo can tolerate a rough answer. A production assistant cannot invent a contract clause, a product SKU, a supplier relationship, or a cost dependency.
Max’s team at Pinboard Consulting has worked with organizations across several industries. The data landscapes look nothing alike:
- A law firm with a massive unstructured corpus
- A manufacturer with structured supply chain systems
- A fashion retailer with one highly structured but high-dimensional data source
- A global bank combining contracts, CRM, sales, and product data
The common thread is not the industry. It is the need for a schema and ontology that gives LLMs a grounded structure to work with.
Without that structure, the model has to reason over messy context directly. It burns tokens. It needs more context. It becomes slower. And, sooner or later, it starts filling gaps with confident nonsense.
GraphRAG changes that pattern by giving the model a connected map of the data.
Key Takeaway 2: Legal AI Retrieval Use Case
The first use case came from a large law firm building a legal assistant chatbot. The user scenario was broad but familiar:
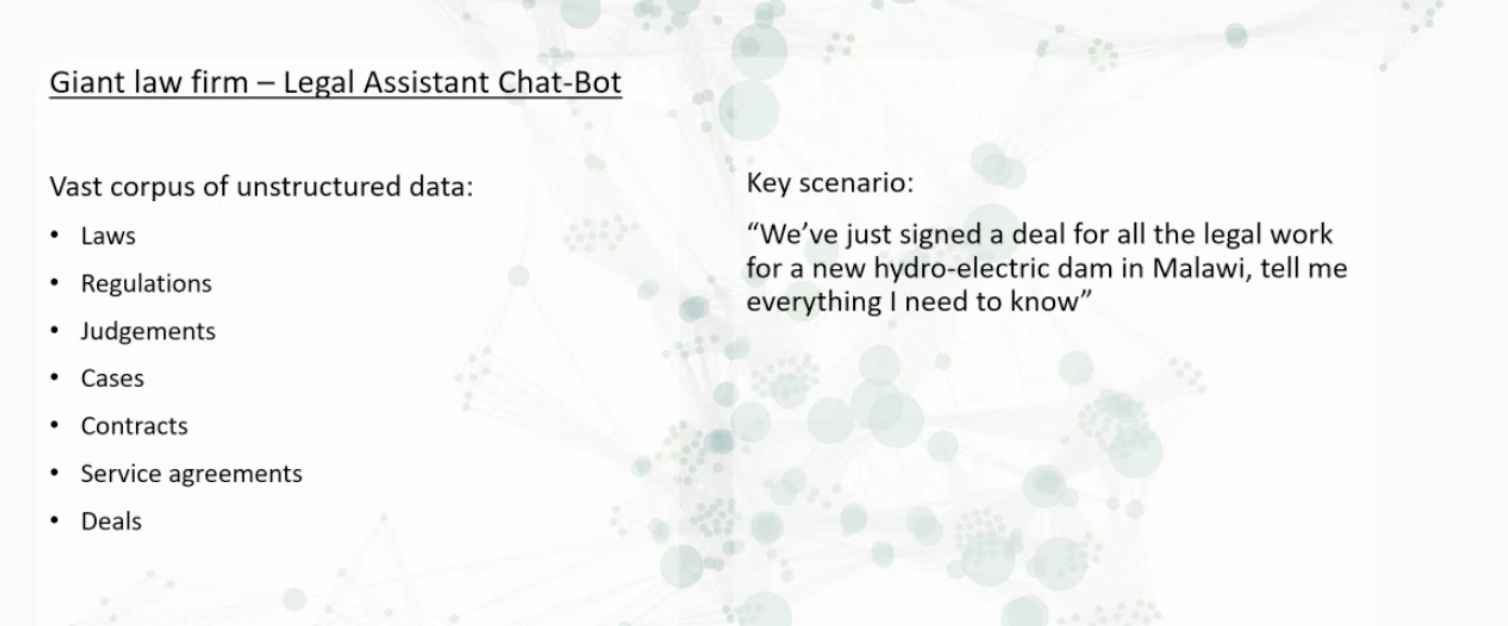
Imagine a senior lawyer starting work on a new hydroelectric dam project in Malawi. The goal is not to find one similar paragraph. The goal is to collect the legal context that actually matters.
That context could sit across:
- Government laws and regulations
- Court judgments
- Case notes and reporting
- Previous contracts
- Service agreements
- Addendums
- Subcontracts
- Clauses buried inside older documents
The client had already tried a vector-only approach. It struggled because the hard part was not semantic similarity.
The hard part was interdependency. A clause can matter because of its relationship to a regulation. A previous contract can matter because it has structural similarity to a new deal. A judgment can matter because it changes how a term should be interpreted.
That is where graph becomes useful. GraphRAG gives the assistant a way to follow relationships, not just retrieve nearby text. For legal AI, that difference is not cosmetic. It is the difference between a helpful assistant and a risky one.
Key Takeaway 3: Supply Chain Cost Modeling & Attribution Use Case
The second use case moved from unstructured legal data to structured manufacturing data. The client was a global manufacturer working on supply chain cost modeling and attribution.
The business question looked something like this:
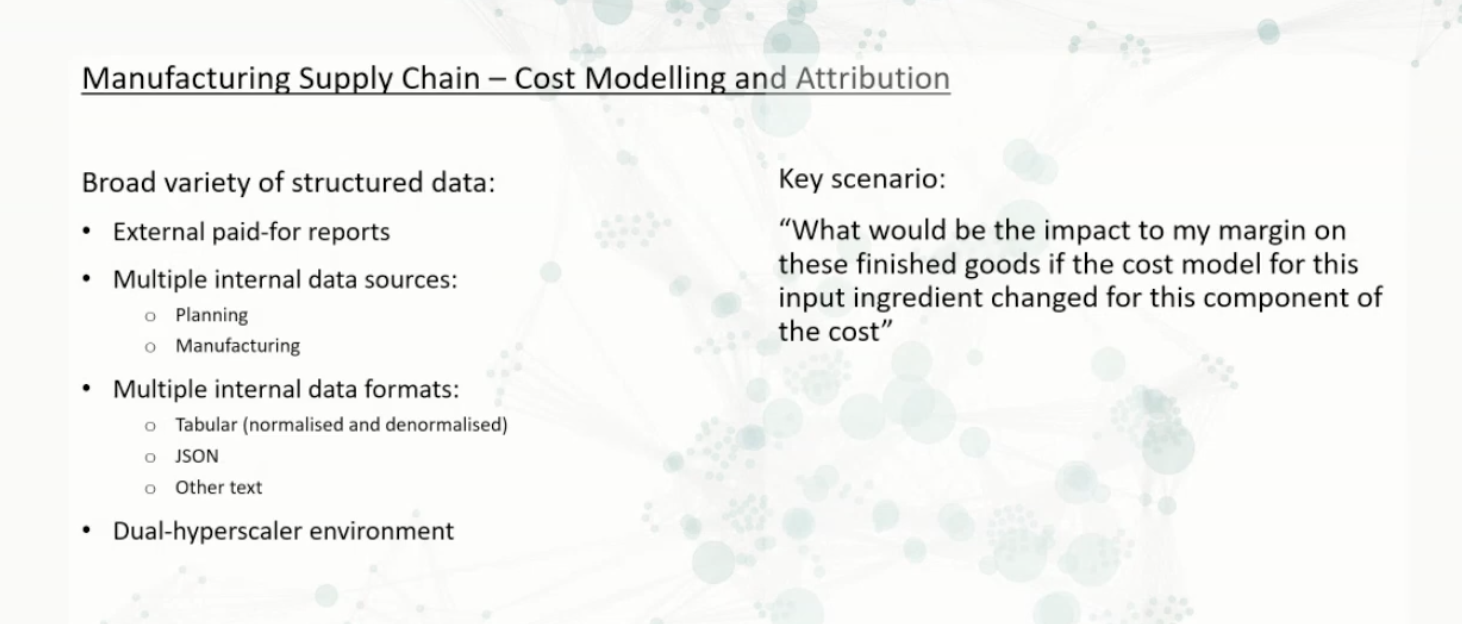
That question sounds simple until you trace the data. Margins usually sit at the finished goods level. Cost changes often start much lower, around ingredients, packaging, raw materials, or components.
Max used the example of plastic wrap.
A cost model for plastic wrap may include energy, crude oil, ethene, ethoxylation, ethylene, and polyethylene. If the price of one input changes, that change needs to propagate through the bill of materials and eventually show up at finished goods margin.
Try to solve that with table joins and you quickly hit pain. The data may come from a broad variety of structured data sources:
- External paid-for reports
- Excel
- JSON
- Multiple internal data sources like SAP for:
- Planning
- Manufacturing
- Multiple internal data formats:
- Tabular (normalised and denormalised)
- JSON
- CSV
- Fixed width text
- Dual-hyperscaler environment (Azure and GCP)
The graph gave the LLM a connected structure to query. A bill of materials is a directed acyclic graph (DAG), where finished goods connect to packaging, components, ingredients, raw materials, and cost model inputs.
The technical pattern is to model those dependencies as a graph so the LLM can query them through the graph layer.
This is an important point for GraphRAG builders. GraphRAG is not only useful for unstructured documents. It also helps when structured data has deep dependencies that are painful to query with joins.
Key Takeaway 4: Retail Inventory Use Case
The fashion retail use case was the clearest example of hallucination in the session.
The client was a large online fashion retailer with a single source of highly structured data. The data was clean compared with the other examples, but it was extremely high-dimensional.
Inventory alone included SKU-level, warehouse-level, and stock-level details. Product data included color, cut, theme, material, fabric, and detailing. The wider system also included website, purchasing, marketing, customer, and sales data.
The business goal was:
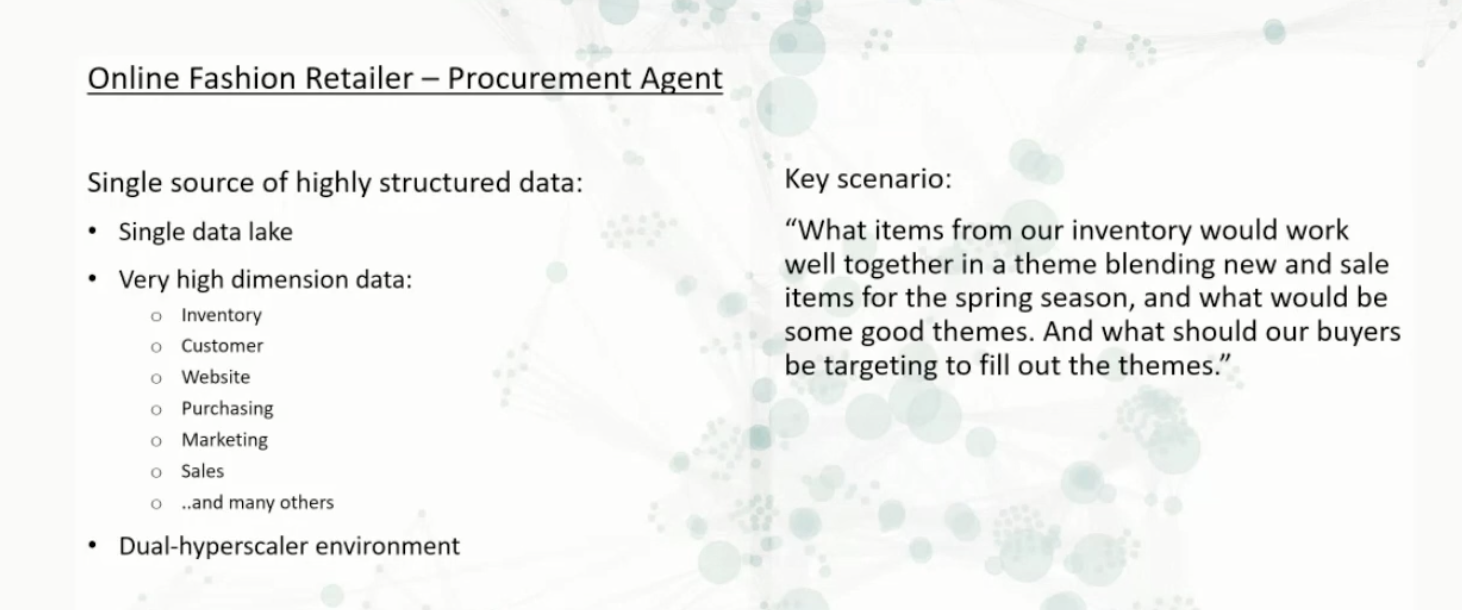
LLMs are good at that kind of creative merchandising task. Until they make up fake inventory details.
Before the graph solution, the retailer pointed the LLM at the data and asked it to recommend items that could work together in a theme. The model produced an attractive recommendation.
The problem was that the item did not exist. The detailing did not exist. The SKU did not exist. It made the whole thing up.
The graph solution changed the behavior by anchoring generation in real inventory data. The LLM had a defined schema and a graph of actual relationships across products, stock, themes, and attributes.
Now the system could still support creative theme generation, but only against products and relationships that existed in the data.
Key Takeaway 5: Banking Customer 360 Use Case
The banking use case mixed structured and unstructured data for commercial customer 360. The bank wanted to combine PDFs, contracts, product descriptions, CRM data, sales data, and finance data to support better lending recommendations.
The business question was simple:
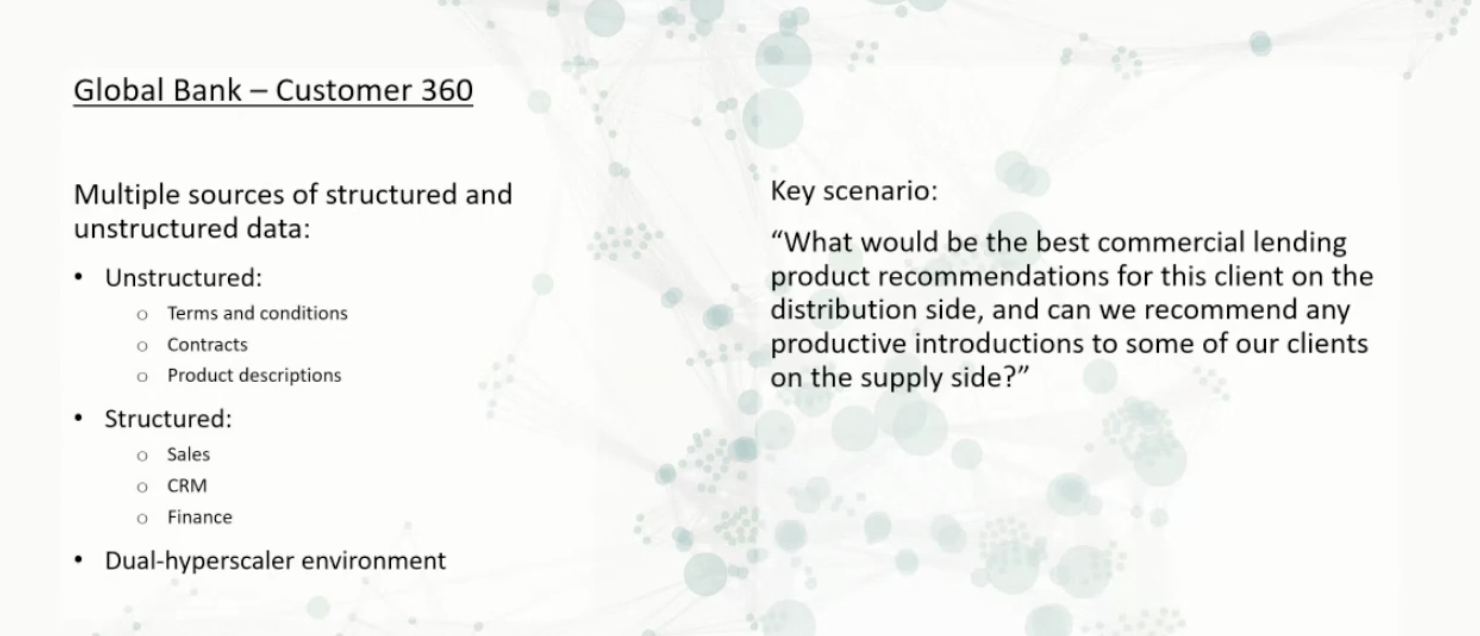
Max used a water pump example. A company in America distributes water pumps. The bank may also have a client in Turkey that manufactures them. The opportunity is not just to recommend a product, but to discover a useful commercial relationship.
That is why a single retrieved chunk is not enough. The system has to connect clients, products, contracts, geographies, internal sales knowledge, and supplier relationships.
This is important to note that this was a multi-agent scenario, not a single chatbot. The project was not yet in production, but the team was starting to get good results.
GraphRAG was necessary because the recommendation depends on relationships. A graph layer gives agents a way to follow those relationships instead of treating each source as an isolated document or table.
Key Takeaway 6: A Single GraphRAG Architecture Pattern
Max then pulled the use cases into a single GraphRAG architecture pattern.
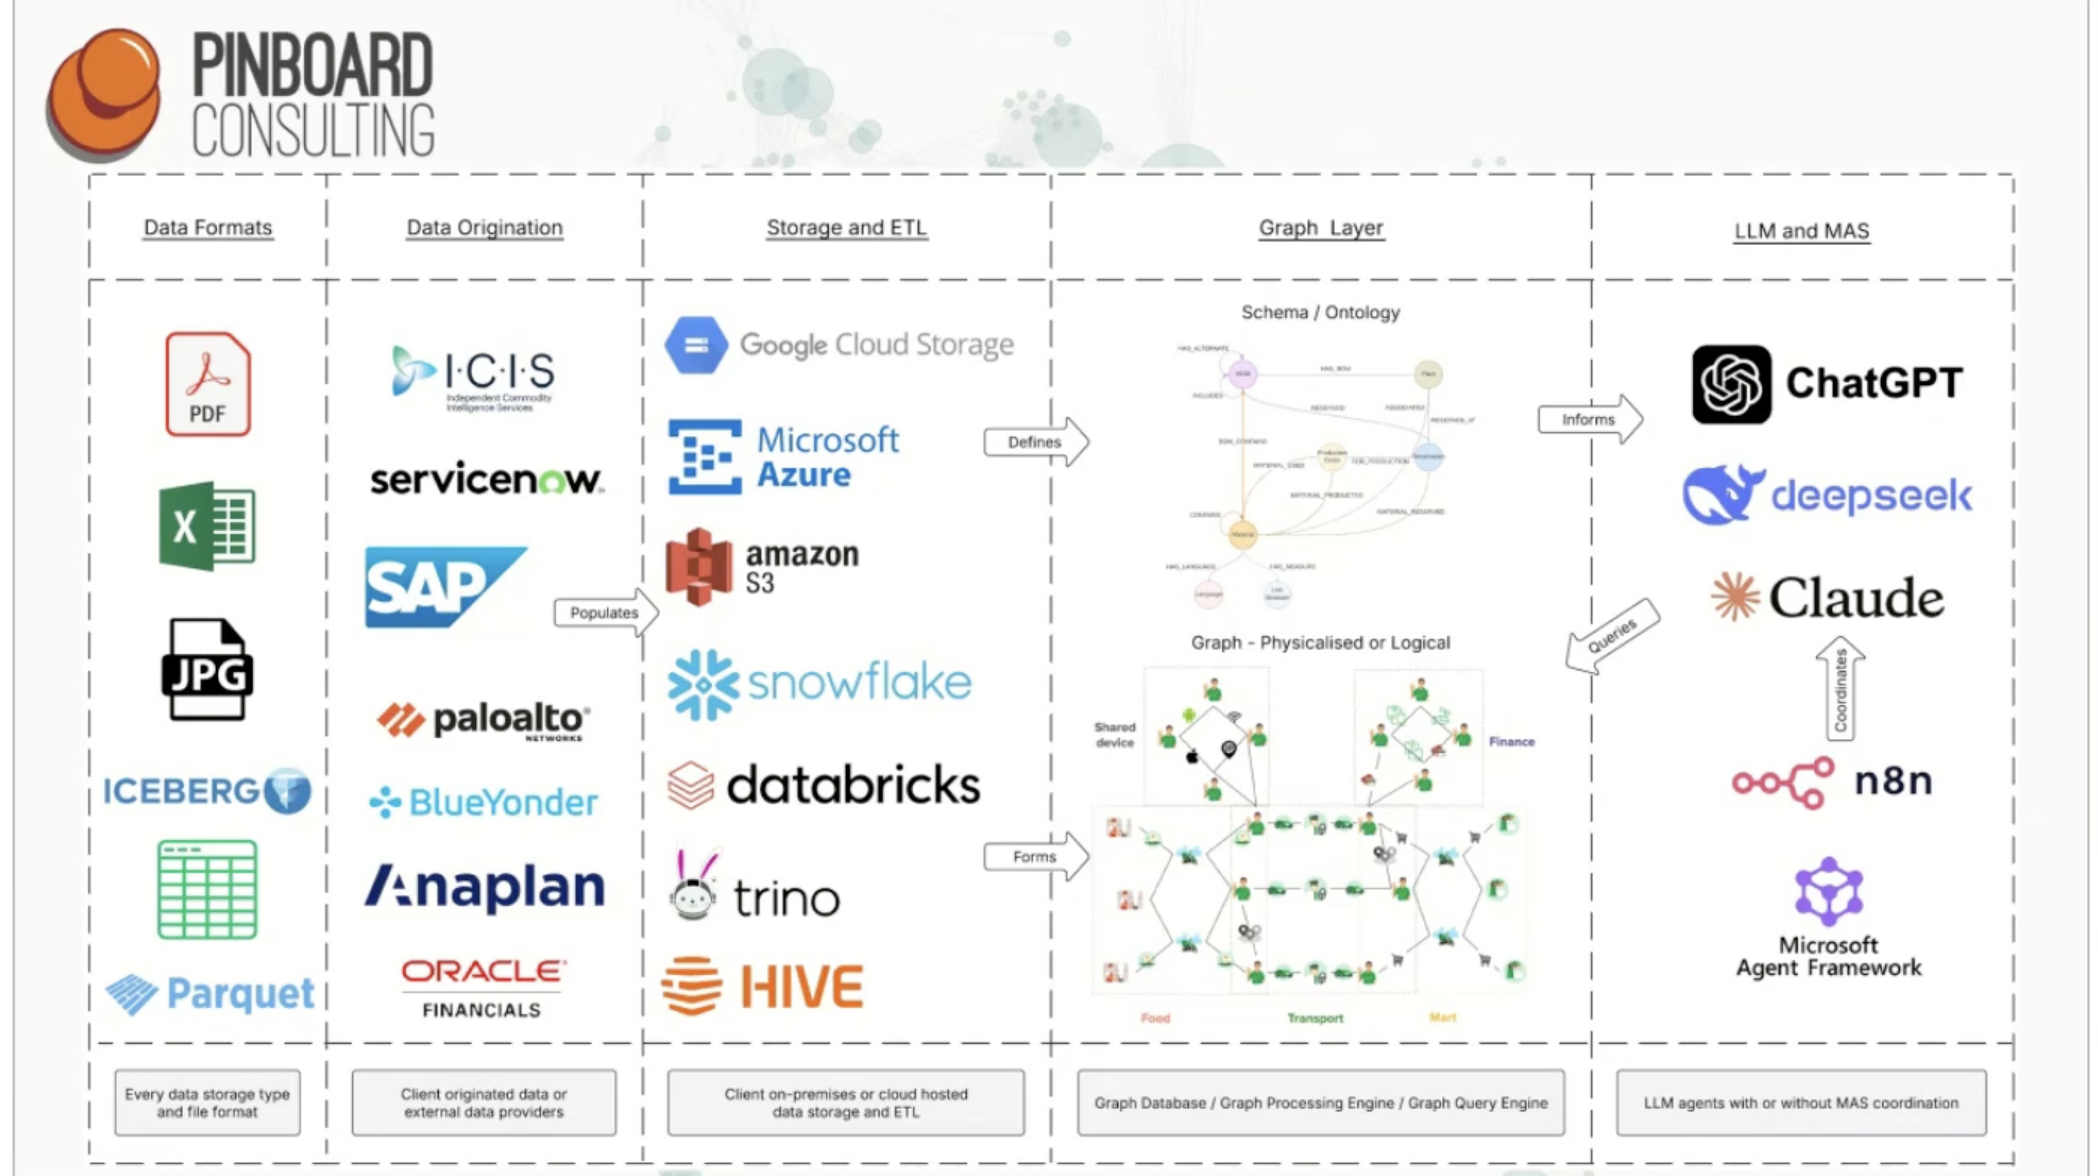
On one side, you have enterprise data architecture. On the other side, you have LLMs and agentic frameworks.
The important layer sits between them: the Graph Schema or Ontology.
That graph does not always need to be physicalized. A physical graph means you write nodes and edges into graph memory or graph storage. A logical graph means the data stays where it is, but you define a graph model on top of it.
For teams that cannot move data easily, a logical graph can be attractive. The data may remain in relational tables or existing storage, while the graph model defines which objects represent nodes, edges, and properties.
Max pointed to this as a wider industry direction. Memgraph is also moving in this direction with Memgraph Zero, which lets teams query data where it lives as a graph.
The larger lesson is simple: the ontology is the central asset.
Whether you use a physical graph or a logical graph depends on your workload, data movement constraints, latency needs, and architecture. But the model still needs structure.
Wrapping Up: Stop Asking LLMs to Guess the Data Model
The failure mode Max showed is not limited to one industry.
A legal assistant can miss the relationship between a clause and a regulation. A supply chain assistant can lose the path from raw input cost to finished goods margin. A retail agent can invent SKUs. A banking assistant can miss the relationship between a client, a product, and a supplier.
The fix starts with structure.
A schema-first GraphRAG architecture gives agents a model of what exists, how it connects, and what they are allowed to query. That does not make hallucinations impossible. But it gives the system a far better chance of staying grounded in real data.
For the full breakdown of Max Latey’s use cases, architecture choices, and Q&A, watch the on-demand Community Call.
If your team is building GraphRAG over data that cannot easily be moved or copied, start by mapping the entities, relationships, and access patterns your agents need. From there, explore whether a physical graph with Memgraph Database or a logical graph with Memgraph Zero is the better fit for grounding those answers in real data.
Q&A
Here’s a compiled list of the questions and answers from the community call Q&A session.
Note that these are paraphrased slightly for brevity. For complete details, watch the full community call recording.
-
Is the Supply Chain Cost Modeling and Attribution use case a text-to-Cypher application?
-
Text-to-Cypher, or more broadly text-to-graph query generation, was part of it. I will not say exactly which graph language was used, but most graph languages are either Gremlin-based or Cypher-based, so the general idea is natural language questions being translated into a structured graph query language.
That was an important part of the solution, but it was not the whole thing. Before good text-to-Cypher, text-to-GQL, or text-to-Gremlin became possible, many graph systems relied on pre-canned queries. You would have a set of predefined queries, then the LLM would choose the one that looked closest to the user’s question, execute it, and turn the result back into natural language.
In this case, we used both approaches. Very complex scenarios still used pre-canned queries worked out with business users in advance. Simpler questions could be handled through direct text-to-graph query generation.
-
-
Would that mean that the key challenge was the heterogeneous nature of the data?
-
Yes, absolutely. The challenge was the huge variety of data. On one side, you have the user question. On the other side, you have a large variety of data sources, data formats, and storage systems. The architecture has to connect those two sides.
Across different data formats and different origins of data, the useful pattern is to have a graph schema or ontology, either as a physicalized graph or a logical graph, that can inform the agents. The agents then query the graph-informed structure rather than trying to reason over all the raw complexity directly.
-
-
How are the ontologies used? Are they extracted or used for constraining LLMs? Can you get into some details of physicalized or logical graphs?
-
In all of these instances, the ontology or schema was structured. Even if it had been discovered first, it was reviewed and analyzed, and a human being, potentially with help from an LLM, would design a defined schema.
There are good tools for flexible schemas, and some GraphRAG solutions will automatically discover a schema and use it flexibly. But in the cases discussed here, we had a defined schema.
That defined schema was used by agents or LLMs almost like a guardrail. Whether it was included in the prompt or handled by a specific schema agent, the instruction was: use this schema. These are the properties, node types, edge types, and relationships. You cannot make up properties that do not exist. You cannot make up entity types that do not exist. You cannot make up relationships that do not exist.
That is one of the ways the systems got better results and reduced hallucination.
-
-
What are actually the logical graphs?
-
A logical graph is where you do not change the underlying data. If the data is already in tables, you leave it there. It might be in large denormalized tables, second normal form tables, or tables with primary and foreign keys. You can still build a graph model of that data without having a graph database that physically stores the nodes and edges.
You might design the ontology on a whiteboard, Lucidchart, or draw.io. Then you tell the chosen system what the objects are, where the nodes are, where the edges are, and where the properties are. The system can then execute a graph query over the underlying data.
In a physical graph, you write nodes and edges into graph memory or graph storage. In a logical graph, you do not do that. You do not run ETL, you do not transform the data, and you do not take a copy of the data into graph storage. You query the existing data through a graph model.
-
-
How do you pass the graph extraction to the LLM? What is the format that is used?
-
The format is not the important part. You can pass it as JSON, YAML, raw text, or another readable format. Personally, we tend to use YAML because it is a good blend of human-readable and machine-readable. It is structured, easy for people to read, and does not have all the curly brackets and quotes that JSON has.
But it does not have to be YAML. You could use plain text and say there is a node called BOM, there is a node called PLANT, and there is a relationship called hasBOM between BOM and PLANT. LLMs are smart enough to work with that kind of structured description.
-
-
How is ingestion done? What are the frameworks or libraries that you used? And if you used LLMs for extraction from unstructured data, what did you use?
-
As a consultancy, we tend to use whatever the client already has. If they are a ChatGPT house, we use ChatGPT. If they like LightRAG, we use LightRAG. If they have another preferred tool or model, we work with that.
If the client has a completely greenfield environment and no preference, we look at their infrastructure and choose what seems like a good fit. But in our experience, the specific extraction tool does not make as much difference as the decision to use graph in the first place.
The first-order decision is: use a graph. The second-order decision is: do we physicalize it or use a logical graph? The specific framework or model used for structured or unstructured extraction is a third-order decision. That landscape changes so quickly that something new may be better next week.
-
-
How do customers see value from these systems? How do they measure success?
-
Most of them do not have a well-defined ROI. One case where there was a clearer ROI was entity resolution, where the client wanted to attribute different properties to a single customer across isolated systems. One system might have a good address, another might have a good email, another might have a good mobile number, but those systems are disconnected.
In that case, marketing could calculate the value. If they could contact an extra percentage of customers, they could use their marketing cost and benefit models to estimate the gain. But that is unusual.
For most of these projects, clients are looking for “better,” which is hard to put a number on. There is also a strong fear of falling behind. Companies know competitors are making progress with these systems, even if they keep the details quiet. The feeling is: if we do not do this, we will be outcompeted.
A lot of the value is also about learning. Companies are trying multiple approaches, finding the few that work, stopping the ones that do not, and rolling out the successful patterns. That is the direction we are moving into: finding repeatable architecture patterns and applying them across teams, products, and productivity challenges.
-