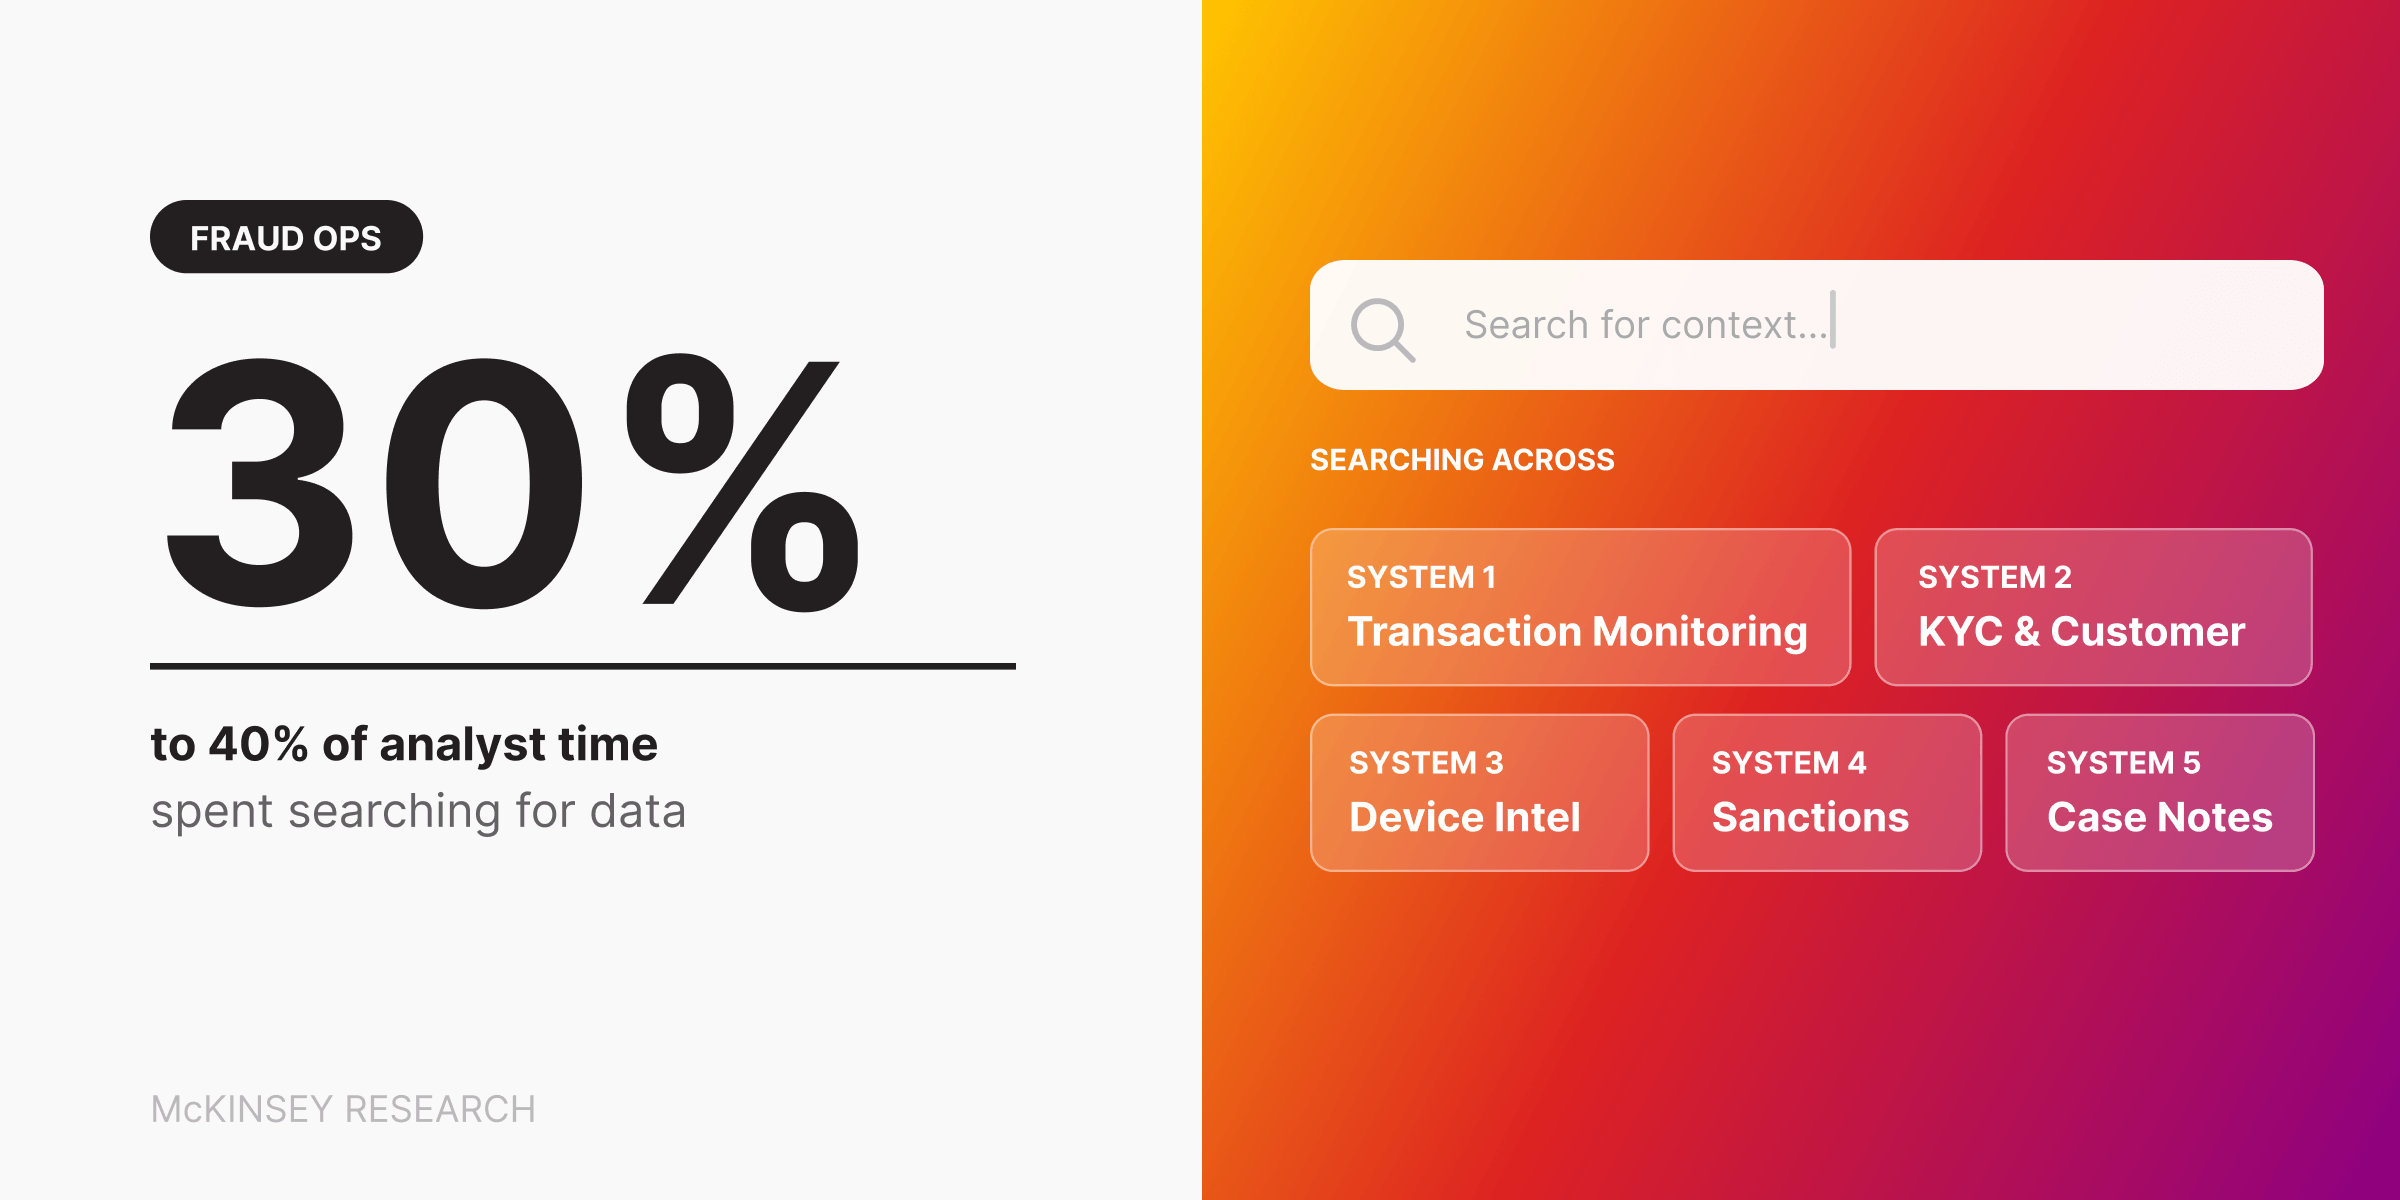
Why 30% to 40% of Time Spent Searching for Data Hurts Fraud Operations
A fraud team can have years of transaction history, customer records, device intelligence, sanctions data, prior alerts, and case notes, then still struggle to answer a basic question fast enough: is this pattern actually risky, or does it only look unusual in isolation?
That delay is not usually caused by missing data. It happens because the surrounding context is scattered across disconnected systems, and analysts have to reconstruct the picture manually before they can act.
In fraud operations, that kind of delay is not just inefficient. It slows investigations, weakens explainability, and makes risky patterns harder to surface in time. It is actually one the core drivers behind the $485.6 billion global losses caused by fraud scams and bank frauds in 2023 alone.
Why Fraud Teams Struggle to Find Context
A lot of fraud programs still describe the challenge in terms of scale. Too many alerts. Too many transactions. Too many entities. Too many systems. That is real, but it is not the core issue.
McKinsey has reported that data users can spend between 30% and 40% of their time searching for data when there is no clear inventory of what is available. In fraud operations, that is not just a productivity problem. It means analysts can spend a meaningful share of their time locating context instead of assessing risk.
The harder problem is fragmented context. A fraud or AML analyst usually does not need more raw events. They need to know how the events connect:
- Did this beneficiary already appear in prior cases?
- Has this device touched multiple identities?
- Does this account sit one or two hops away from known mule activity?
- Did a low-priority alert become high-risk once you looked at the surrounding network?
Those are not simple lookup questions. They are relationship questions.
Why Fraud Systems Miss Connected Risk
Most fraud stacks were built around events, thresholds, and isolated alerts. That works well for obvious cases. It works much less well when risk emerges through relationships.
A single payment may look normal. A single account may not stand out. A single device fingerprint may be weak evidence on its own. But the pattern changes when those entities are viewed together.
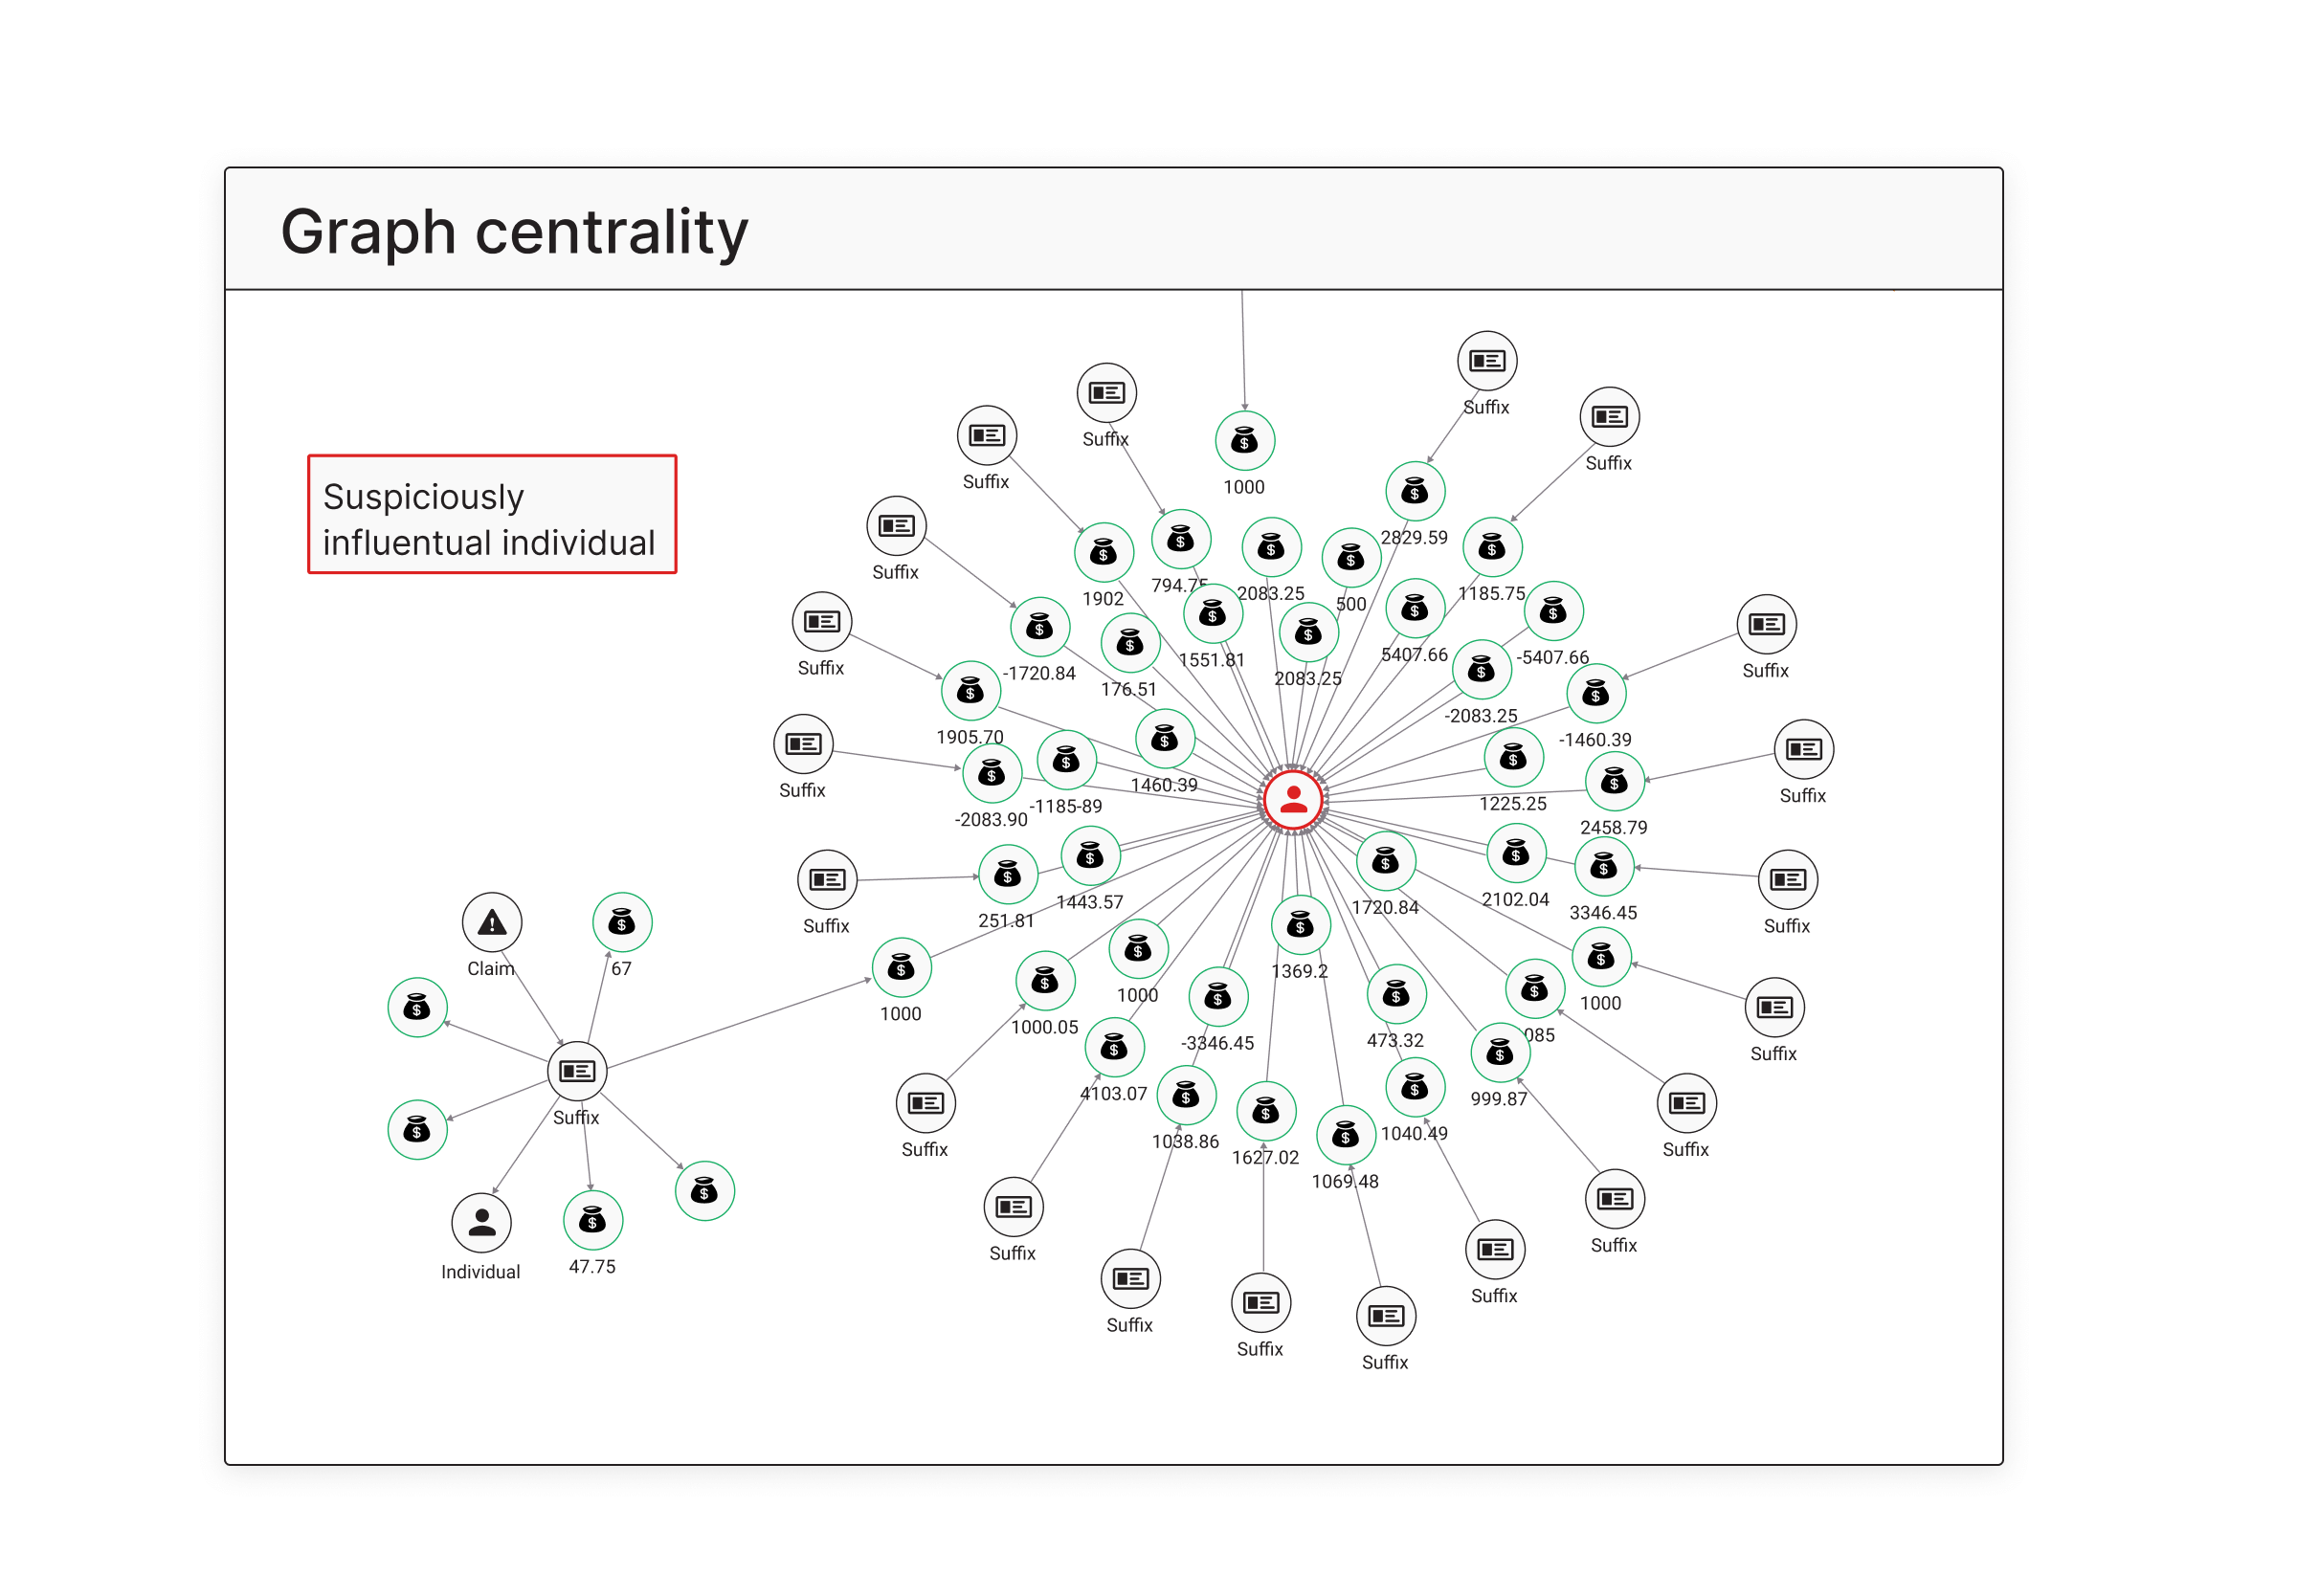
Graph analysis can help surface signals that are visible only at the network level. Graph algorithms such as centrality can identify entities that occupy unusually influential positions within a transaction or claims network.
A person, account, or beneficiary may not appear suspicious in isolation, but an unusually central position like connecting many transactions, claims, or related entities can make it worth closer investigation. Centrality is therefore a prioritization signal, not proof of fraud.
Traditional tabular systems struggle with this kind of network reasoning. They can confirm that one field matches another, but they are much weaker at showing how risk propagates across a connected set of entities.
This is where a knowledge graph becomes useful. It represents customers, accounts, devices, payments, beneficiaries, claims, counterparties, and case history as connected entities rather than isolated records. That makes it easier to ask how a suspicious pattern spreads through the network, not just whether one row crosses a rule threshold.
What Fragmented Context Looks Like in a Real Investigation
In most banks and insurers, the relevant context is split across operational systems. Transaction monitoring may live in one platform. Customer and KYC data may live in another. Device intelligence may come from a third-party tool.
Sanctions and watchlist checks may run elsewhere. Alerts may be triaged in a case management system. Investigation notes often sit in analyst workflows that never feed back into the broader picture.
The result is predictable. Analysts become the integration layer. They pull data from different systems, reconcile identifiers, compare notes across tools, and manually reconstruct the path that should have been queryable from the start. In fraud operations, that cost shows up as slower investigations, duplicated work, and delayed intervention.
Why $485.6 Billion Makes This More Than a Workflow Problem
Nasdaq estimated that fraud scams and bank fraud schemes drove $485.6 billion in projected global losses in 2023. That number should not be treated as background noise for the industry. It shows that weak context retrieval is not just an internal process problem. It makes risky relationships harder to find when needed.
Financial crime is unusually dependent on connected behavior.
Fraud rings, mule networks, synthetic identities, layered money laundering schemes, and coordinated claims abuse rarely appear as one obvious event. They emerge through repeated links across accounts, devices, addresses, beneficiaries, policies, claims, and transaction flows.
That is why financial institutions can have mature rules, capable data teams, and machine learning in production, yet still miss important patterns. The issue is not always whether the institution captured the signal. The issue is whether the surrounding context was visible in time of capture.
This also explains why explainability becomes harder in fragmented environments. If the reasoning path lives partly in one system, partly in another, and partly in the analyst’s head, it becomes much harder to defend why a case was flagged, escalated, or deprioritized.
What Multi-Hop Fraud Risk Looks Like
Consider a real investigation question:
Is this newly flagged account connected to previously known mule activity through shared devices, reused beneficiaries, linked addresses, or accounts that sit two hops away from prior confirmed fraud cases?
That question crosses multiple entity types and multiple systems. It also depends on connection, sequence, and structure, not just similarity. A flat table can confirm that one value appears somewhere else. It is much worse at showing whether a broader fraud structure is repeating.
A knowledge graph is better suited to that job because it makes the surrounding network part of the query, not something the analyst has to rebuild by hand after the alert is already in front of them.
A Practical Example From Global Banking
You can see this clearly in authorized push payment fraud. A payment may look legitimate in isolation because the customer initiated it voluntarily. The real signal often sits in the surrounding network.
Capitec, a leading South African retail bank, described this challenge in practical terms. Multiple victims could connect back to the same destination accounts, intermediaries, or transaction paths, but those links were not obvious when cases were reviewed one by one. The team moved from manual investigation maps to graph-based analysis that could trace deeper multi-hop relationships across connected accounts. That shift helped them process more than 3.5 million records per day in about two hours on average while keeping monthly false positives around 2.1.
The lesson is broader than one bank. Fraud patterns are often already present in the business. They become easier to detect only when the surrounding structure is queryable.
What Fraud and AML Teams Actually Need
Firstly, here's what they don't need: Another dashboard ❌
Fraud and AML teams do not need another dashboard sitting on top of the same disconnected environment. They need a context layer that lets them move from isolated retrieval to connected relartionship-driven retrieval.
That context can still be accessed through a simple conversational interface. The difference is that the agent can use the graph structure and connected systems underneath to retrieve relevant relationships, rather than answering from an isolated prompt or forcing the analyst to search each system separately.
In fraud operations, an analyst could use this type of interface to ask whether a newly flagged account is connected to known mule activity, then examine the supporting path across accounts, devices, beneficiaries, prior cases and transactions.
A useful knowledge graph layer should make it easier to:
- move across accounts, devices, identities, beneficiaries, claims and counterparties in one investigation flow
- trace where a suspicious connection came from
- compare current alerts against prior case history and connected entities
- surface multi-hop patterns that rules and flat tables tend to miss
- explain why a case looks risky using an auditable reasoning path
This does not replace analyst judgment. It gives that judgment the context it needs.
Wrapping Up
Banks, fintechs and insurers already invest heavily in fraud models, rules, tooling, and review teams. Those investments matter. But they stay weaker than they should when the institution cannot retrieve and connect what it already knows.
That is the shift fraud and AML teams need to make. The core issue is not only fraud volume. It is that the information needed to see risky relationships often already exists, yet stays scattered across disconnected systems.
When that happens, patterns are slower to detect, harder to investigate, and easier to miss. That is one reason fraud losses remain so large even in organizations that are not short on data.