
Tracing Cyber Threats Through Fraud and Anomaly Graph Patterns
Fraud is getting smarter. Your tools should, too.
In 2023, global fraud-related losses, including scams, identity theft, and cybercrime, hit $485.6 billion. In the U.S. alone, internet crime losses jumped to $16 billion in 2024. That’s a 33% spike in just one year.
Fraud isn’t slowing down. It’s evolving.
Traditional systems flag what’s obvious:
- A login from a strange location
- A sudden spike in spending
- A reused IP
But they miss what fraud actually looks like today. Identity theft, account takeover, and synthetic fraud are no longer isolated incidents. In this day and age, these are part of a coordinated behavior spread across multiple accounts, devices, and identities.
That’s where graph technology comes in.
From Single Accounts to Coordinated Fraud
Modern fraud isn’t one person with one account. It’s thousands of accounts, linked by shared emails, devices, addresses, or even social security numbers.
On their own, these indicators look fine.
But graph databases let you connect the dots. And once you do, the pattern is hard to miss:
- Dozens of claims tied to the same phone number
- Anomalous sequences that don’t fit past behavior.
- Multiple user accounts funneling funds to one bank
- One address recycled across hundreds of identities
Take the U.S. unemployment scam during COVID-19. Criminals filed thousands of false unemployment claims using stolen identities, stealing as much as $6 billion in relief funds. Many were tied to the same bank account or reused phone numbers.
If this case had been analyzed using a graph database, a simple query could have helped surface clusters of related claims tied to the same phone number or SSN. For instance, here's an example of a Cypher query used to detect reused SSNs across different claimants.
MATCH (p1:Person)-[:USES]->[ssn:SSN]<-[:USES]-(p2:Person)
WHERE p2 <> p2
RETURN p1.name, p2.name, ssn.value
In just one query, this approach surfaces potential identity theft or duplicate claims hidden in millions of records. That’s the kind of pattern no spreadsheet or static rule engine can catch.
The Analyst’s Edge: Graph Algorithms in Action
Graph analytics works by using structure and algorithms designed to analyze relationships between data points. Here are some key algorithms useful in fraud and anomaly detection use cases:
| Graph Traversal | Traces paths across entities to uncover indirect relationships, such as a fraudster using multiple accounts tied to the same phone number or IP. |
| Community Detection | Groups together related entities (e.g., fake accounts, reused credentials, etc.) to reveal fraud rings operating under the surface. |
| Link Prediction | Predicts likely future connections to uncover hidden relationships or collusion between accounts to participate in fraudulent behavior. |
Visualizing the Threat: Uncovering Fraud Rings
In fraud detection, graph traversal helps expose hidden fraud rings by connecting data points that seem harmless on their own.
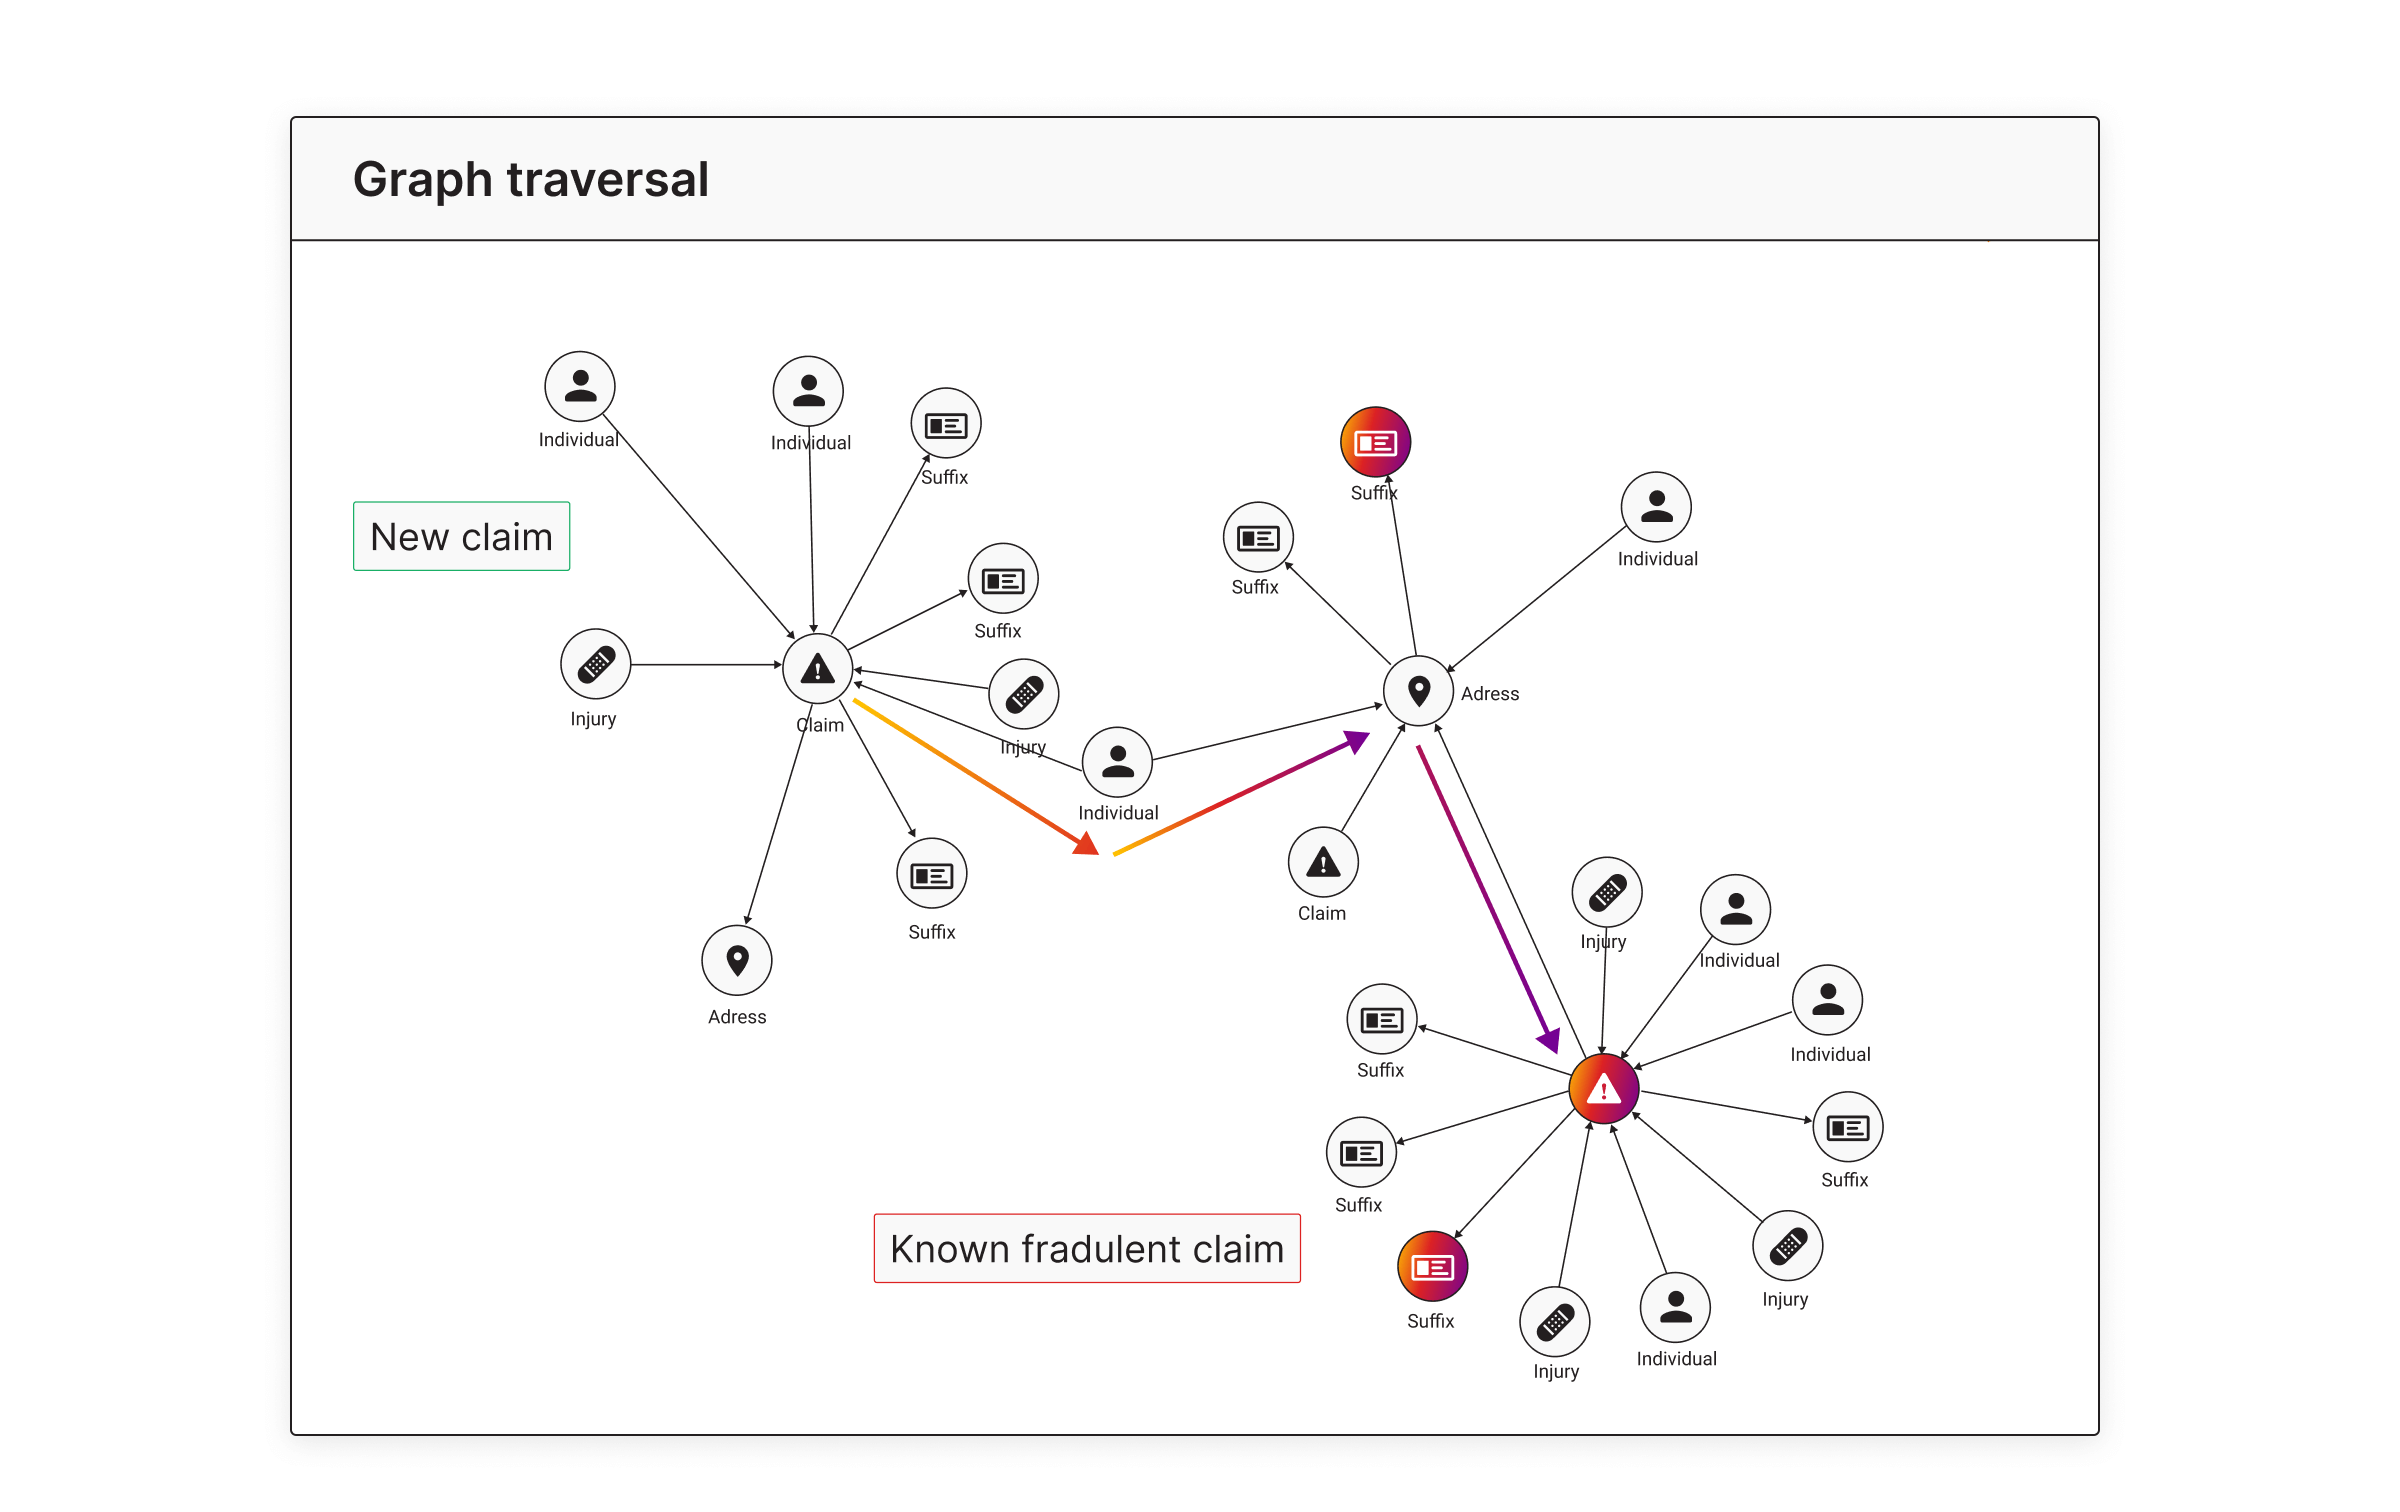
This diagram highlights a New claim that appears legitimate at first glance. However, by traversing relationships, such as shared addresses, individuals, and suffixes, the system reveals links to a Known fraudulent claim.
Traversal algorithms help trace multi-layer connections like:
- Shared individuals involved in multiple claims.
- Duplicate suffix or injury descriptions linked to flagged entities.
- Overlapping addresses across unrelated claims.
They help surface suspicious activity clusters and explain how fraud spreads across a network, ensuring earlier detection, containment, and more targeted investigations.
Detection That Keeps Up
Fraud doesn’t wait. And detection systems shouldn’t either.
Graph technology helps analysts:
- Spot suspicious patterns earlier
- Follow connections across large datasets
- Take action before damage spreads
Because in fraud detection, speed and context are everything.
Want a deeper look at all five cybersecurity use cases enabled by graph technology?
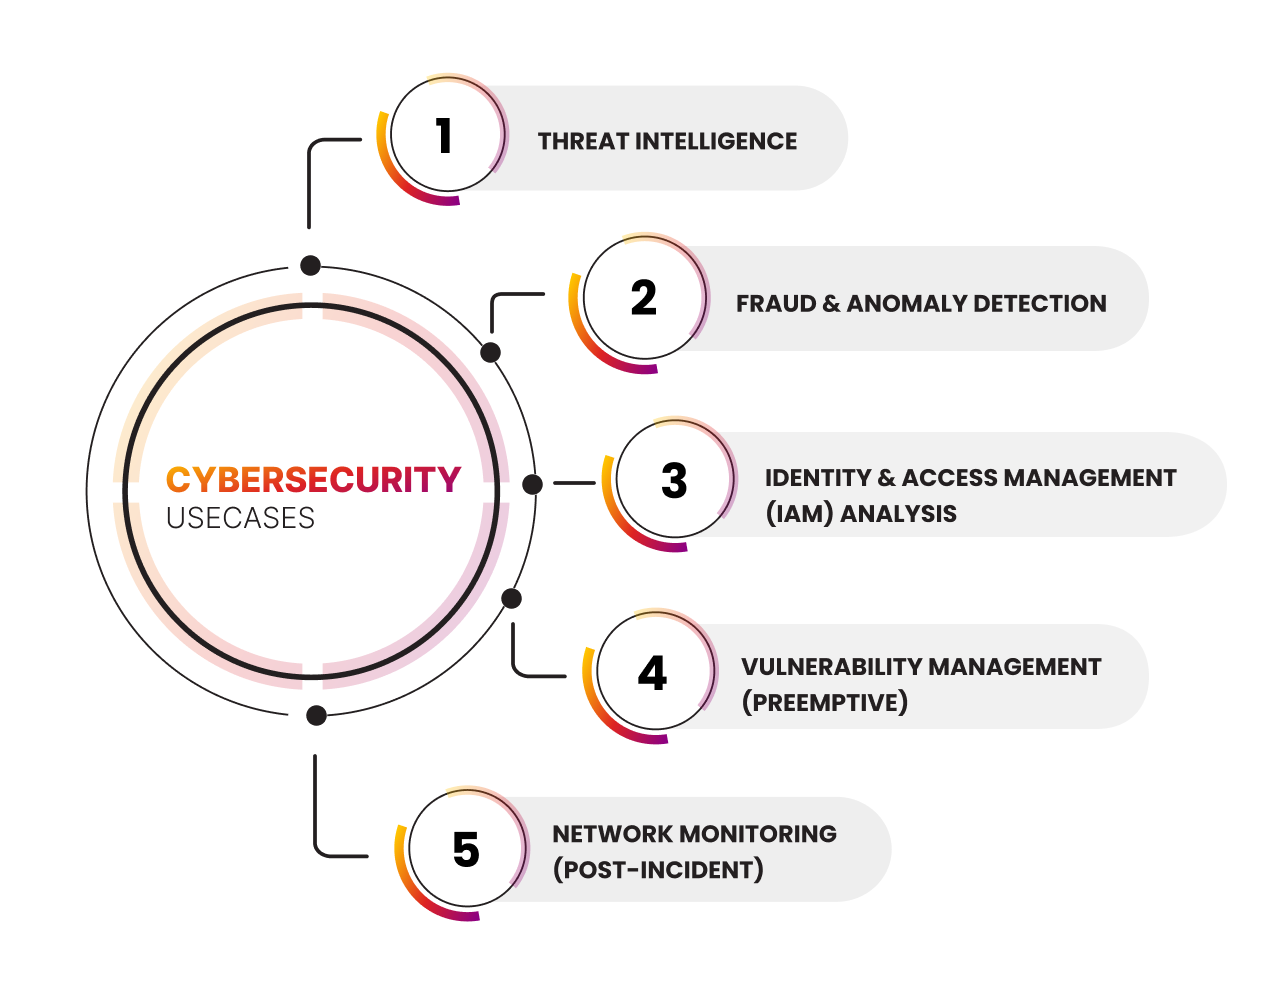
Download the full Cybersecurity Guide to explore practical insights and research-backed techniques.