
How To Build Interactive Dashboards to Optimize Efficiency with Memgraph
In this blog post, we’ll cover a user story of building interactive dashboards to improve organizational efficiency. RJ Visser, owner at Alottabits, made a video on how to create interactive data mining dashboards using license free Python scripts in combination with Memgraph.
Alottabits is a consultancy firm specializing in enterprise resource optimization.
You can watch the full video here:
He created a high-performance data mining dashboard that’s both flexible and scalable enough to support a continuous learning process across an organization. In the video, you’ll see how Alottabits uses Memgraph to overcome these challenges and develop a tool for data analysis and process improvement.
The Problem with Preloaded Dashboards
Interactive dashboards help you zoom in on inefficiencies, identify patterns, and take action. However, traditional approaches to building dashboards often hit a wall when it comes to scale.
Here’s the issue: most dashboards preload large datasets into the front end. This ensures quick access to pre-aggregated data but limits the amount of information you can analyze at once. The preloaded dataset acts essentially as a walled garden and the system bogs down if analysis requires you to go beyond those walls.
Worse, if the underlying data is highly linked—as is the case when analyzing process-related metrics like flow efficiency—this approach is simply too limiting.
Tech Stack Used
- Memgraph - A graph database optimized for high-performance, low-latency querying.
- Streamlit - ****A Python-based framework for building interactive web applications.
- Echarts - A visualization library that integrates with Python while supporting interactivity and custom events.
Why Memgraph?
- Built for speed. Written in C++, Memgraph is optimized for blazing-fast query performance. In an interactive dashboard context, this means real-time updates with minimal lag.
- Handles highly linked data. Metrics like flow efficiency require analyzing interconnected data (epics, features, stories, tasks). Memgraph’s graph-first approach is tailor-made for this.
- Python integration. With its Python interface, Memgraph fit perfectly into a stack that also included Streamlit for front-end development and Echarts for visualizations.
“Memgraph was selected as a result of the performance it offers. It is written in C++ with a focus on high throughput and low latency. Exactly what we needed for the implementation of our interactive data mining dashboard, where we minimize the data sent to the front end and need a very fast call-and-response cycle with the database.”
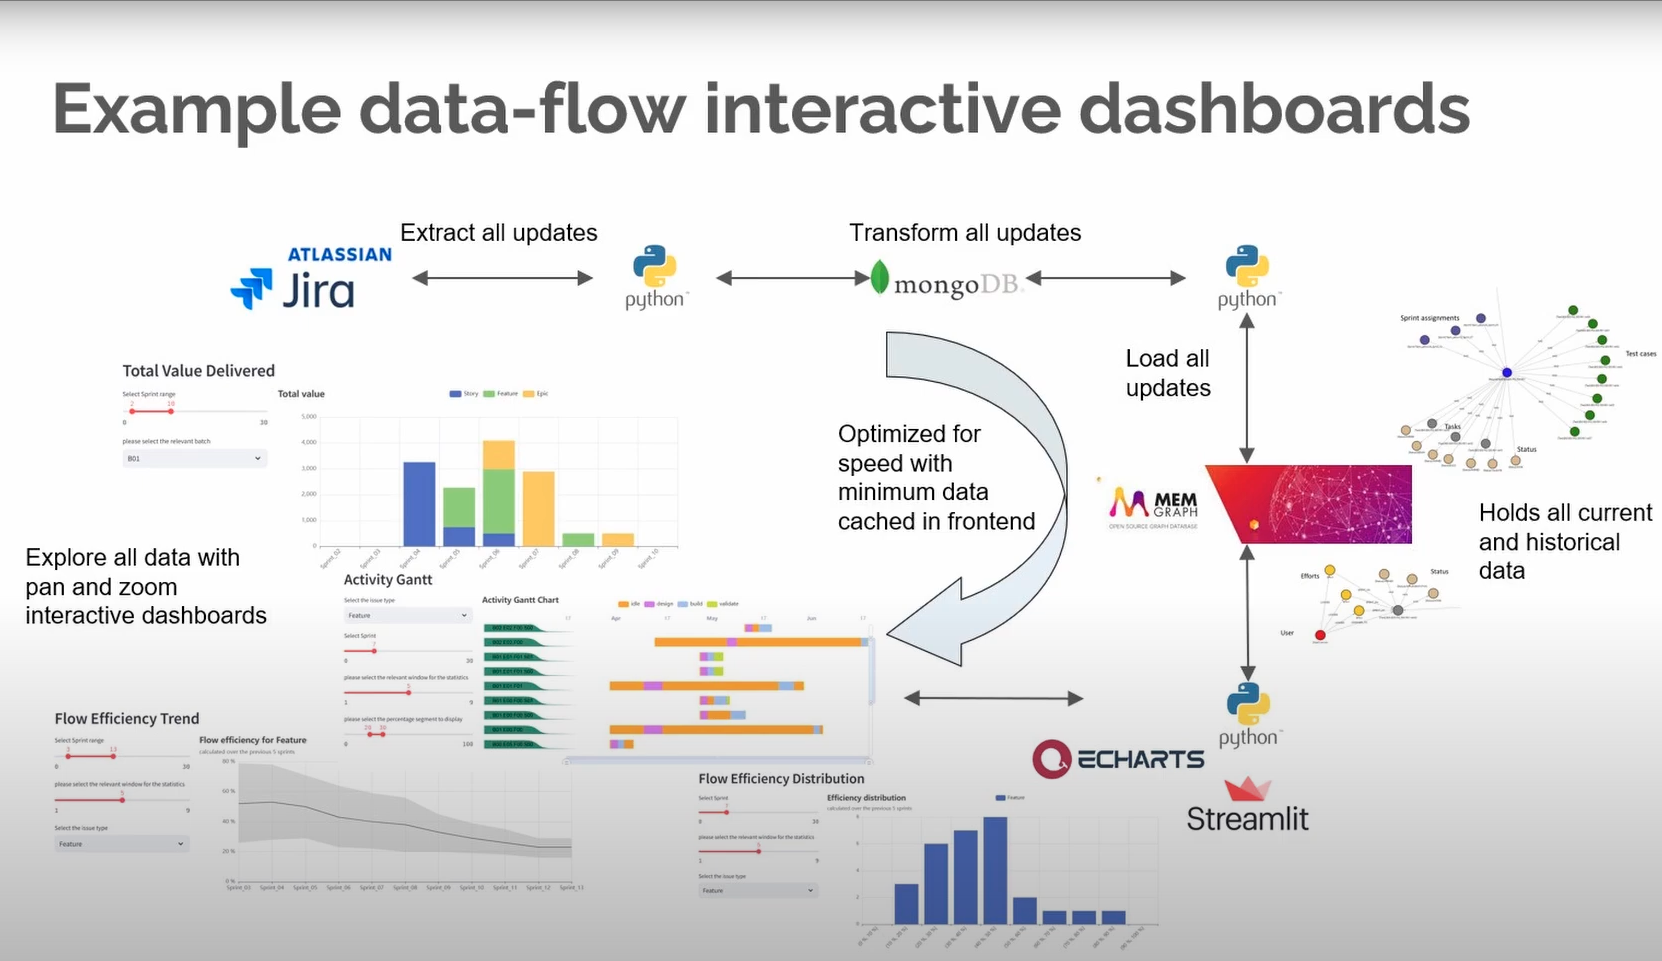
How Memgraph Is Used in This Case?
Data is extracted, transformed, and loaded (ETL) from tools like Jira into Memgraph in real time. The dashboard lets users drill down into details—whether it's viewing the distribution of features in sprints or analyzing idle time for specific teams.
Instead of preloading datasets, Memgraph fetches data dynamically in response to user interactions. This minimizes the load on the front end and keeps performance sharp.
Using Memgraph Lab, RJ visualized how epics, features, and tasks are connected. This helped refine the dashboard and ensure critical relationships weren’t missed.
Memgraph acts as the backbone of the dashboard, efficiently handling the highly linked data structures required to track process-related metrics. By integrating with tools like Jira, Memgraph enables real-time updates to the dashboard. Its ability to dynamically fetch data ensures the system remains responsive, even when users drill down into granular details.
Conclusion
The end goal is a dashboard that goes beyond standard visuals. It allows users to explore data dynamically, identify bottlenecks, analyze trends, and focus on areas for improvement.
For example, RJ illustrated based on data generated with a digital twin of an organization, how the dashboard is used to analyse how teams operate at different levels. This helped uncover inefficiencies, like idle time at the feature level, which was impacting overall flow efficiency.
The Interactive data mining dashboards with Memgraph and Python video highlights how Memgraph can transform real-time analytics, making it a top choice for developers building interactive data solutions. By dynamically fetching data instead of relying on preloaded datasets, Memgraph ensures a smooth experience, even when working with complex, highly linked data.
Further Reading
- Graph Visualization in Python
- Graph Databases in Building Automation: How Smart Buildings Uses Memgraph for Real-Time Insights and Monitoring
- The Benefits of Graph Analytics - How Various Industries Can Utilize Network Analysis
- Memgraph Lab 101: Simplify Graph Data Exploration with Visualization and Querying