The Benefits of Graph Analytics - How Various Industries Can Utilize Network Analysis
Graphs are one of the unifying themes of computer science—an abstract representation that describes the organization of transportation systems, human interactions, and telecommunication networks. That so many different structures can be modeled using a single formalism is a source of great power to the educated programmer.
>>The Algorithm Design Manual, by Steven S. Skiena (Springer)
With the rapid rise of new technologies and methods of collecting data, the need for analytics is steadily rising. Almost every industry has adopted the concept of data analytics to optimize their own workflows, engage customers in real-time, and offer more competitive solutions.
A lot of this data doesn’t fit existing standards defined a long time ago, which people are familiar with. While relational databases and SQL are the standards, they are certainly not the de facto methodology that should be used in every situation. Data is becoming increasingly interconnected and systems increasingly sophisticated, so it’s only natural to find solutions that make use of these connections within the data. This is generally where graph-related technologies can have a significant impact. Some of the most common use cases include:
- Modeling dynamic and changing environments in the financial and IT sector.
- Discovering repeating patterns for the purpose of personalized recommendations.
- Forecasting the spread of epidemics.
- Predicting service delays and outages.
- Analyzing the connections between entities in complex networks.
- Identifying communities in social networks.
This post will cover the basic terms in graph analytics, explain the concept of graph processing, and give a brief overview of the fields that are utilizing graph analytics to their advantage. If you want to find out how Memgraph performs while running graph analytics, check out the benchmark results.
What is graph analytics?
Graph analytics, also called network analysis, is the use of graph-based methods to analyze interconnected data. Some of these methods include
- Pattern-based graph querying
- Using basic graph algorithms
- Visually exploring graphs
- Performing machine learning on graph data
It’s important to notice the distinction and similarities between pattern-based querying and using graph algorithms. While the former can be achieved using standard graph querying languages like Cypher or GSQL, the latter needs a more sophisticated implementation of existing graph algorithms. Graph algorithms are a powerful tool for analyzing interconnected data because they were designed to tackle problems in the realm of graph theory specifically.
Why should you care about graph algorithms?
Graph algorithms can help you discover new information from previously collected data as well as analyzing real-time transactions from data streams. Sometimes, it is tough to focus on the relationships between entities without having the right tools and expertise. Understanding how a complex network behaves can offer valuable insights for many businesses and enrich existing services and products.
A customer visiting an online shop could greatly benefit from a graph-based recommendation engine that uses previously collected data from similar customers and takes their actions into account to create personalized recommendations. A similar approach can be used to recognize customers who are trying to commit financial fraud. Fraud detection systems can identify such behavior in real-time so companies can save on additional legal costs.
A graph-based social network is also nothing new. Relationships between users are sometimes more important for recommendations than the content they consume. To get a truly optimized and insightful recommendation, a page or friend suggestion should be based on the connections with other users and analyze their behavior, not just the interests of a single individual.
Graph algorithms provide a relatively simple and straightforward way of analyzing such complex networks and interactions. The end-user is only responsible for providing the data and deciding on a graph-based approach to analyzing, be it machine learning, pattern-based querying, the application of graph algorithms, or, best yet, a combination of all three.
What is Memgraph?
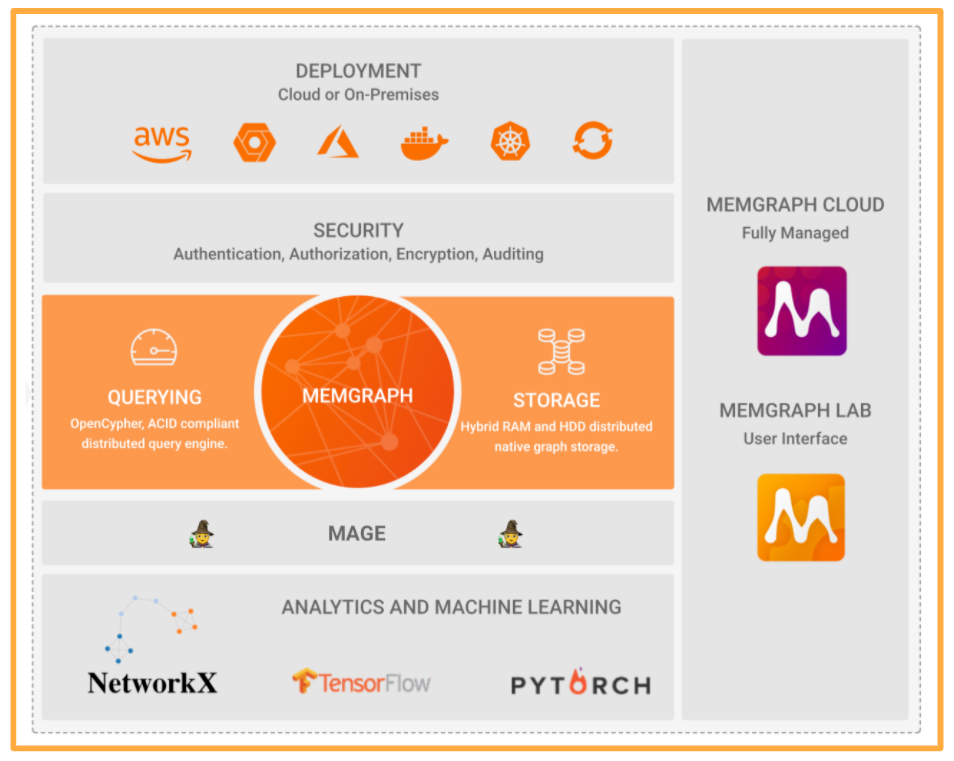
Memgraph is a complete graph analytics platform. From the process of ingesting data, storing it, querying, and analyzing, all the functionalities have been provided and integrated. As you can see in the visual below, Memgraph includes a whole ecosystem of tools specifically designed to perform graph analytics tasks on historical data or data streams.
Graph analytics use cases
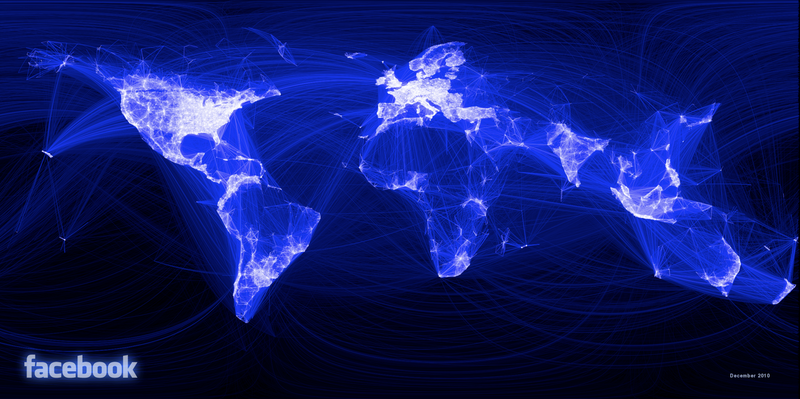
Social network analysis
Some of the main tasks in social network analysis include the detection and identification of influencers and decision-makers. Ensuring the continued engagement of these influencers can lead to a better overall engagement of the whole network or specific communities that have been formed around such individuals.
This kind of information can greatly benefit the sales and marketing processes which heavily rely on community-related information and the general growth of the social network.
Social network analysis can also help to get insights that would otherwise be counterintuitive. Graph algorithms aren’t under the influence of human bias and can therefore derive much clearer conclusions from the data. Common usages in social network analysis include:
- Identifying communities.
- Identifying users with the most influence.
- Finding connections between specific entities.
- Identifying malicious bots.
Financial sector
Financial organizations very often have critical vulnerabilities due to their size, complex structure, and the number of services they offer. As a result, they are often a target for fraudsters and cybercriminals. According to a Juniper Research study, merchants and financial services organizations will spend $9.3 billion annually on fraud detection and prevention by 2022. Advanced graph analytics provides deeper insights, complementing Business Intelligence, and helps organizations preempt and prevent potential fraud while protecting customers.
Fraud detection involves identifying fraudulent transactions and bad actors in financial networks. It can be used to search for already committed crimes or analyze incoming transactions and make real-time decisions about their legitimacy.
Like with many other networks, financial networks tend to get very large and are impossible to maintain manually. With a rising number of customers as well as a rising number of transactions per customer, it becomes significantly harder to handle real-time interactions in a timely manner. Memgraph, as a completely in-memory platform, offers significant advantages for such highly complex and time-critical transactions.
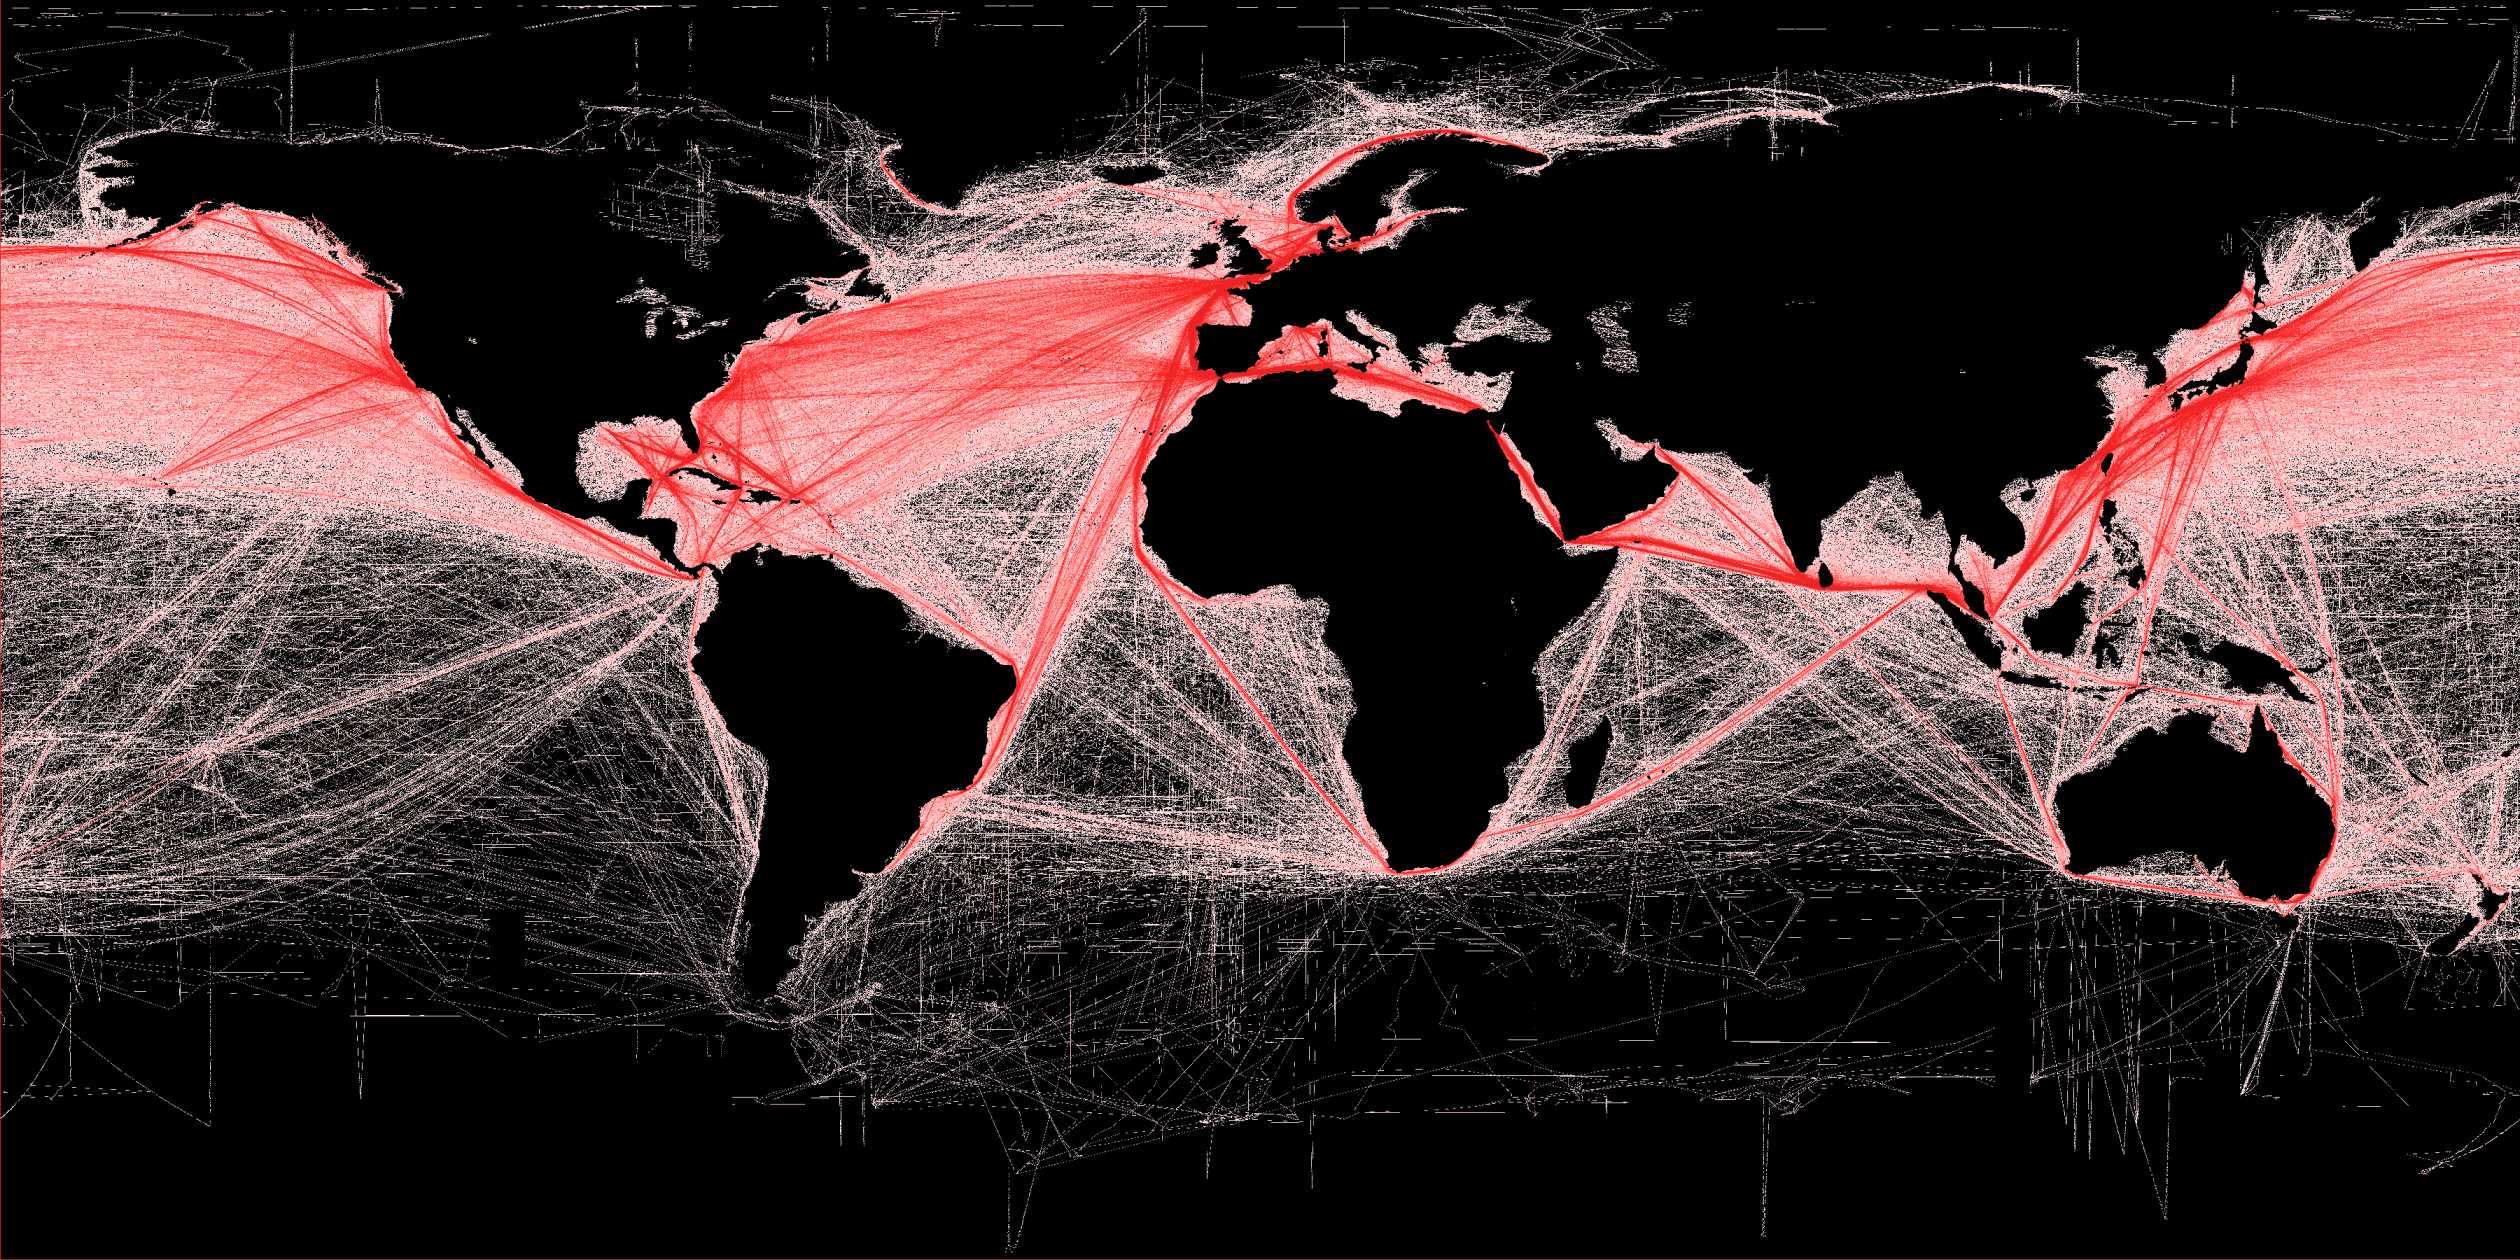
Transportation networks
A transportation network usually implies the transport of people and goods from one location to another by traversing a transportation network. Such networks include street networks, railroad networks, river networks, utility networks, and pipeline networks. These types of networks are comprised of linear features, which can be viewed as edges and points of intersection between them, which are essentially nodes. In such terms, a transportation network quickly turns into a graph that can be traversed and analyzed using standard graph-based methods.
Many transportation problems can be addressed through a network. A few examples include:
- Identifying the fastest and/or shortest path between two points in the network.
- Determining the most efficient way for a delivery vehicle to visit a series of stops (also known as the traveling salesman problem).
- Defining the service area around a given location.
- Identifying an optimal store location to supply the largest number of potential customers effectively.
Supply chain management
Globalization has, without a doubt, changed the production network. With the world at our fingertips, we are able to deliver top-notch products more rapidly and affordably than ever before. Globalization has also made supply chains more complex, in turn making supply chain management a more challenging task.
In an ideal world, every supply chain would be straightforward: one provider supplies another in an easy-to-understand progression to the final finished good. However, with globalization, brands can source from different providers from everywhere in the world, making the inventory network somewhat incomprehensible and overconnected. We need new innovations to deal with this intricacy, and graph databases are well suited to handle such problems. Instead of relational databases, a typical information model that stores rigidly organized information into tables, graph databases collect nodes and their relationships into connected structures that are perfect for analyzing.
Chemical industry
Increasing global competition and tightening product requirements are pushing chemical companies to recognize the ever-present need for operational efficiency. As a result, they are consistently looking for strategies to improve the way they manage their production systems and reallocate resources in real-time, in the most efficient and value-creating way across their manufacturing and supply chains.
Fortunately, many chemical companies have invested heavily in IT systems and infrastructure, generating huge amounts of data that can be leveraged to extract actionable intelligence to improve productivity and increase profitability. Real-Time Advanced Network Science Analytics are helping chemical companies combine all available data sources, expert domain knowledge, and state-of-the-art algorithms to increase production process efficiency and profitability across the enterprise.
Consider the impact of enabling real-time optimization process networks across an entire production site. At any given time, business units can compute what to buy, what to make, and how to make it in order to maximize profit. Such capability can drive millions in profit increase. For example, a McKinsey study has reported that a large diversified producer chemical company increased profits by €10 Million a year by successfully bringing together data across production capabilities, purchasing, and distribution.
Such a unified approach to analytics is without a doubt the earliest accessible and largest opportunity for chemical companies which explains why some of the world’s largest chemical players are embracing advanced network science analytics to accelerate the optimization of their key processes.
Conclusion
Graph analytics methods have cemented their place in the field of data science, but more importantly, they are now present in almost every industry as well. While data becomes more complex and interconnected, the application of graph algorithms and graph query languages is essential for timely and effective data processing and analysis.
If you recognize the problem graph analytics would solve, but you need more information about graph databases, find out how they compare to relational databases, and how to build your business model as a graph.
Memgraph offers an all-in-one solution for graph analytics problems on historical data as well as real-time data streams. By utilizing existing scientific libraries like NetworkX or PyTorch and implementing custom optimized algorithms with MAGE, developers have every needed tool at their disposal.
To get a better understanding of graph analytics and its benefits, download Memgraph and try out one of our graph analytics tutorials. You can also find out how Memgraph compares to Neo4j to find a perfect tool to handle your data.