Visualizing graphs with Graphistry and Memgraph
This blog post will show how to utilize Graphistry for visualizing graph data from Memgraph using a sample data set related to a company's Identity and Access Management (IAM) which outlines who can access what, why, and when. Each organization's unique identity and structure shape how access is managed, forming the company's IAM. If the current IAM system becomes slow and unresponsive, unable to handle changes in team roles and permissions, graph databases are a leading solution.
What is Graphistry?
Graphistry is a visual graph AI platform featuring point-and-click visual analytics and end-to-end GPU acceleration for exploring and analyzing many relationships. The OSS PyGraphistry library enables quickly visualizing large data from Memgraph, and provides an easy dataframe-centric library for intermediate graph processing steps like data shaping, graph algorithms, graph layouts, autoML, autoAI, and data-driven visualization configuration. If you have a GPU where your PyGraphistry client is running, it supports automatic GPU acceleration for the locally executed steps. PyGraphistry is often used directly within data science notebooks and as a Python toolkit for building custom dashboards and webapps.
The primary goal of Pygraphistry is to help users create meaningful visualizations of graph data, allowing them to explore complex relationships and gain important insights from the data through visually appealing graph data visualizations.
Configuration and installation
Memgraph is an open-source graph database and it's compatible with Neo4j's Bolt protocol. It supports the widely used Cypher query language for interacting with the database. Cypher provides a powerful and expressive way to work with graph structures and perform various operations on the nodes and relationships within a graph database. A convenient entry point to kickstart your journey with Memgraph is through Docker. After installation, launch Docker Desktop by clicking on its icon. With running Docker Desktop and by entering the following command in your terminal, you can set up the Memgraph Platform within a Docker container:
docker run -it -p 7687:7687 -p 7444:7444 -p 3000:3000 -e MEMGRAPH="--bolt-server-name-for-init=Neo4j/" memgraph/memgraph-platform
Memgraph Platform is a Docker image that contains several components to help you work with the Memgraph database. These components include Memgraph (the main database that holds your data), Memgraph Lab (a visual user interface for running queries and visualizing graph data), mgconsole (command-line interface for running queries), MAGE (library of graph algorithms and modules). Memgraph Platform is used because it is flexible, lightweight, and portable. You can build it locally or deploy it to the cloud and it runs on all platforms - Windows, Linux, and macOS. If everything went well, after a couple of seconds you should see a message that Memgraph Lab is running at localhost:3000. You can access it through your web browser. In case you get a list of information and warnings, it’s normal so don’t worry. For additional information on starting with Memgraph, check out the Memgraph documentation. To begin using Graphistry, make sure to install the Graphistry Python client and the Neo4j Bolt drivers. You can achieve this by running the provided code snippet in Python.
!pip install --user graphistry
!pip install --user graphistry[bolt]
Next, import the necessary dependencies, including Pandas, Graphistry, and GraphDatabase. These libraries will be utilized to load and work with the data.
import pandas as pd
import graphistry
from neo4j import GraphDatabase
Lastly, establish a connection with your Graphistry GPU server account. Make sure to substitute the connection string and password with your personal credentials. You can create an account and find additional configuration options on GitHub.
graphistry.register(api=3, username='...', password='...')
Connecting Memgraph and Graphistry
Connecting to a Memgraph database is done using the Bolt protocol. The URI includes the hostname and the port number. The authentication part includes a tuple with the username and the password that you use to authenticate and gain access to the Memgraph database.
MEMGRAPH = {
   'uri': "bolt://localhost:7687",
   'auth': (" ", " ")
}
After that, Graphistry library can be used to register a connection to a database via Bolt protocol, using the provided configuration.
graphistry.register(bolt=MEMGRAPH)
Uploading, visualizing and exploring the data set
Now, a Memgraph driver instance can be initialized. Then, use the session.run() method to execute Cypher queries.
driver = GraphDatabase.driver(**MEMGRAPH)


with driver.session() as session:
   session.run(""" CREATE (per1:Person {id: 1, name: "Julie"})
CREATE (per2:Person {id: 2, name: "Peter"})
CREATE (per3:Person {id: 3, name: "Anna"})
CREATE (per4:Person {id: 4, name: "Carl"})
CREATE (tea1:Team {id: 1, name: "Engineering"})
CREATE (tea2:Team {id: 2, name: "Operations"})
CREATE (tea3:Team {id: 3, name: "Marketing"})
CREATE (rep1:Repository {id: 1, name: "Memgraph"})
CREATE (rep2:Repository {id: 2, name: "MAGE"})
CREATE (rep3:Repository {id: 3, name: "Marketing"})
CREATE (com1:Company {id: 1, name: "Memgraph"})
CREATE (sto1:Storage {id: 1, name: "Google Drive"})
CREATE (sto2:Storage {id: 2, name: "Notion"})
CREATE (fol1:Folder {id: 1, name: "engineering_folder"})
CREATE (fol2:Folder {id: 2, name: "operations_folder"})
CREATE (acc1:Account {id: 1, name: "Facebook"})
CREATE (acc2:Account {id: 2, name: "LinkedIn"})
CREATE (acc3:Account {id: 3, name: "HackerNews"})
CREATE (fil1:File {id: 1, name: "welcome_to_engineering.txt"})
CREATE (fil2:File {id: 2, name: "welcome_to_memgraph.txt"})
CREATE (fil3:File {id: 3, name: "operations101.txt"})
CREATE (fil4:File {id: 4, name: "expenses2022.csv"})
CREATE (fil5:File {id: 5, name: "salaries2022.csv"})
CREATE (fil6:File {id: 6, name: "engineering101.txt"})
CREATE (fil7:File {id: 7, name: "working_with_github.txt"})
CREATE (fil8:File {id: 8, name: "working_with_notion.txt"})
CREATE (fil9:File {id: 9, name: "welcome_to_marketing.txt"})
CREATE (per1)-[:HAS_ACCESS_TO]->(fil2)
CREATE (per2)-[:HAS_ACCESS_TO]->(fil2)
CREATE (per2)-[:IS_PART_OF]->(tea1)
CREATE (per2)-[:IS_PART_OF]->(com1)
CREATE (per2)-[:IS_PART_OF]->(tea2)
CREATE (per3)-[:IS_PART_OF]->(tea2)
CREATE (per3)-[:IS_PART_OF]->(tea3)
CREATE (per3)-[:IS_PART_OF]->(com1)
CREATE (per4)-[:IS_PART_OF]->(tea1)
CREATE (per4)-[:IS_PART_OF]->(com1)
CREATE (per4)-[:HAS_ACCESS_TO]->(fil2)
CREATE (com1)-[:HAS_TEAM]->(tea1)
CREATE (com1)-[:HAS_TEAM]->(tea3)
CREATE (com1)-[:HAS_TEAM]->(tea2)
CREATE (fil1)-[:IS_STORED_IN]->(sto1)
CREATE (fil1)-[:IS_STORED_IN]->(sto2)
CREATE (fol2)-[:IS_STORED_IN]->(sto1)
CREATE (fil9)-[:IS_STORED_IN]->(sto1)
CREATE (fil9)-[:IS_STORED_IN]->(sto2)
CREATE (fol1)-[:IS_STORED_IN]->(sto1)
CREATE (fil2)-[:CREATED_BY]->(per3)
CREATE (fol1)-[:HAS_ACCESS_TO]->(fil6)
CREATE (fol1)-[:HAS_ACCESS_TO]->(fil7)
CREATE (fol1)-[:HAS_ACCESS_TO]->(fil8)
CREATE (fol2)-[:HAS_ACCESS_TO]->(fil3)
CREATE (fol2)-[:HAS_ACCESS_TO]->(fil4)
CREATE (fol2)-[:HAS_ACCESS_TO]->(fil5)
CREATE (tea2)-[:HAS_ACCESS_TO]->(fol2)
CREATE (rep3)-[:HAS_ACCESS_TO]->(acc1)
CREATE (rep3)-[:HAS_ACCESS_TO]->(acc2)
CREATE (rep3)-[:HAS_ACCESS_TO]->(acc3)
CREATE (rep3)-[:HAS_ACCESS_TO]->(fil9)
CREATE (tea1)-[:HAS_ACCESS_TO]->(rep1)
CREATE (tea1)-[:HAS_ACCESS_TO]->(rep2)
CREATE (tea1)-[:HAS_ACCESS_TO]->(rep3)
CREATE (tea1)-[:HAS_ACCESS_TO]->(fil1)
CREATE (tea1)-[:HAS_ACCESS_TO]->(fol1)
               """)

g = graphistry.cypher(""" MATCH (node1)-[connection]-(node2) RETURN node1, connection, node2;
 """)
After populating the Memgraph instance, it's time to visualize the data with Graphistry. But first, let's see the graph schema in Memgraph Lab, available at localhost:3000. Graph schema defines the structure of your data and its relationships, providing a blueprint for how your data elements are connected and organized within the graph database and offers interactive graph visualizations.
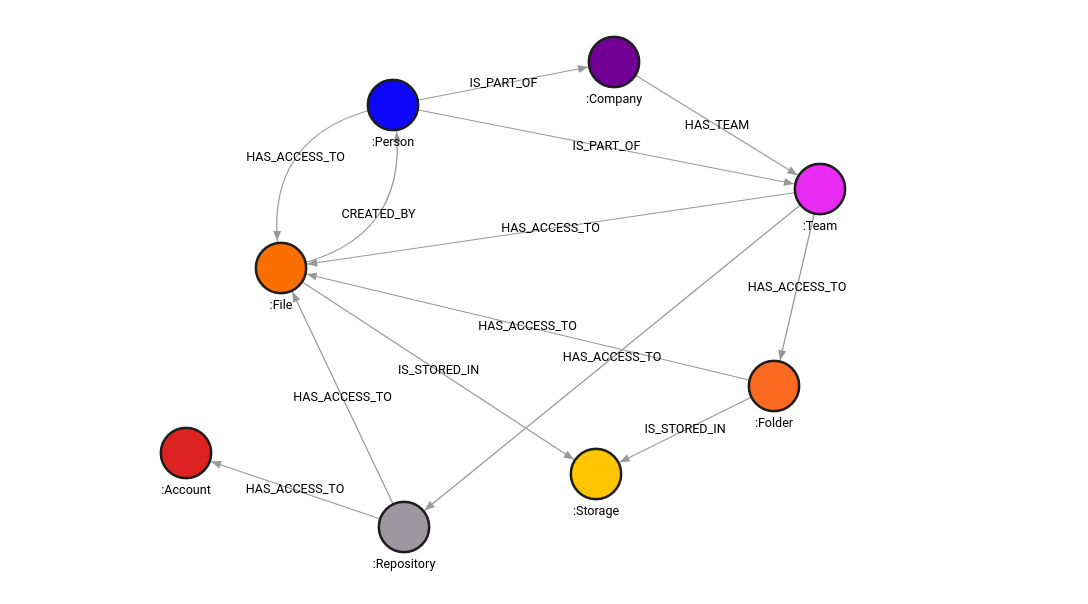
That is how Memgraph Lab generates the graph schema. Now, let’s dive into Graphistry visualization of the IAM dataset, simply by running the following one liner.
g.plot()
Using the following query, let's find out which files can Carl access.
direct_file_access_Carl = graphistry.cypher("""  MATCH (j:Person {name:"Carl"})-[r:HAS_ACCESS_TO]->(n)
RETURN *;  """)
direct_file_access_Carl.plot()
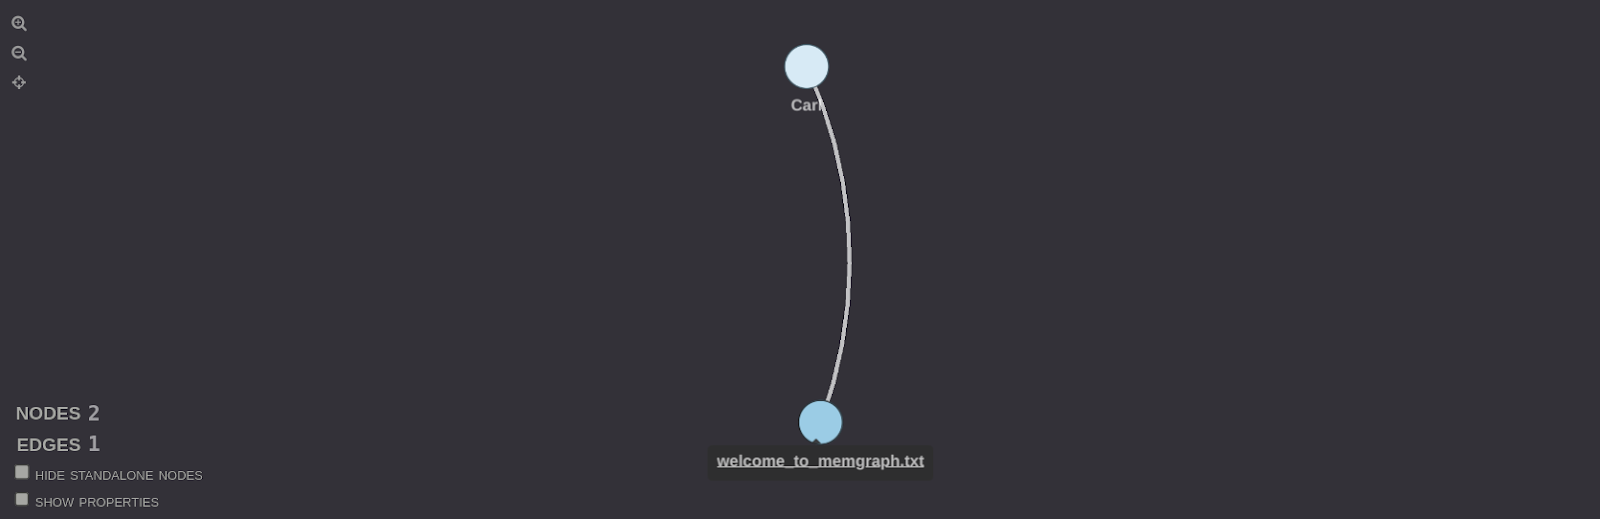
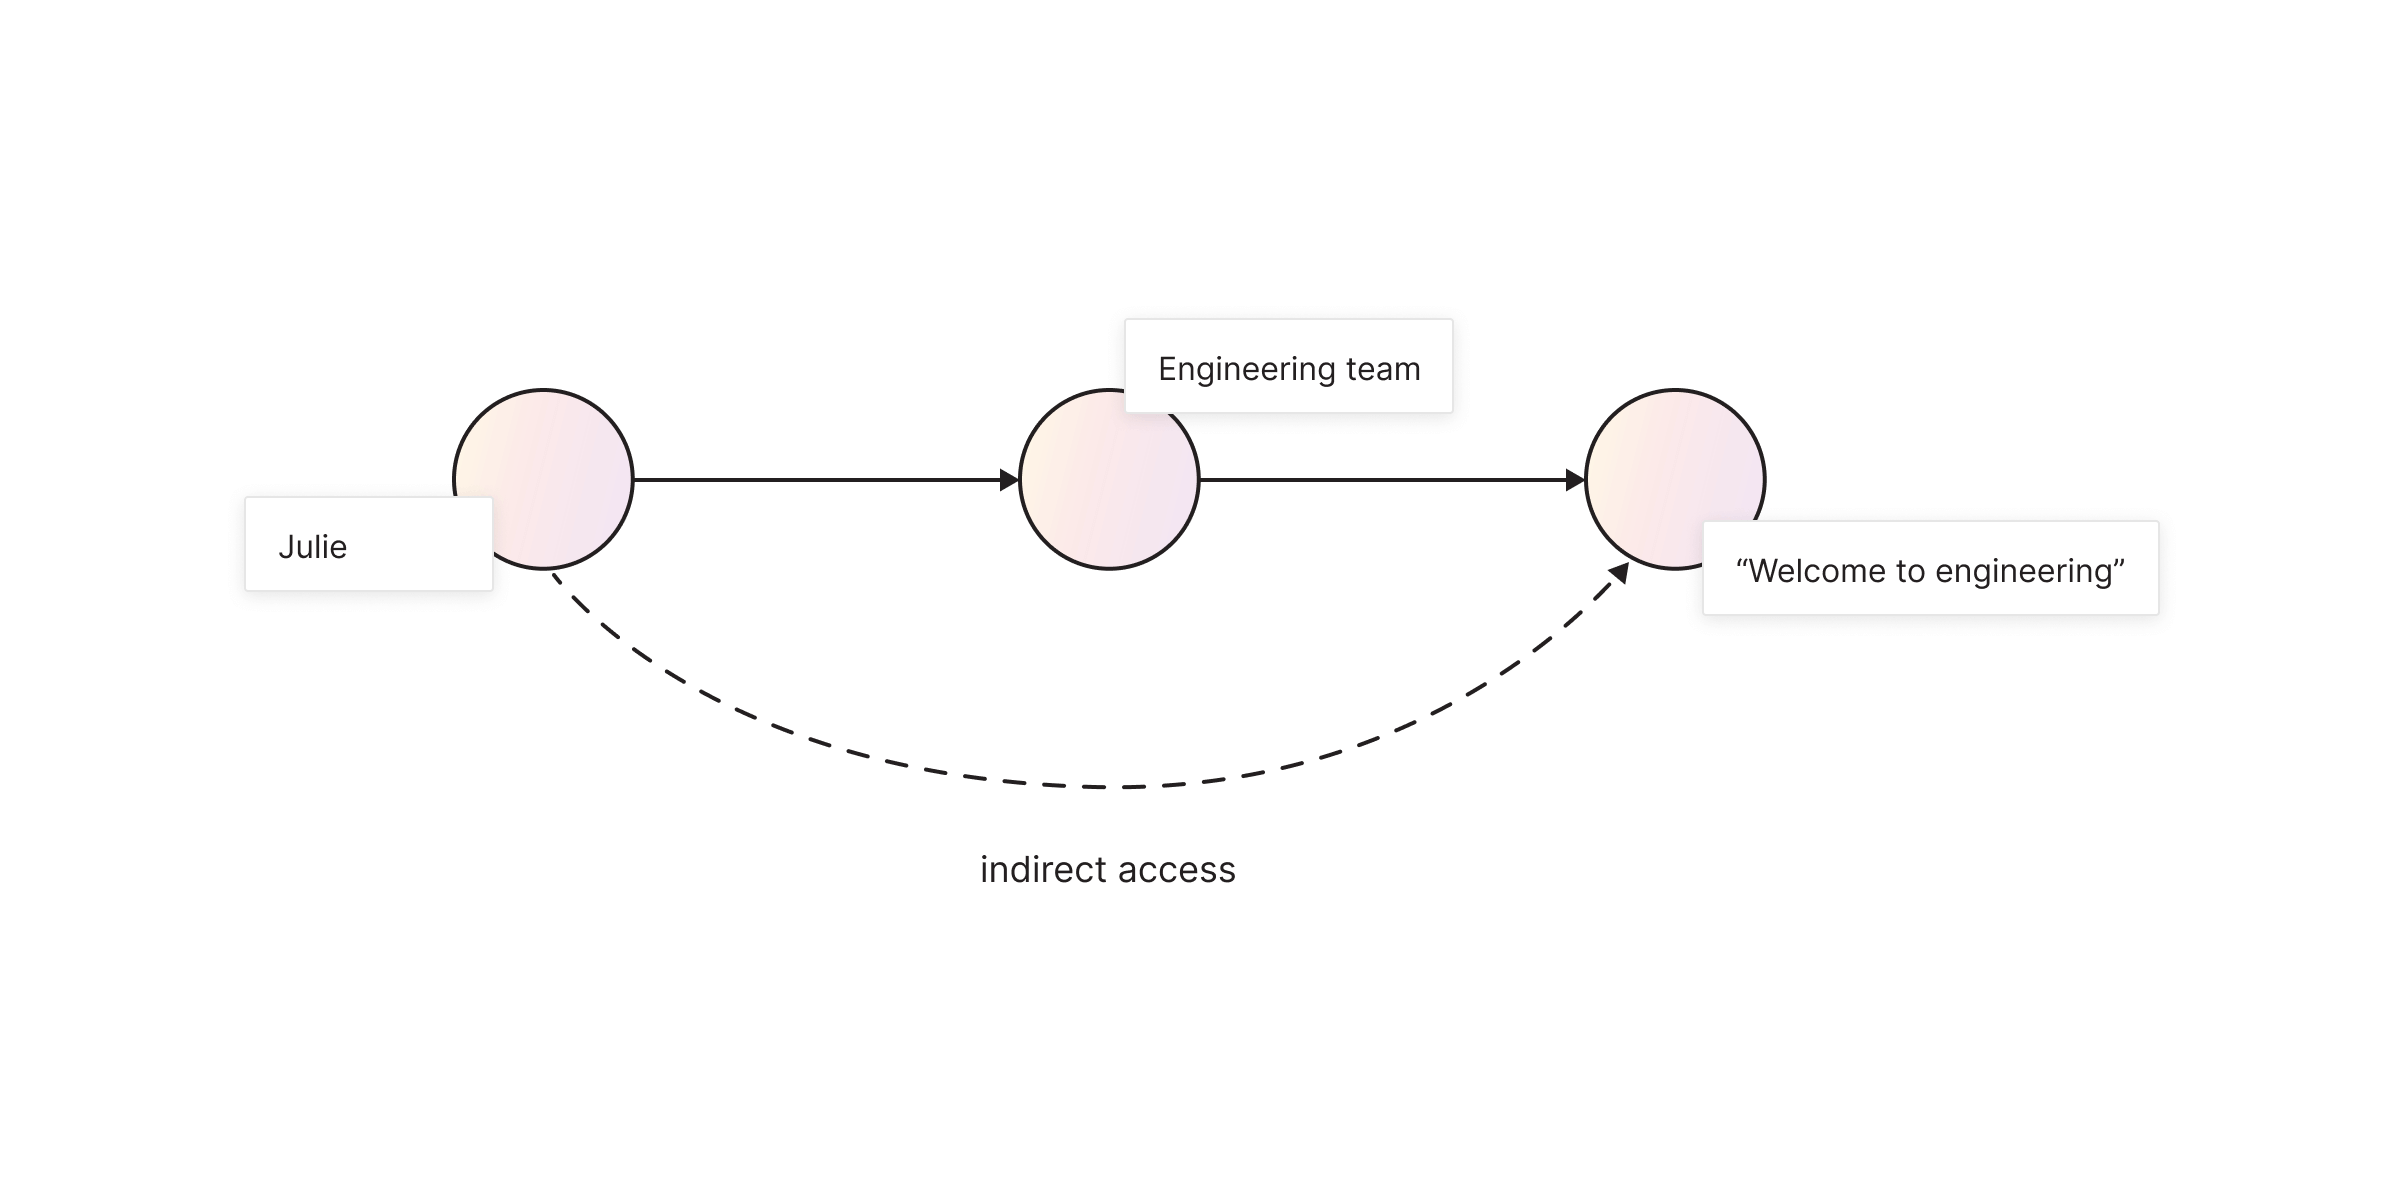
The result shows that Carl has direct access to a file named “welcome_to_memgraph.txt”. But, since Team nodes have access to specific folders, if Carl is a part of a team, he indirectly has access to all files in that folder. The next query shows how a depth-first search is performed from a node with the label Person with the name Carl to nodes with the label File. It finds a path from Carl to files directly or through other nodes. The symbol * represents depth-first search and the number 3 is the maximum depth (maximum number of jumps).
all_file_access_Carl = graphistry.cypher("""
MATCH p=(:Person {name:"Carl"})-[* ..3]->(:File)
RETURN p;
""")
all_file_access_Carl.plot()
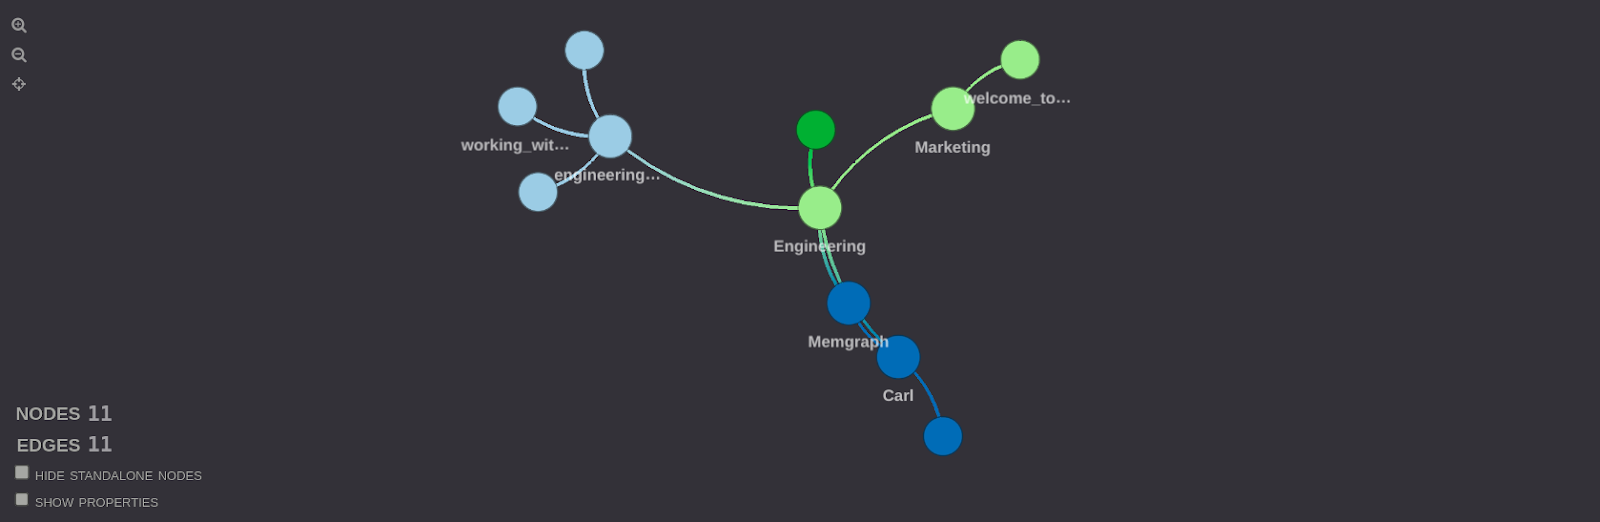
The result of this query shows all the paths from Carl to files in the graph that have at most three jumps. Each path will represent a series of relationships that connect Carl to a file, either directly or indirectly through other nodes. These paths demonstrate how Carl can access files in the graph, including any intermediate nodes (e.g., teams or folders) through which the access is granted. Visualization displays these paths and connections, making it easier to understand the access hierarchy and relationships between Carl and the files in the graph.
This can also be done for all Person nodes by executing the following query.
all_file_access = graphistry.cypher("""
MATCH p=(:Person)-[* ..3]->(:File)
RETURN p;
""")
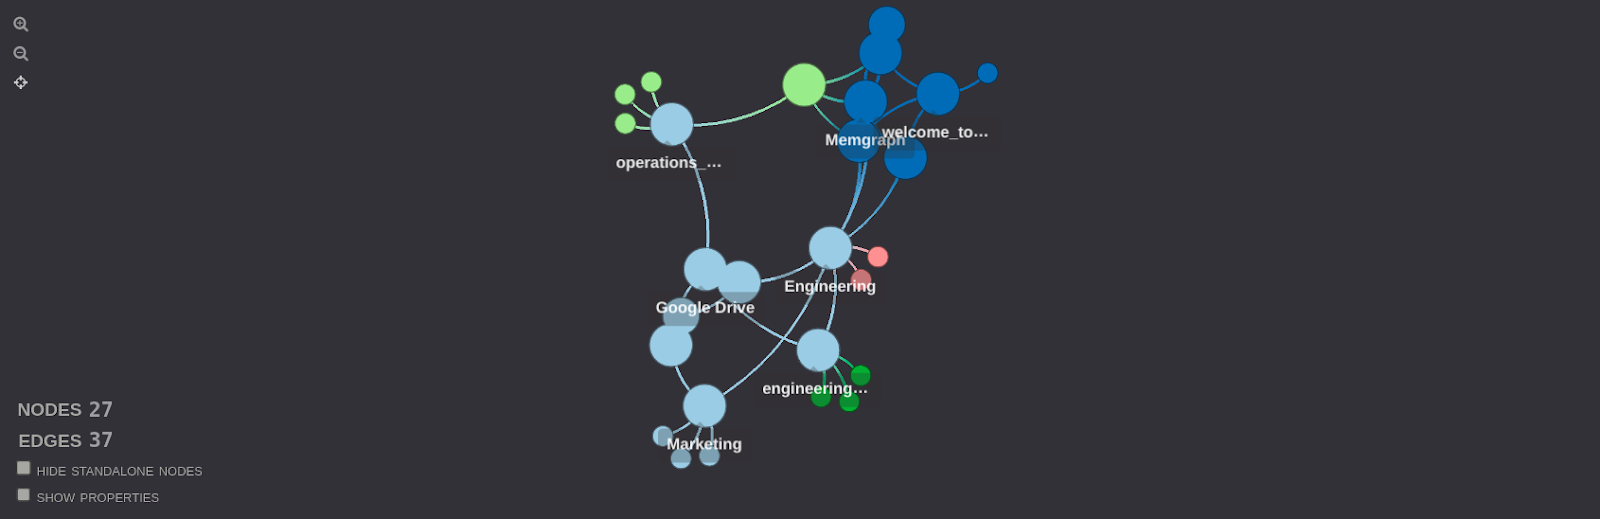
all_file_access.plot()
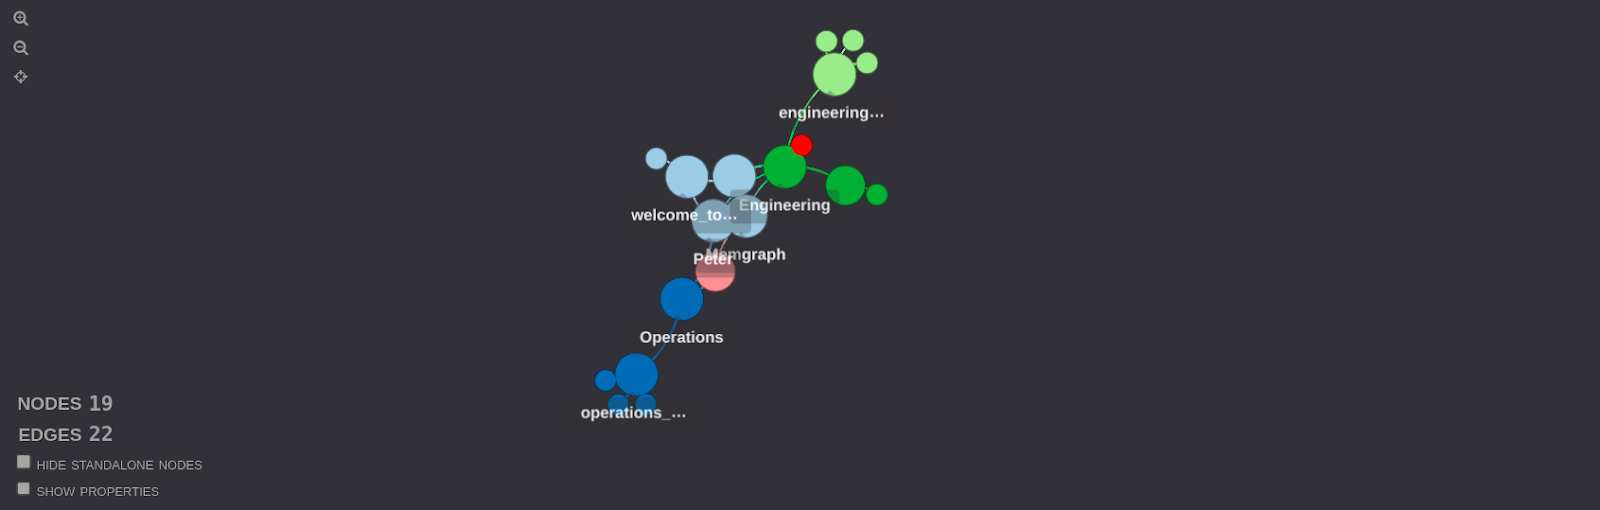
The result of this query shows all the paths from every person in the dataset to files. Similarly like before, each path demonstrates how each person can access files in the graph, either directly or indirectly through other nodes. The visualization displays these paths and connections for all persons in the graph, providing an overview of how file access is structured and who can access which files through various relationships in the graph.
The YouTube video covers how Graphistry can be used for visualization. This is an example why graph databases are great for Identity and Access Management. Graph databases are making analysis of IAM data easier, the system performs faster and offers flexibility and scalability.
You can find out more about building and scaling modern IAM systems with Memgraph and What Makes Memgraph Great for Real-Time Performance in IAM Systems, Benefits Graph Databases Bring to Identity and Access Management and How Graphs Solve Two Biggest Problems of Traditional IAM Systems.
Another very cool and useful thing is Memgraph playground where you can find guided lessons on the IAM dataset.
Takeaway
Pygraphistry complements Memgraph by providing a specialized tool for creating visualizations of graph data stored in Memgraph.
Feel free to get your hands on Graphistry and Memgraph, model your own data, build graph data structures and experience building visualizations on large data sets. I’m sure you’ll discover patterns and gain value through graph visualization and analysis. Keep exploring graphs and share your insights or questions with us on Discord !