
How NASA is Using Graph Technology and LLMs to Build a People Knowledge Graph
Ever wondered how NASA identifies its top experts, forms high-performing teams, and plans for the skills of tomorrow? The answer lies in their People Graph!
It is an initiative that’s transforming people analytics in NASA with the power of graph databases and large language models (LLMs).
Missed the community call? Watch the full NASA x Memgraph community call on demand to dive deeper into their architecture, live demo, and expert Q&A.
Introduction
This community call was led by members of NASA’s People Analytics team who are behind the development of the People Knowledge Graph:
- David Meza, Branch Chief of People Analytics and Head of Analytics for Human Capital at NASA
- Madison Ostermann, Data Scientist and Data Engineer
- Katherine Knott, Data Scientist
They shared how they combined graph databases, large language models (LLMs), and secure AWS infrastructure to connect people, projects, and skills across the agency.
The result is a graph-powered system that enables subject matter experts discovery, project similarity analysis, and generation of real-time organizational insights, all accessible via Cypher queries and a chatbot interface powered by GraphRAG.
Here’s a breakdown of the key technical takeaways and live demo shared during the session:
Talking Point 1: Why NASA Needed a People Knowledge Graph
People data in traditional relational databases is messy. Rows, columns, joins.
It’s just not built for the complex relationships that exist in a massive organizations like NASA.
Graph databases flip that. Instead of flattening data into spreadsheets, they connect people to skills, projects, and even their career paths, allowing you to answer questions like:
- “Who has worked on highly similar AI projects across NASA centers?”
- “Which employees have cross-disciplinary expertise in AI/ML?”
- “Where are the skill gaps we need to fill?”
NASA uses Memgraph to handle all of this in real time, allowing their team to query and traverse multi-hop relationships seamlessly.
Talking Point 2: Infrastructure and Deployment
The entire solution runs on NASA's secure internal AWS cloud.
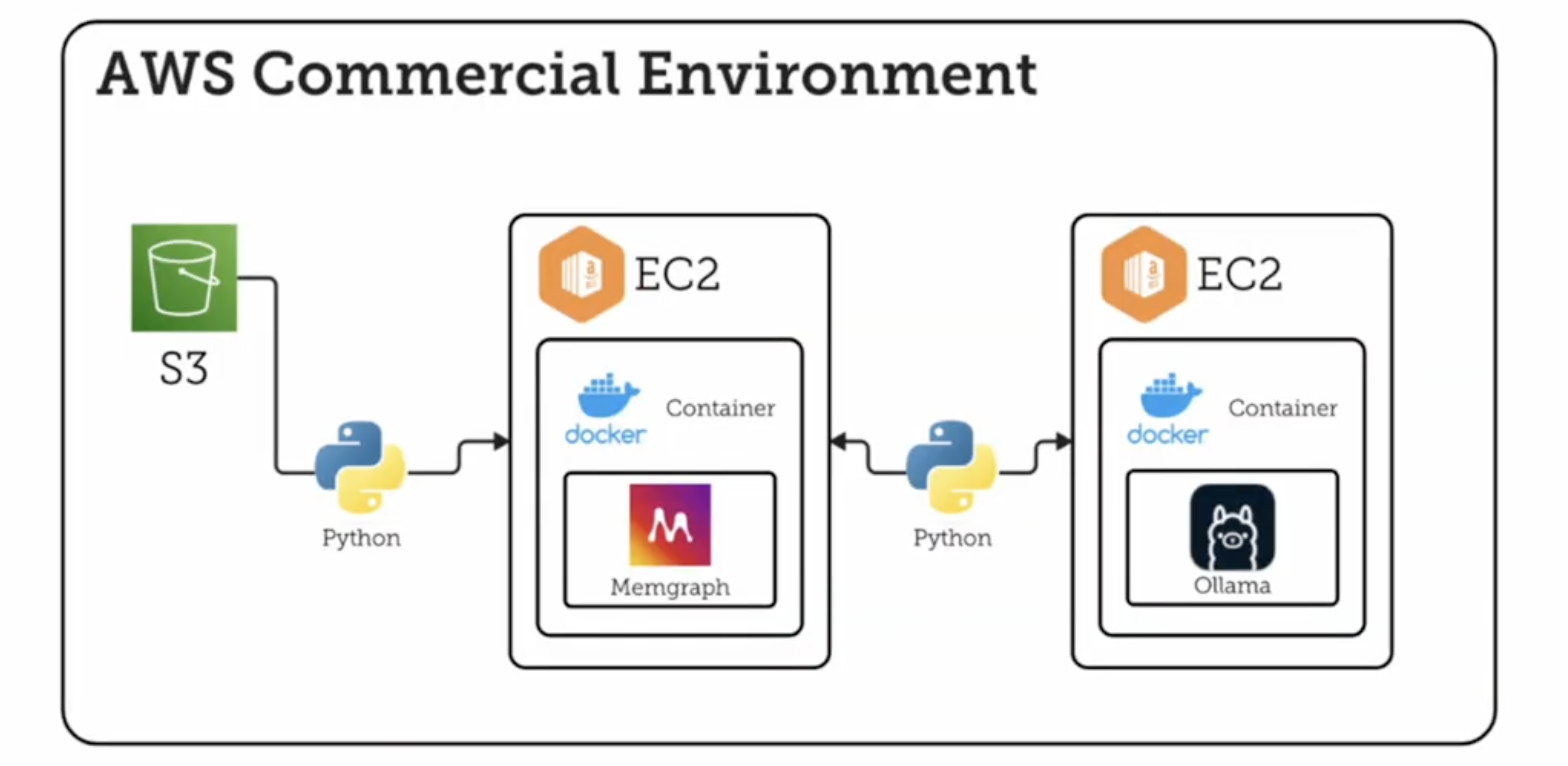
Key components include:
- Memgraph running in Docker on EC2 instances.
- On-prem LLM server (Ollama) deployed in EC2 for skill extraction and chatbot querying.
- AWS S3 buckets for storing structured and unstructured data. If you require such procedure to migrate from S3, check this out!
- GQLAlchemy for ingesting data from S3 to Memgraph using Cypher.
Memgraph's enterprise license allowed NASA to segment data across multiple databases, keeping personally identifiable information (PII) secure and isolated.
Talking Point 3: Data Ingestion and Skill Extraction
The team brought in data from multiple sources into Memgraph using from gqlalchemy import Memgraph:
- People Data from NASA’s internal Personnel Data Warehouse
- AI/ML Project Data from the AI Use Case Registry
- Extracted Skills from Team Resumes
For AI/ML Project Data, Cosine Similarity between project descriptions was computed to create a relationship between projects with similarity as a property.
Moreover, Resume Data was processed with Ollama to extract skills without needing manually tagged datasets. These skills were then linked to employees as nodes in the graph.
Talking Point 4: Graph Schema and Modeling
NASA built a labeled property graph with nodes including:
- Employees
- Position Title
- Occupation Series
- Pay Grades
- Organizations (MISO - Mission Support Enterprise Organization)
- Centers
- Projects with associated description set as Node property (unstructured text)
- Level of Education
- University attended
- Instructional Program Major
- Extracted Skills
All nodes were labeled as "Entity" to support vector indexing and GraphRAG (Graph Retrieval-Augmented Generation).
Talking Point 5: Live People Graph Demo Highlights
During the community call, the team showcased real Cypher queries on a sample dataset (with anonymized PII) to answer the following types of questions for NASA:
- Subject Matter Experts Finder Question: designed to identify employees with expertise in specific domains or mission-critical capabilities.
- Leadership Report-Out Descriptive Questions: designed to provide leadership high-level metrics by analyzing workforce composition, capability distribution, and organizational dynamics.
- Project Overlap Questions: designed to detect near-duplicate projects based on similarity scores.
They also previewed a RAG-based chatbot that lets users query the graph using natural language.
Want to see these live queries in action? Catch the full demo in the community call now!
Talking Point 6: LLM-Powered RAG Pipeline
RAG-based chatbot Is built by NASA on top of the graph. Here’s an overview of how it works:
- LLM extracts key information from question.
- Modified Pivot Search is performed on each piece of key information separately instead of together - returning multiple relevant nodes.
- Relevance expansion off of these multiple relevant nodes is also perfored:
- Starts at each relevant node and makes desired number of hops
- Returns the start node, end node, and relationship information between these
- These are called "context triplets"
- GraphRAG provides Ollama these "context triplets" with the original question to generate a context-aware response to the user query.
Embeddings were stored directly in Memgraph and indexed using cosine similarity. The system is still being refined, with plans to test re-ranking and improve embedding models.
Talking Point 7: Limitations and What’s Next
This project is still evolving and improving by the day. The current graph has about 27K nodes and 230K edges, with plans to scale up significantly. Future work includes:
- Enhancing data quality and disambiguation (e.g., mapping "JS" to "JavaScript")
- Automating the data pipeline
- Expanding the graph to include employee learning goals, preferred project types, and skill classifications
- Improving Cypher generation and RAG accuracy with model context protocol (MCP)
NASA’s final goal is to scale up the People Graph to over 500,000 nodes and millions of edges.
Q&A
Weʼve compiled the questions and answers from the community call Q&A session.
Note that weʼve paraphrased them slightly for brevity. For complete details, watch the entire video.
- How did you go about taking that unstructured text and then converting it to a keyword classification?
- Madison: Pre-LLM, the team used custom Named Entity Recognition with spaCy models, which required manually tagged training datasets and was labor-intensive. LLMs have made this information extraction much more feasible.
- Did you define the graph relationships (schema) before starting, or did you define them as you went?
- Madison: We started with an intuitive understanding of how people are connected to their attributes and work. David: Knowledge graphs allow flexibility; you don't need a full schema upfront. We began with known relationships and added latent ones as we explored the data. Relationships like project similarity were added dynamically. Madison: Yes, the similarity relationships were formed after the initial data was added, based on analysis of the existing data.
- What made you choose Memgraph over other setups like Neo4j?
- David: I've been at this for well over 10 years and I've looked at various different graph databases from that time. I was using Neo4j when it was a command line interface back in 2015. To make sure everyone understands that, I prefer label property graphs over RDF. So that naturally made me gravitate more towards Neo4j as the primary one at that time. The biggest thing is, with Neo4j, it's very costly for me. I'm going to be quite upfront and I've told the Neo team the same thing. I can't afford that within my current environment. A few years ago, I came across looking around and I found Memgraph. Memgraph uses Cypher, just like Neo4j. Memgraph does in Python, unlike Neo4j with just Java. So there was a lot of benefits in knowing that I can utilize the same tool without having to relearn a whole lot because we've done a lot of work within Neo4j. And then Memgraph showed me the cost. That kind of sold me for time for us to be able to do that. It does everything we've done in label property graphs. So we were able to pivot over to a tool that was more cost effective for us and we did not have to have a huge learning curve because we were already using the same capabilities that we already learned. Plus, my team is half Python, half R so the Python side could easily go in there and replicate what we needed to do. So it was more about ease of transition as well as cost around that.
- How did you create the relationships related to cosine similarity and other similarities
- Madison: We iterated through project nodes, compared the embeddings of their descriptions, and created relationships between projects based on a cosine similarity threshold.
- You mentioned using a model to generate embeddings. Did you store these in Memgraph for similarity search?
- Madison: Yes, embeddings are stored as node properties in Memgraph, and we use vector search indices on these to find similar nodes and facilitate fuzzy searches.
- Are you also storing data attributes on the relations, such as proficiency level of related skills or years of experience? Are you using that in your traversals?
- Madison: We have some relationship attributes but need more experimentation on quantifying things like experience. While RAG considers relationship properties, they are not a primary focus yet, but we see their potential.
- How do you deal with data duplications and ambiguity, for example, variations in skill names like 'JavaScript' and 'JS' from different sources like resumes?
- David: LLMs help by understanding variations like 'JavaScript' and 'JS'. We can also use prompt engineering and context awareness within the RAG environment to guide the LLM to map synonyms to consistent representations.
- Madison: While LLMs assist, we also incorporate semantic similarities into our accuracy metrics when evaluating extracted skills to account for these variations.
- What kind of scale would you expect to have in terms of nodes and relationships when you load all your data into Memgraph? What's the volume of data?
- David: Our current database has around 27,000 nodes and 230,000 edges, including about 18,000 employee nodes, but this isn't exhaustive. Madison: We expect to scale up as we add more data. David: A previous, similar project handled around 500,000 nodes and 1.5 to 2 million relationships easily, which is still considered a small graph scale.
Further Reading
- Blog post: Building GenAI Applications with Memgraph: Easy Integration with GPT and Llama
- Vector Search Tutorial: Building a Movie Similarity Search Engine with Vector Search in Memgraph
- Hands-On GraphRAG Notebook: Build Your Own RAG-Powered Knowledge Graph
- Webinar Recording: Optimizing Insulin Management: The Role of GraphRAG in Patient Care
- Webinar Recording: Cedars-Sinai: Using Graph Databases for Knowledge-Aware Automated Machine Learning
- Webinar recording: Microchip Optimizes LLM Chatbot with RAG and a Knowledge Graph
- Whitepaper: Enhancing LLM Chatbot Efficiency with GraphRAG (GenAI/LLMs)
Memgraph Academy
If you are new to the GraphRAG scene, we suggest you check out a few short and easy to follow lessons from our subject matter experts. For free. Start with: