How to Model Insurance Data as a Graph
Data is the most important asset an insurance company possesses, and it’s important to keep it safe and handle it with care. Unfortunately, being cautious sometimes slows down innovation. In insurance, the go-to storage and analytics tech is still bundled into an old-fashion relational database which is considered state-of-the-art data management software. But times have changed, and companies should move on.
Solutions like graphs enhance insurance information systems. Graph-based systems are faster and more flexible and are indispensable in recommendation and fraud detection systems that increase customer care and mitigate risks.
The first step to switching to a graph database is to update the data model. Although transforming data from a relational database into graph data seems like an insurmountable task - it is not! The following example from the insurance domain helps to switch the thinking about data organization as rows of records to graph objects like nodes and relationships. Use it as a springboard to move away from antiquated systems and get your company ahead of the competition.
Insurance data system with relational tables
To fully grasp the idea of table-to-graph transformation, one must understand the data domain. We will be dealing with an example model of insurance company data. We model the insurance entities from a brief description:
“An individual with an insurance policy got involved in an incident with his vehicle along with a few other individuals. Some individuals sustained injuries. The insurance claim has been created in the system and a claim payment has been made to the insured individual”
Bolded words are modeled as tables, along with addresses, and specific information such as names, vehicle brands, incident dates, and more are table columns.
Relational databases holding all this information in table-like format look like this:
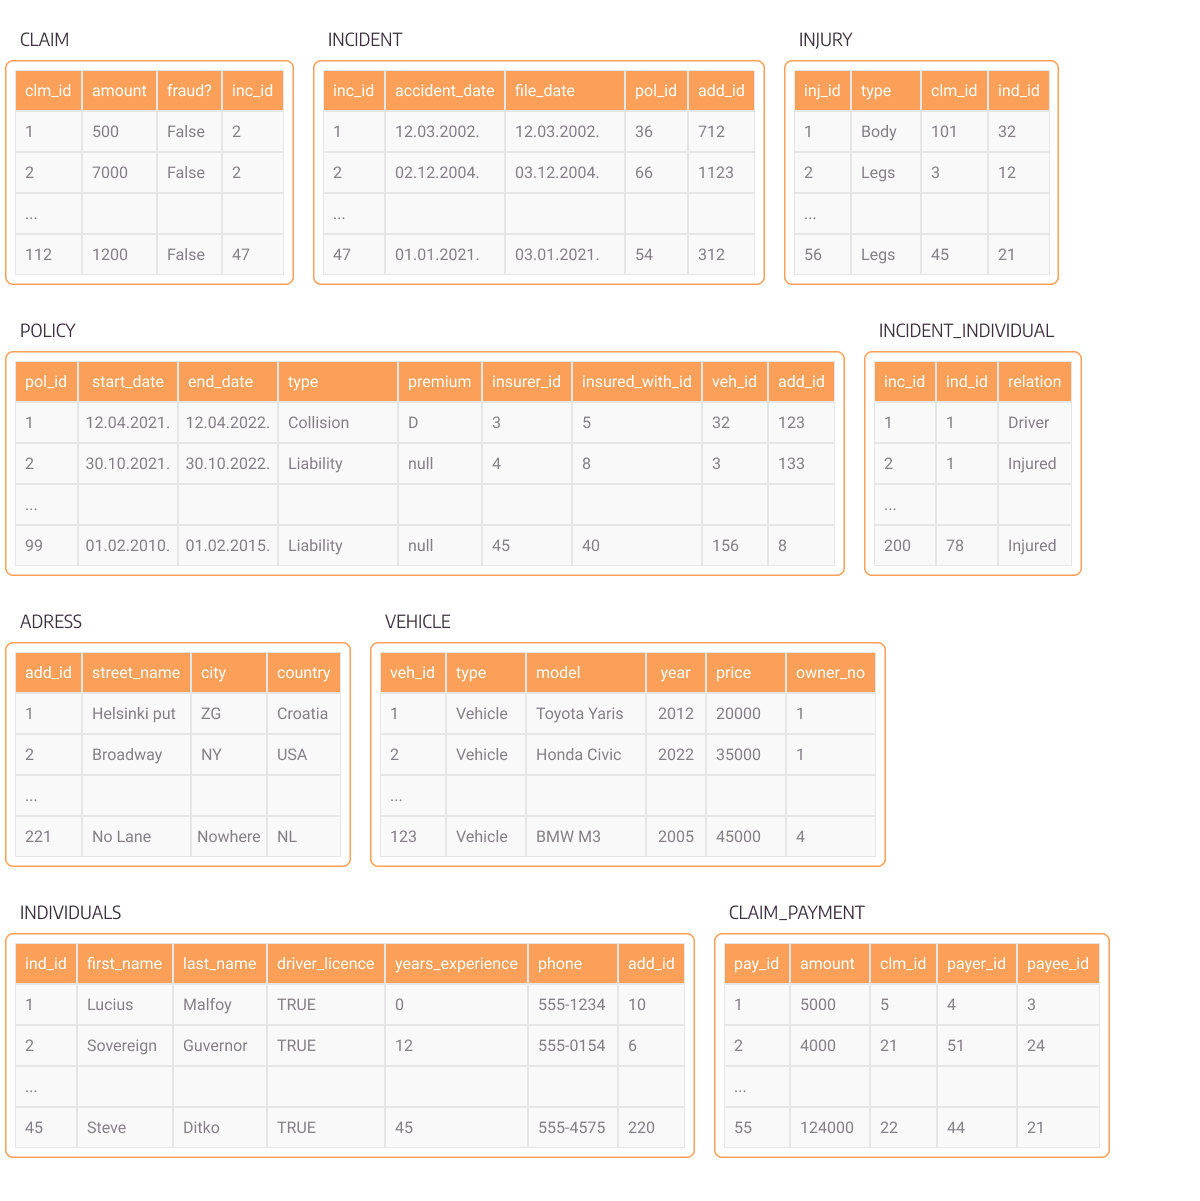
Figure 1. Relational table insurance data
Data in this form is hard to analyze at first glance and extract any kind of useful knowledge from. Although the data is related across tables via foreign keys, the connections are not easily noticeable. If we want to query data between multiple tables in order to fetch all individuals involved in fraudulent claims, for example, we would need to use time-demanding JOIN operations. These data connections are made very easily in graph databases by traversing relationships.
Modeling comes first
Graph models really shine when it comes to relationships, so working with a model of interconnected entities makes the most sense for using graph databases. In order to import the data contained in tables as described above, the first step is to model the use case. Finding a suitable model depends on the task. An overall suitable model would be a graph capable of storing different node types and multiple relationships between entities. It’s called a heterogeneous graph.
It is worth noting that there are multiple types of graphs used for data storage. RDF graphs, in short, store nodes and relationships as entities, while property graphs allow them to have properties, so a single node can contain multiple data values and types. We will be focusing on property graphs such as Memgraph and Neo4j.
But let's take it step by step. To construct a graph, we should understand the data in hand and what we want to model as nodes, and what to connect with relationships. Fortunately, table data is also modeled with entities in mind.
We can start with incidents, which in this case, have a specific table. We want to model this by a node type, so we can model each row of the Incident table as a single node, labeled as :Incident, to identify that node as containing information about an incident. Then, we want to know who was involved in an incident, and we have personal information about individuals who reported the incident by making an insurance claim. So we can label nodes as :Individual and have them contain other information as node properties.
If you follow good practices while modeling tabular data, it shouldn’t be a problem to translate them to graphs. In our example, most relationships represent foreign keys in tables. One exception is the connection between an individual and an incident, which we made from the incident_individual table.
Figure 2. An animation showing tables turning into graph nodes, first incident, then individual, then incident_individual turning into relationships
In an ideal case, table rows are generally modeled as nodes, and foreign keys in those rows are regarded as relationships between nodes. In the case of associative tables, model many-to-many relationships for foreign key pairs. Row columns become node properties, and because graphs can also have properties on relationships, a relationship connecting an individual and an insurance policy can have a property that states the expiration date of the policy. Upon expiration of the policy, the relationship can be removed with a simple query.
If you notice that many nodes connect to a large number of other nodes, you are looking at a super-node. They can cause problems in the future, so it's best to avoid them by transferring super-nodes into a property. For example, rather than having a node “Policy Type”, it is better to have a property named “type” in a node labeled “Policy”.
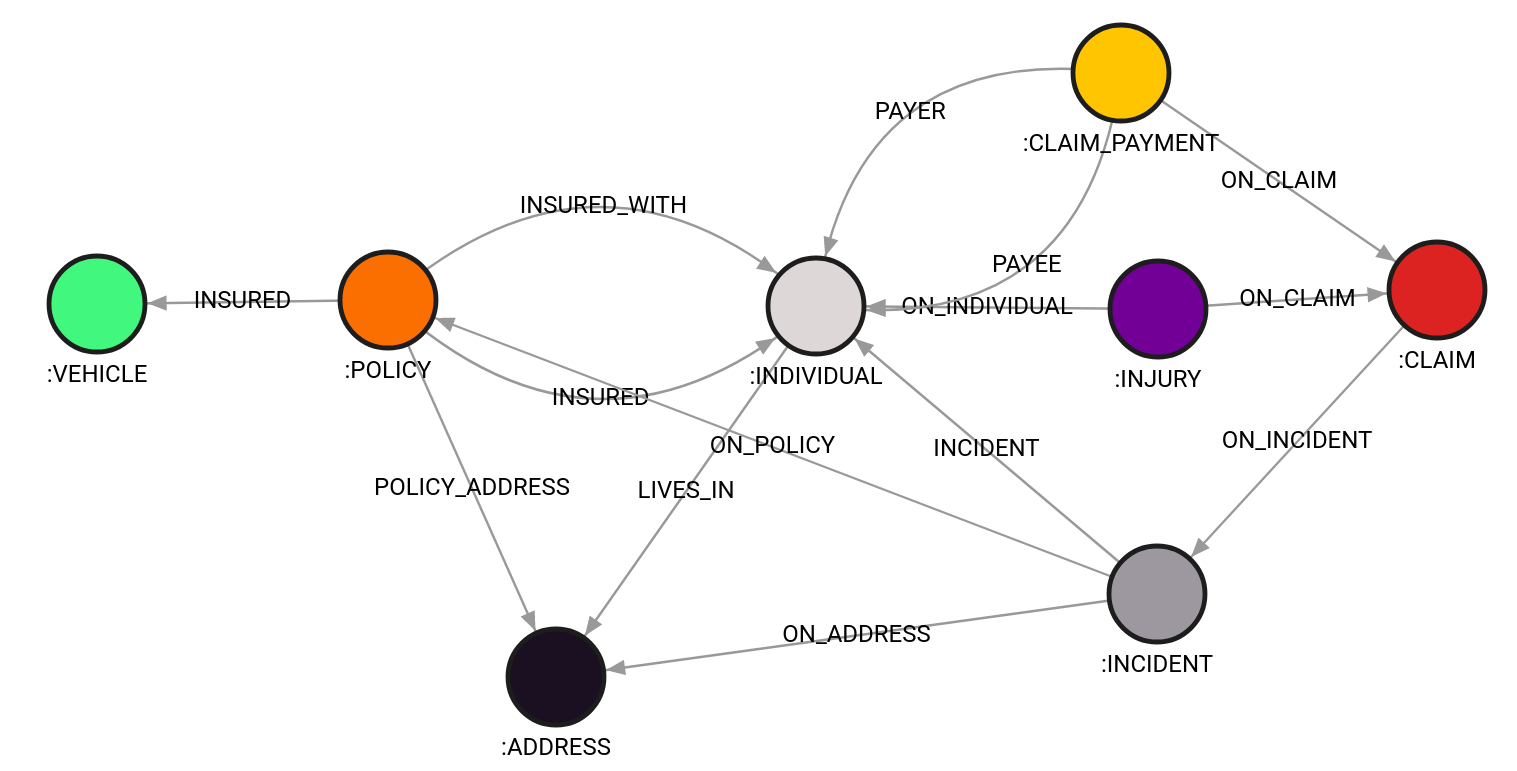
Figure 3. complete graph schema for insurance data
Furthermore, when looking at the data from Figure 1, think about how entities could be related in the insurance world. For example, they can share an address, meaning that individuals living at the same address are connected with many of the same nodes. Another example is payment, which is a unidirectional event that involves the payer and payee. Information about those individuals and their relationships can be used when investigating events of interest.
Unfortunately, there is no cookbook for every use case. But on the other hand, creating a model without your hands being tied allows for more freedom and flexibility when working on specific tasks. Once your data model is figured out, it’s time to start importing data.
Conclusion
In the insurance industry, data is key, and millions of insurance claims and incidents make up a type of social interaction between themselves. Graphs are ideal when it comes to modeling such networks and can substantially reduce the complexity of storing and representing that data. Once the data is imported into a graph database, you can create hybrid machine learning models to improve fraud detection in your system and save millions.
Get with the times and introduce graph technology into your business! Check on this small but real-life example of how Memgraph and graph algorithms can help you discover fraudulent activities.