Embark on the Fraud Detection Journey by Importing Data Into Memgraph With Python
With the fast evolution of data analytics and management solutions, insurance companies still largely rely on relational databases. By using Memgraph for data storage and analytics, you can easily harness the power of graph databases to manage highly interconnected or networked data better, run faster queries, and use graph algorithms to gain better insights into the data.
To inspect insurance claims and utilize graph algorithms for systems like insurance policy recommendation and fraud detection, tabular data must first be imported into a graph database. We can do it quickly and much more easily with Python without Cypher commands. Let’s dig in to see how.
Move beyond Cypher when importing tabular data
The dataset we will use to showcase importing data into Memgraph, based on the designed data model, is insurance-based tabular data. It essentially models relational tables for insurance claims, policies, incidents, and other insurance-related processes. The tables are presented in the image below, along with attributes. The primary purpose of the data is to keep track of insurance claims along with all entities involved, their insurance policies, and payments.
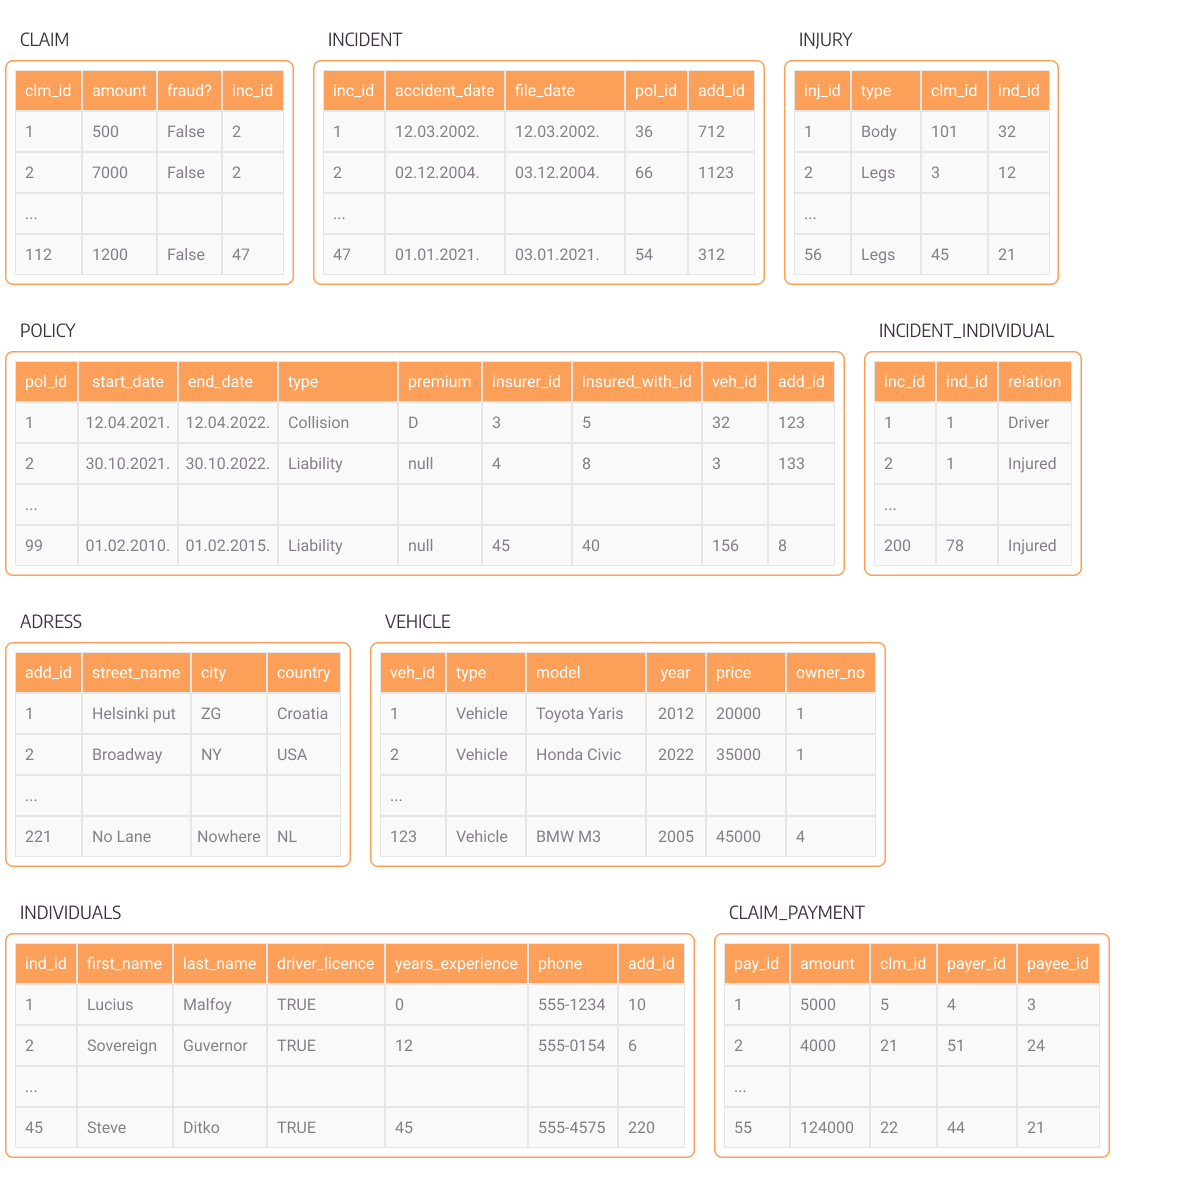
Figure 1. Relational tables modeling insurance data
To make the best use of the power of graphs, developers with existing tabular data need a way to import data into Memgraph.
The default importing process looks something like this. There would be a CSV file for every table and you would need to load it and make a Cypher query defining how to create graph entities. Of course, Memgraph supports this with the LOAD CSV clause. However, that assumes an understanding of Cypher, which is not always the case. Welcome GQLAlchemy.
GQLAlchemy is Memgraph’s fully open-source Python library and Object Graph Mapper (OGM) - a link between graph database objects and Python objects. GQLAlchemy supports transforming any table-like data into a graph. Currently, it supports reading CSV, Parquet, ORC, and IPC/Feather/Arrow file formats. All you need to do is create a configuration YAML file or object. Configuration YAML contains a definition of how a table transforms into a node, how entities connect in one table, and how multiple objects are cross-connected in tables created only for such connections.
One of GQLAlchemy’s capabilities is to import tabular data from a relational database into Memgraph. You only need to write a few lines of code and define how the data should be interconnected. The code defines where the data should be imported from and allows more control when creating relationships between nodes, especially the many-to-many relationships. Let’s see an example of how it’s done.
Defining a transformation of tabular data into a graph with Python
Here is an example of a configuration file that shows how tables CLAIM, INCIDENT, and POLICY from Figure 1 would be transformed into graphs:
indices: # indices to be created for each file
  claim: # name of the table containing claims with clm_id
    - clm_id
  incident:
    - inc_id
  policy:
    - pol_id

name_mappings: # how we want to name node labels
  policy:
    label: POLICY # nodes from the policy table will have POLICY label
  incident:
    label: INCIDENT
  claim:
    label: CLAIM

one_to_many_relations:
  policy: [] # currently needed, leave [] if there are no relations to define

  claim:
    - foreign_key: # foreign key used for mapping
        column_name: inc_id # specifies its column
        reference_table: incident # table name from which the foreign key is taken
        reference_key: inc_id # column name in reference table from which the foreign key is taken
      label: ON_INCIDENT # label applied to the relationship created

  incident:
    - foreign_key:
        column_name: pol_id
        reference_table: policy
        reference_key: pol_id
      label: ON_POLICY
Once you get familiar with this template, adding another table is simple. For instance, to add an INDIVIDUAL table, you simply add its index to the indices field, and the label name to name_mappings. Modeling data in graph form becomes natural quickly once you get the hang of it.
Importing data into Memgraph
All that’s left to define is a quick script that will do the hard work of reading the configuration file and moving the data from a tabular file format into Memgraph. The ParquetLocalFileSystemImporter can be swapped with importers for different file types and systems.
Currently, GQLAlchemy also supports connecting to and reading from Amazon S3 and Azure Blob file systems. See more about it in the table-to-graph importer how-to guide.
import gqlalchemy
from gqlalchemy.loaders import ParquetLocalFileSystemImporter

PATH_TO_CONFIG_YAML = "./config.yml"

with Path(PATH_TO_CONFIG_YAML).open("r") as f_:
    data_configuration = yaml.safe_load(f_)

translator = ParquetLocalFileSystemImporter(
    path="./dataset/data/",
    data_configuration=data_configuration
)
translator.translate(drop_database_on_start=True)
Once the tabular data from Figure 1 has been transformed into graph data, you can create a schema like the one in Figure 2, which shows how the entire database looks in Memgraph.
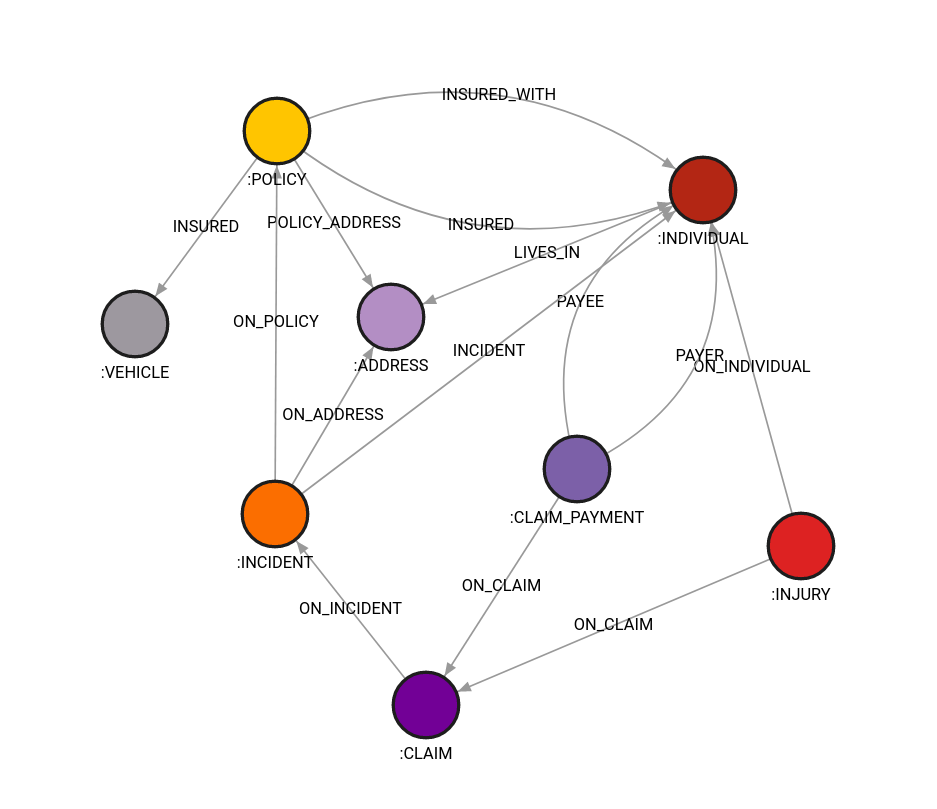
Figure 2. Graph data schema in Memgraph Lab
Try it out yourself before tackling your dataset and check out the insurance fraud Jupyter demo. In the demo, we generate a mock table insurance dataset, import it into Memgraph, and then use GQLAlchemy along with scikit-learn to design a machine learning system for fraud detection.
Conclusion
After deciding graph technology is the right tool for detecting fraud, you need to model your data from tables to nodes and relationships. Then, it’s time to start thinking about importing. Dealing with row-to-row transformations of CSV files can be challenging, especially if you are just starting with the Cypher language.
GQLAlchemy enables you to import existing tabular data into graph form with Python. Dealing with objects you are already familiar with can ease the stress of a strenuous job such as import and let you concentrate on the job to come - to make your company tap into the power of graphs. Check out a Playground demo of how certain Cypher queries and graph algorithms can help you detect fraudulent behavior. And when the time comes, enhance the graph technology with machine learning to get ahead of the tricksters.