Three Reasons How Graph Databases Can Enhance the Insurance Industry
Good, old-fashioned relational databases are the industry standard and the go-to technology used for data storage in the insurance industry. All developers are familiar with using table data and SQL, so it is easy to think and safe to assume that tabular data is the most convenient way to organize data in the insurance industry. But what if we told you that is completely wrong.
The data in the insurance domain is highly interconnected. Numerous insurance claims consist of multiple objects, such as people involved, their policies, vehicles, and incidents. And on top of it all, objects are enriched with additional information such as names, addresses, dates, ID numbers. The data, in the end, forms a kind of social network.
This is exactly the setting graph technology shines in, social processes with complex interactions. Graph databases make the information system more responsive, allow for unexpected changes in the data structure and enable the insurance companies to successfully expand their business by tapping into the insights provided by the recommendations engines built on top of the data.
This blog post lists 3 main reasons why shifting to graph databases should be a priority for any insurance company that wants to make their business more effective in detecting fraud and why it gives a helping hand with translating data trapped inside tables into graph objects.
1. Graph databases perform significantly faster with highly interconnected data
Relational databases use indexes, which are an expensive but indispensable tool that helps avoid searching for records row by row using a key. To identify a relationship between objects, two tables are joined and indexes on both tables are scanned recursively to find all the elements fitting the query criteria. All these scans make JOIN operations in relational databases highly time-consuming. For example, a benchmark showing this comparison was made: given 1000 users with an average of 50 “friend” relationships, find if 2 people are connected in 4 or fewer hops. The query in a popular relational database took around 2000 ms.
On the other side, in graph technology, relationships between objects are one of its two main building blocks and are created instantly when the data gets imported and connected to other objects. Instead of doing redundant recursive scans, relationships are found by doing graph traversals which are much faster. The same query that took the relational database 2000 ms, graph databases would complete in 0.4 ms. When the example was scaled to a use case with 1,000,000 users, the relational database was stopped after several days of waiting for the results. The graph database? It took 2 ms to calculate the query output.
for a set of million users, the query was stopped after a few days
Indexes still exist in graph databases as well - they are not forbidden. They are supported and can be explicitly defined and make querying even faster.
The animation below shows the difference between connecting entities in a relational database and a graph database.
Figure 1. JOIN operation compared with graph traversals
To do this in a relational database, we combine the two tables by matching a foreign key to another table’s key. On the other hand, in a graph database, we simply follow the relationships from one node to another.
By default, agents from insurance companies manually inspect claims for fraud. More often than not, they can make little sense of the event just by looking at the data in the table format due to so many variables. This task consumes a lot of time and energy, even for skilled and trained professionals. So, not only is it not effective, it also costs a lot of money eventually. If the data is modeled as a graph, the event would be instantly clear just by looking at the relationships between entities.
Because of the network-like representation of data in the graph databases, individual insurance claims are more easily understood when inspecting a graph rather than inspecting the endless rows of multiple tables.
Figure 3. shows how graphs can be visualized so we can easily understand the connections between the data. On the other hand, tabular data (Figure 2.) is much harder to understand at a glance.
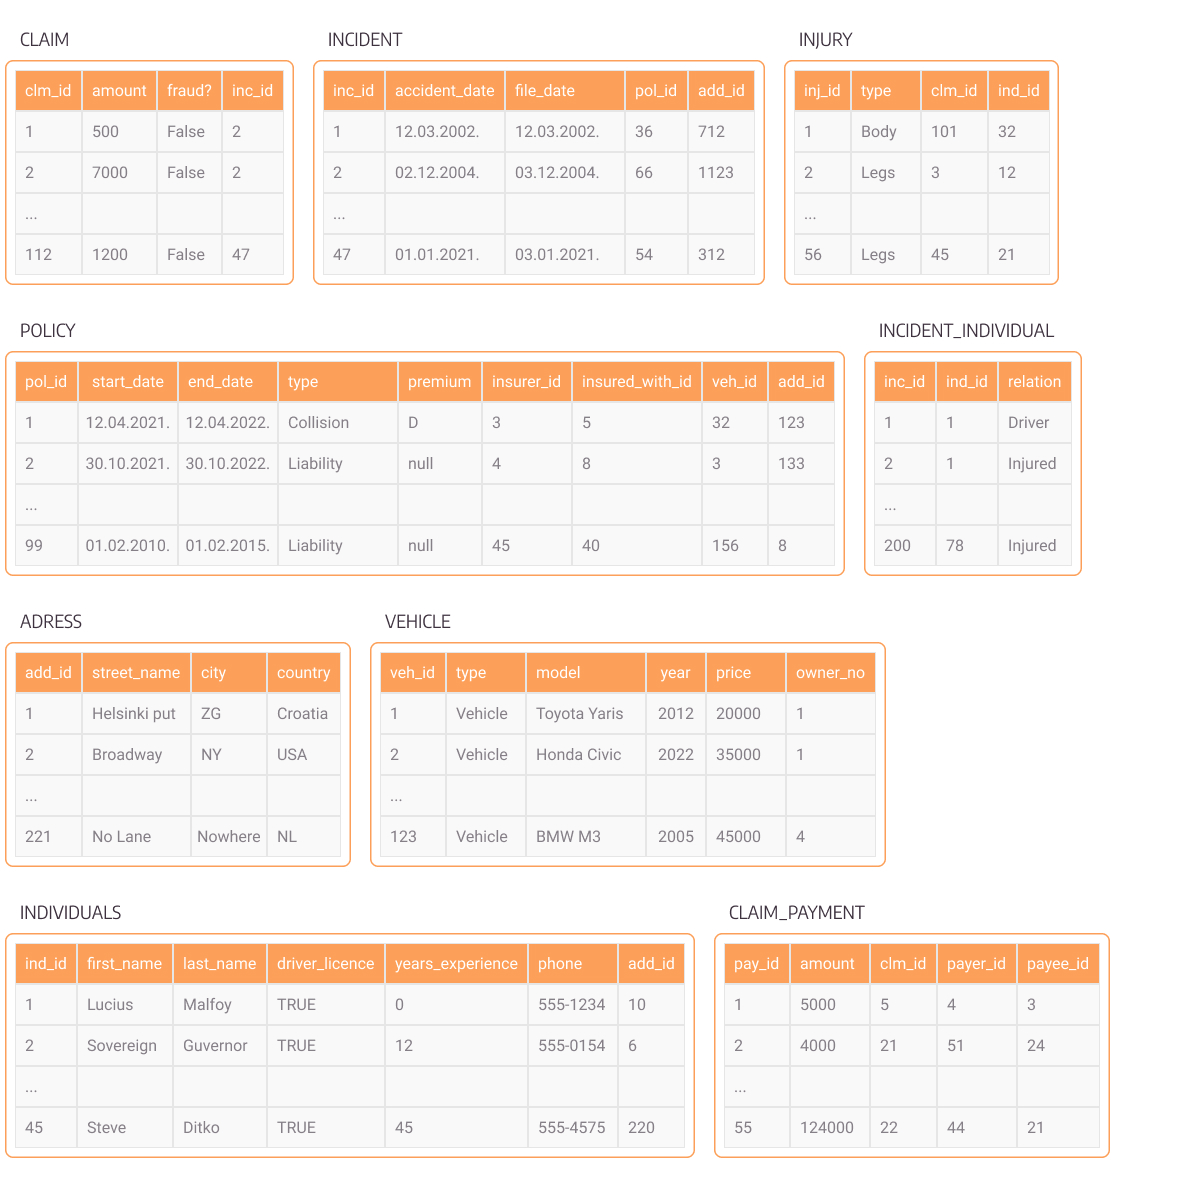
Figure 2. Relational database scheme
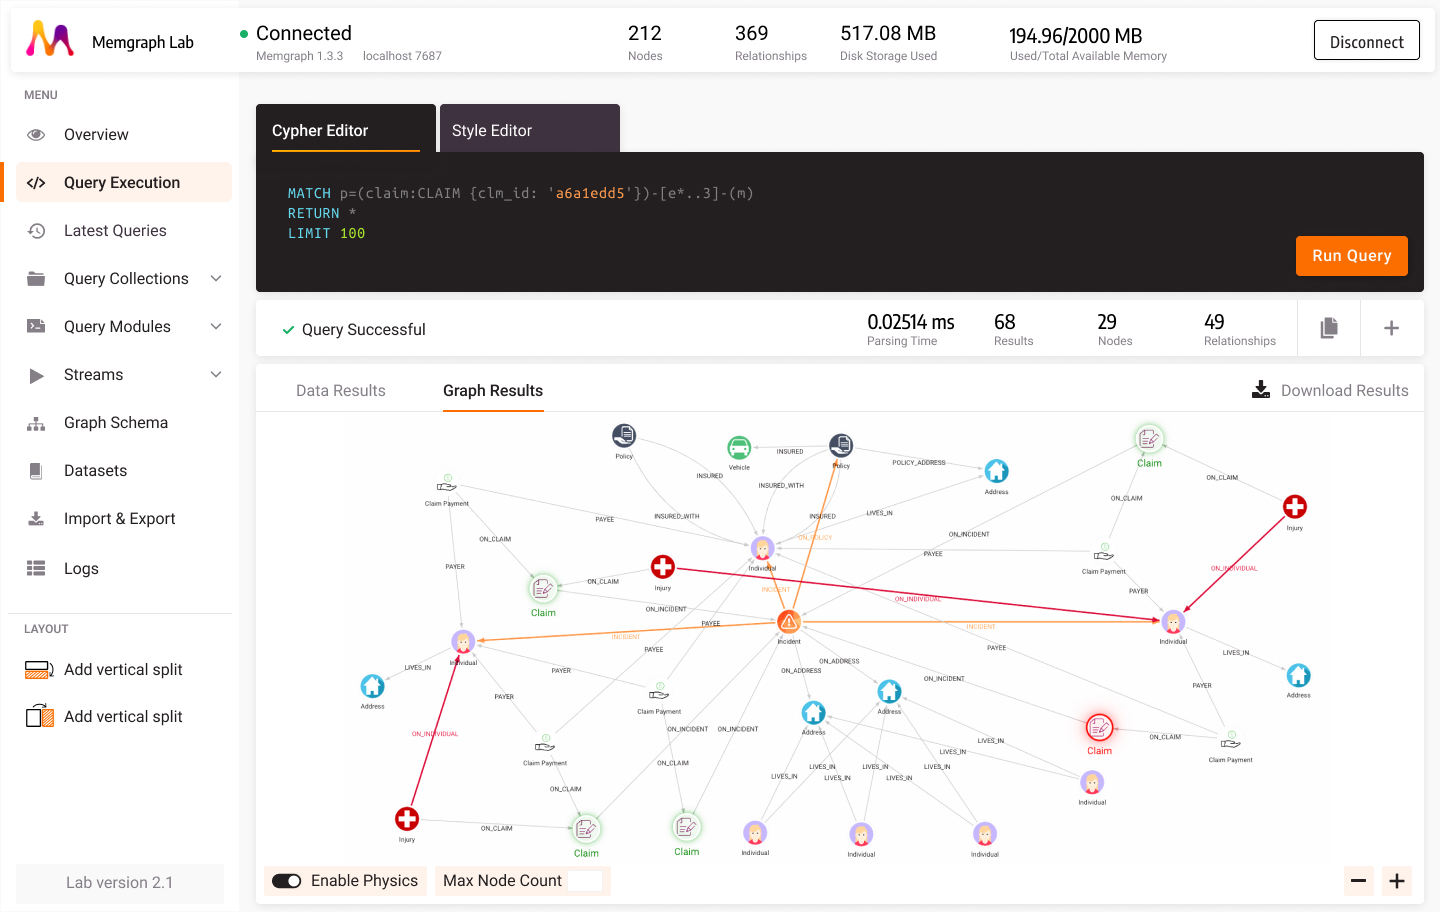 Figure 3. Visualization of graph data and how easy it is to see connections between data points
2. Graph data model can be easily changed
The world is filled with battered developers that survived painful schema changes. On the other side, graph developers are left unbruised and painless. The reason for that is that graph databases easily mimic unexpected changes and their model schema can be changed easily.
In the example shown in Figure 4., let’s say we have entities Individual and Vehicle. When building the relational table database system, Individual and Vehicle were modeled with separate tables containing their own IDs and other fields such as names. Individual also has a field veh_id (vehicle ID) which is a foreign key showing which vehicle the individual has insured. This is not the best practice for modeling this connection, but it is the one that could have been made in real life, and we used it in this example to show how complications might arise in relational tables.
Let's say that later, an individual wants to add another vehicle ownership to his name to be insured. Also, that vehicle has a lease on it and we want to model this information in our database as well.
Now, to store the lease, we need to model an entire database table, think through which information we want to store and could possibly store in the future, to make table columns. Secondly, we have no way of recording multiple vehicle ids to a single individual. We should make another new table to model the connections between vehicles and individuals, requiring even more work.
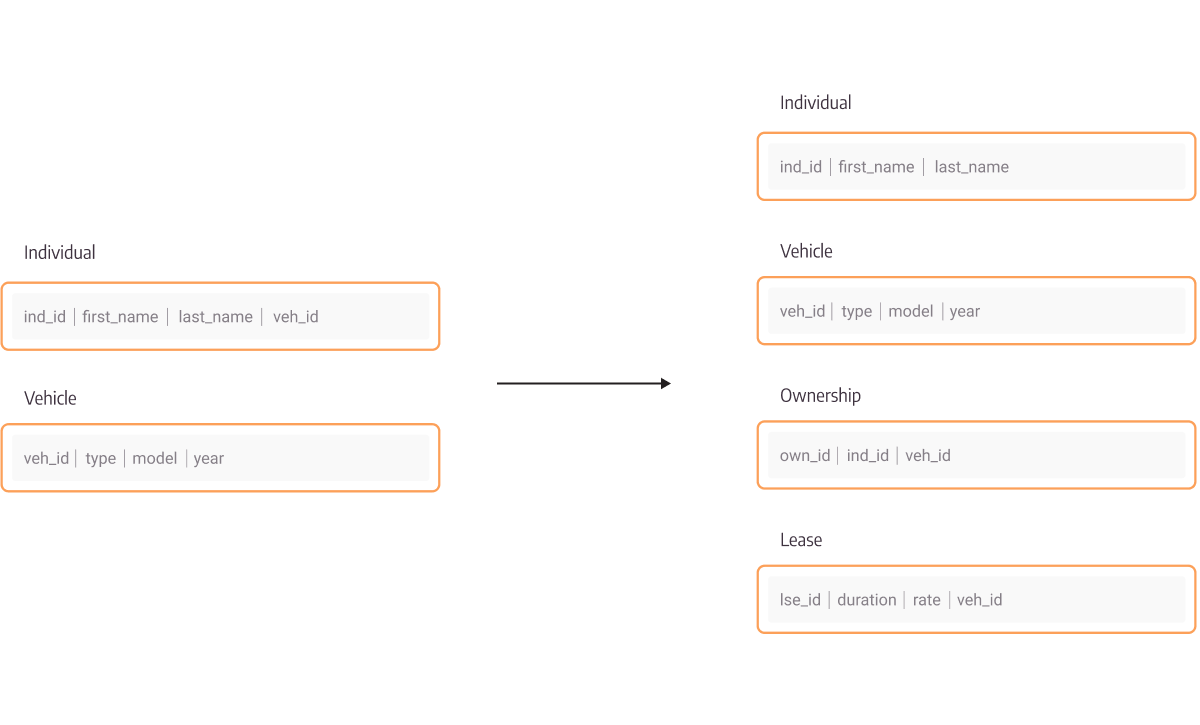
Figure 4. Changes to the relational database schema from adding information about a secondary vehicle and its lease
In a graph database (Figure 5.), there is no reason to fuss. Two new nodes are created, one with the label Vehicle and another with the label Lease (a label that previously didn’t exist!). The Individual node is connected to the second Vehicle, as well as the Lease node to the Vehicle node. Done. Easy. All information about the lease and the vehicle is stored as properties in their respective nodes (and can sometimes be modeled as separate nodes).
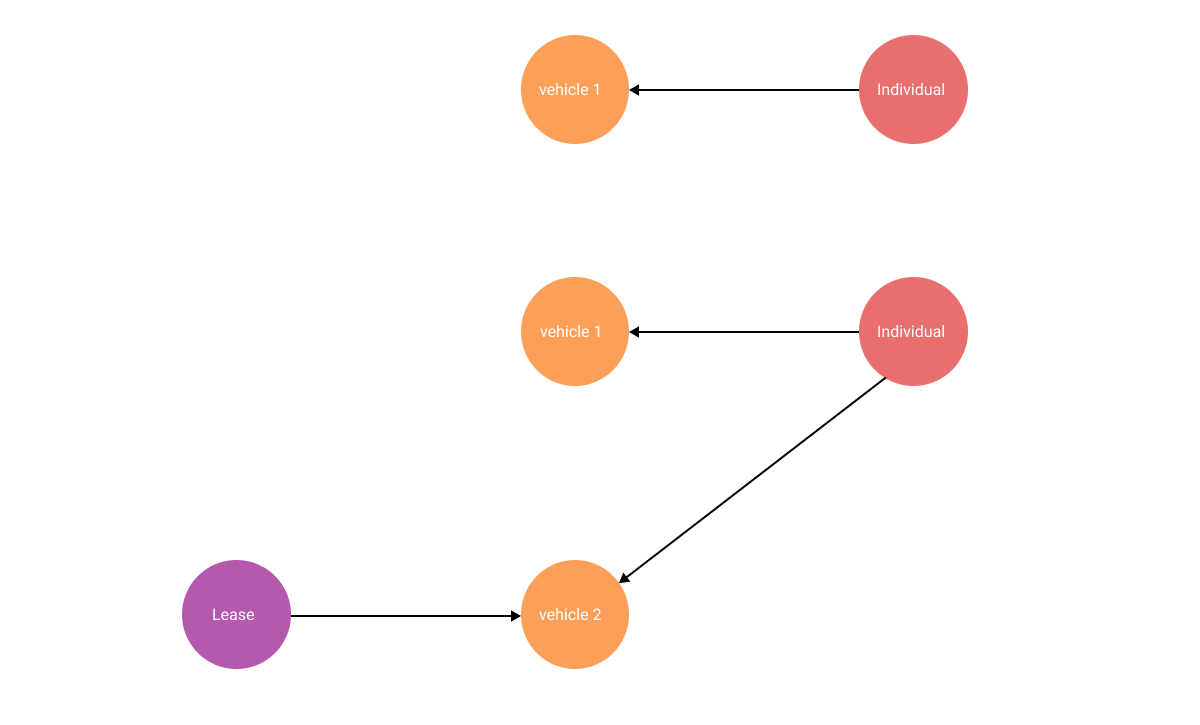
Figure 5. New nodes added to store additional data
3. Tight connections and patterns between entities can help design recommendation and fraud detection systems in insurance
Recommendation systems are not just used to suggest to online shoppers or Netflix viewers what else they might like. They are a powerful tool that can help companies gain future customers by tailoring insurance policies to their specific needs and recommending different policy options.
By analyzing the relationships, graph algorithms are applied to gain more features and information about nodes to work with. For example, community detection algorithm assigns communities to nodes and pinpoints similarities in those communities, and PageRank measures the influence of a node. Using such information about the network (graph) around each node enhances recommendation systems, calculates similarities and detects fraud better.
Figure 6. shows a machine learning system for detecting fraud which uses an enhanced feature set consisting of data gained with graph technology.
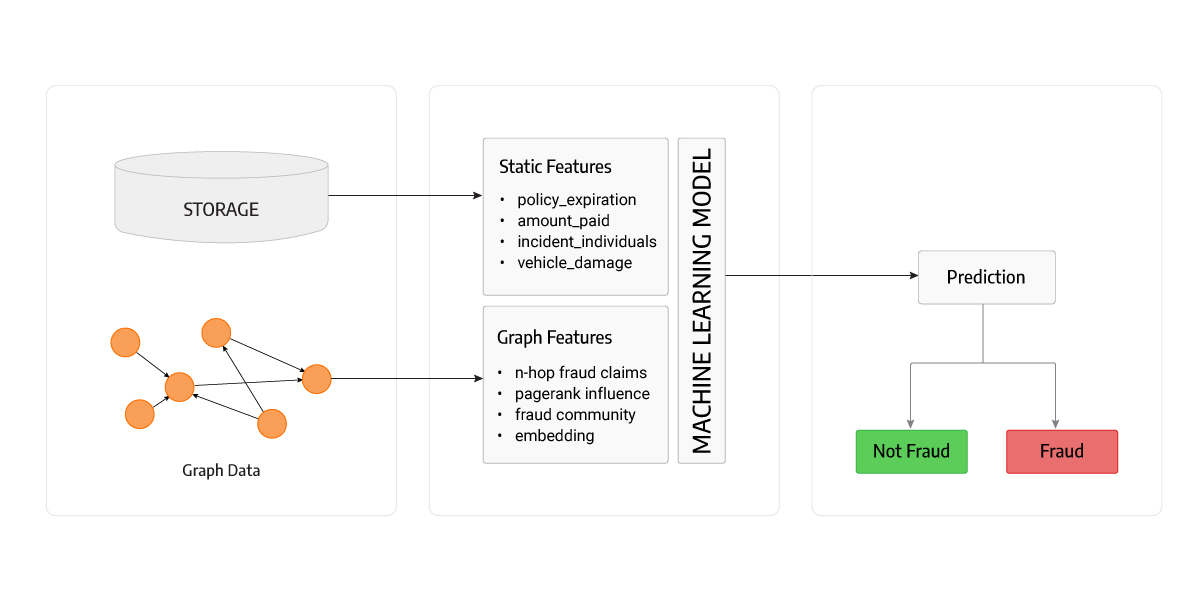
Figure 6. Schema of a machine learning system using graph features along with static features to detect fraud
Conclusion
Getting out of a well-known and antiquated comfort zone of relational databases is… well, uncomfortable. But, it’s necessary as there are clear benefits. Graph databases are a pivotal improvement that will make insurance companies better equipped to understand customers and limit the risk they face from fraud.
Explore insurance fraud through a lesson on Memgraph Playground that will show you how to use various Cypher queries and graph algorithms to pinpoint fraudulent activities.