
From Pixels to Knowledge: How We Built Visual Search Using GraphRAG
Ever wondered how your iPhone Photos app magically finds all your dog pictures when you search for "dog"? Or how Amazon suggests similar furniture when you snap a photo of your coffee table? The magic lies in combining computer vision with knowledge graphs. In our latest Memgraph Community Call, we explored exactly that.
Presented by Dino Duranovic, Senior IT Consultant at EBCONT, and Ante Javor, Developer Experience Engineer at Memgraph, the session showcased how images can be processed using neural networks, structured into knowledge graphs, and queried semantically through a GraphRAG pipeline. It's a fascinating blend of computer vision, vector embeddings, and graph traversal
If you missed the live session, the full recording is available on-demand. Read on for highlights and discover why you’ll want to watch the demo in action!
Talking Point 1: Why This Project
This demo began as a collaborative idea between the Memgraph and EBCONT teams, sparked during preparations for a conference presentation. Initially seen as an unusual mix of computer vision and graph databases, the concept quickly evolved into an exciting technical challenge and ultimately, a practical demo.
The inspiration came from human cognition: when we look at an image, we instantly understand the context (objects, colors, composition, etc.). But machines lack this innate ability. They need to break down an image into pixel-level information, analyze RGB values, and apply sophisticated models to extract meaning.
The team was particularly interested in answering: Can a machine understand what’s in an image, extract structured information, and then let us query it semantically? What if we could not only match similar images but also reason about them?
That idea led to building a proof of concept that brings together image recognition, text-to-image embedding via CLIP, structured representation via knowledge graphs, and finally, search with natural language queries.
Talking Point 2: Understanding Images (Computer Vision)
Unlike humans, machines perceive images as matrices of RGB pixel intensity values. Depending on how deeply you need the image to be understood, there are several stages of computer vision processing:
- Semantic Segmentation: Segments image pixels into semantically similar objects (e.g., all cars in blue, road in purple).
- Instance Segmentation: Differentiates individual instances of semantically similar objects (e.g., identifying different cars of the same type).
- Panoptic Segmentation: Combines semantic and instance segmentation to provide structured information about the image.
This foundational understanding is the first step in turning seemingly random pixels into meaningful information.
Talking Point 3: CLIP: The Bridge Between Vision and Language
A pivotal tool showcased in the session was CLIP (Contrastive Language-Image Pre-training) from OpenAI. CLIP is a game-changer because it helps convert both images and text into comparable embeddings. This means you can do revolutionary things like:
- Search images using natural language: Imagine typing "red sports car with aggressive styling" into your photo gallery and instantly finding relevant images.
- Compare images based on content: Find visually similar items without needing traditional tags or metadata.
The team leveraged CLIP to perform zero-shot classification, allowing the system to identify and relate images and text that weren’t explicitly paired during training. This was key to building a flexible, search-ready system that didn’t need to be retrained for every new object or query.
Talking Point 4: Knowledge Graphs: Structuring the Visual World
Once computer vision interprets an image, how do we make that understanding queryable? This is where knowledge graphs shine. The community call demonstrated building a "car knowledge graph" by extracting key features from images (properties like color, manufacturer, and body type).
This seemingly simple graph provides a powerful backbone for turning fuzzy visual information into precise, structured data. It’s the essential ingredient for:
- Accurate Search: Moving beyond basic keyword searches to semantic understanding.
- Intelligent Navigation: Easily explore relationships between cars, colors, manufacturers, and body types.
- Adding Context: Grounding Large Language Models (LLMs) with factual, interconnected data for context-aware, reliable answers.
Talking Point 5: Live Showcase: From Pixels to Queryable Knowledge
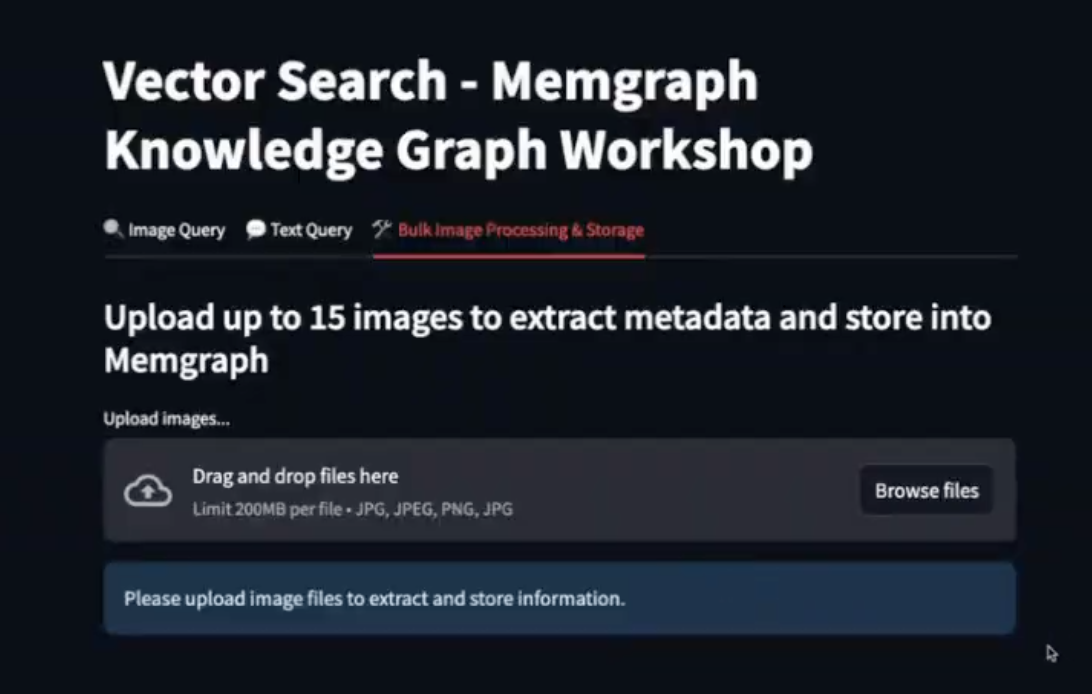
The live demo showcased a seamless, end-to-end pipeline that transformed raw images into a queryable knowledge graph:
-
A collection of car images are ingested and processed via Gemini API to extract structured features in JSON format.
-
CLIP is used to generate a unique vector embedding for each image.
-
The extracted JSON data and CLIP embeddings are loaded into Memgraph, forming nodes (e.g.,
Car,Manufacturer, andColor) and relationships that accurately represent the visual information. -
And, once all the above steps are completed, the images are intelligently queryable. The live demo showcased the following**:**
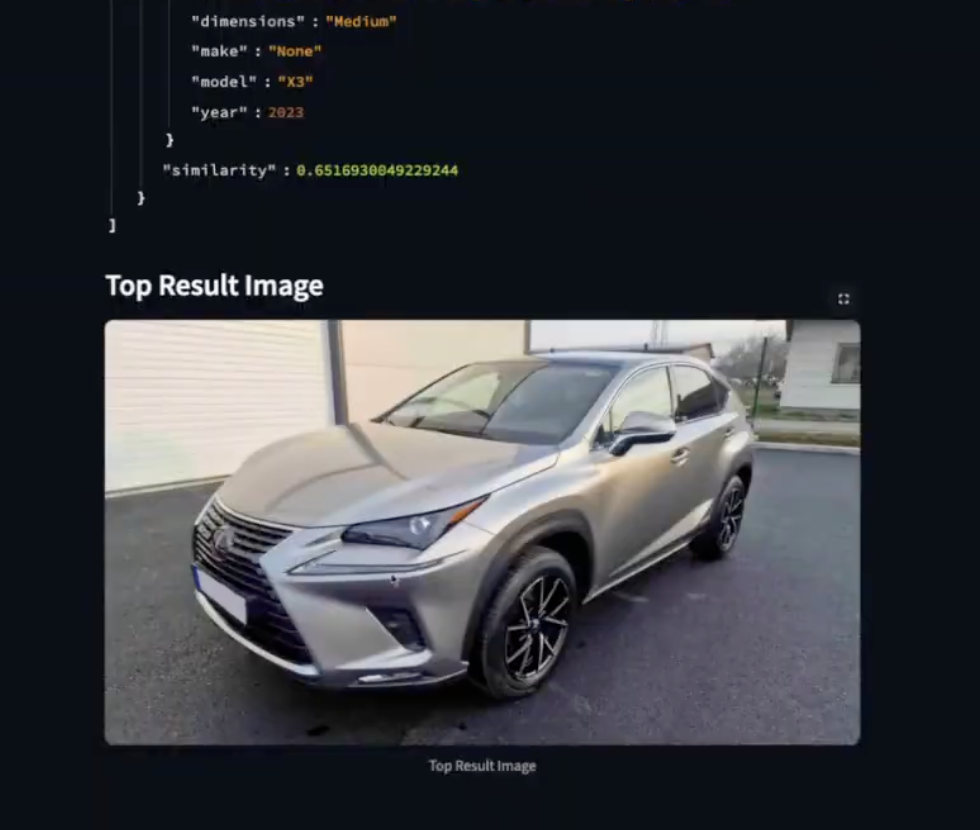
- Image Query: Upload an image, generate its embedding, and find similar cars in the graph based on vector similarity.
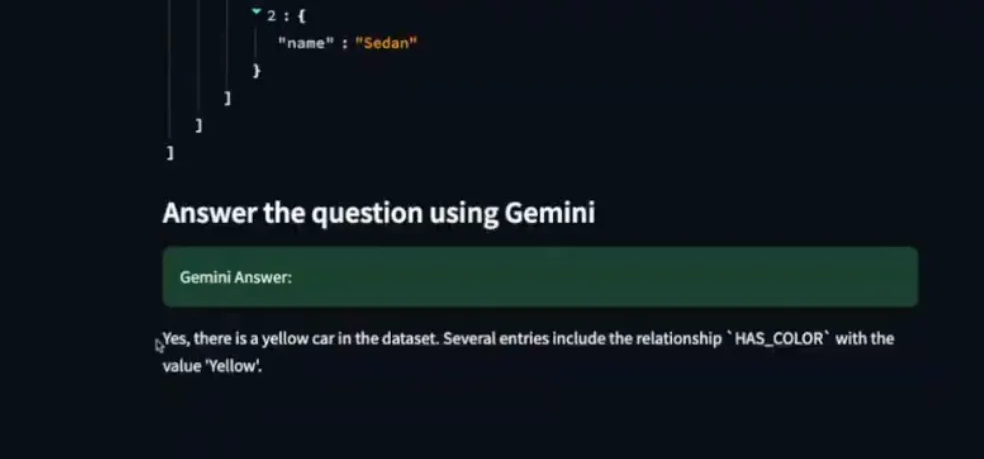
- Text Query: Input a natural language question (e.g., "Is there a yellow car in the dataset?"). CLIP converts the text into a vector, which is used to find the most relevant car node in the graph.

- Relevance Expansion (GraphRAG’s unique capability): Critically, once a relevant car node is identified, the knowledge graph allows for "relevance expansion" which supports fetching of all connected data around that node (e.g., all other yellow cars, manufacturer details, body types). This rich contextual information is then fed to an LLM to generate a precise, human-readable answer.
- Image Query: Upload an image, generate its embedding, and find similar cars in the graph based on vector similarity.
Q&A
Weʼve compiled the questions and answers from the community call Q&A session.
Note that weʼve paraphrased them slightly for brevity. For complete details, watch the entire video.
-
Why use a Graph instead of just a Vector Database?
- The vector search will give you the best match, like one yellow car. But if you want to see all yellow cars, or explore the car’s body type or manufacturer, you need the graph. The relationships between nodes give you context and expandability you can’t get from just a vector database.
-
Is it important to consider the data model when formulating questions for the application, or can any type of question be asked?
- Yes, it is important because as you model the graph, you need to consider the types of questions you'll ask. If you model a body type or color as a separate node with relationships, you can fetch all related cars, providing a pivot point for searching similar nodes. This structured approach allows for diverse questions, as the graph's generic two-hop traversal fetches any related data.
-
So would it be accurate to say that a knowledge graph allows results that are further than one step relationships when querying for something?
- Yes, we did exactly that. We found the most relevant car to our questions and then we said, find us the relationship to this car. Two relationships from this relevant car.
-
I am coming from a RDBMS background, how do you handle temporal data?
- Temporal data in a graph can have a date of expiry, allowing you to detach or filter out irrelevant nodes. The graph supports temporal data, enabling you to build filters that incorporate the temporal aspect into results, for example, to find cars from the 80s. Memgraph also offers a Time to Live feature for these use cases.
Further Reading:
- Docs: Vector Search
- Docs: Memgraph in GraphRAG Use Cases
- Blog: Showcase Building a Movie Similarity Search Engine with Vector Search in Memgraph
- Blog: Decoding Vector Search: The Secret Sauce Behind Smarter Data Retrieval
- Blog: Simplify Data Retrieval with Memgraph’s Vector Search
- Webinar: Talking to Your Graph Database with LLMs Using GraphChat
- Blog: GraphChat: How to Ask Questions and Talk to the Data in Your Graph DB?
- Blog: Why Knowledge Graphs Are the Ideal Structure for LLM Personalization