Visualize Graphs in the Browser With Just a Few Lines of the New Orb Code
An important part of handling data is visualizing it. Graphs as a data structure are no exception to that. We worked on an internal graph visualization library because none of the existing open-source libraries worked for our use case. Just like standard Javascript/Typescript developers, instead of using other libraries, we created a new one. As we are pleased with the baseline structure, we decided to open-source it as Orb. Orb helps you visualize graphs in a simple and easy way. Here is how you can use it.
To run the examples below, make sure you have the following HTML template ready. You should copy the Orb code of each example within the <script> tags. We’ve provided GIST files with the complete code for each example you can check out if you get stuck.
<!DOCTYPE html>
<html lang="en">
<head>
  <meta charset="UTF-8" />
  <title>Orb</title>
  <script src="https://unpkg.com/@memgraph/orb@0.0.2/dist/browser/orb.js"></script>
  <style>
    html, body {
      height: 100%;
      margin: 0;
    }
    #graph {
      height: 100%;
    }
  </style>
</head>
<body>
	<div id="graph"></div>
	<script>
		// Orb code from the examples below goes here
	</script>
</body>
</html>
Render a simple graph
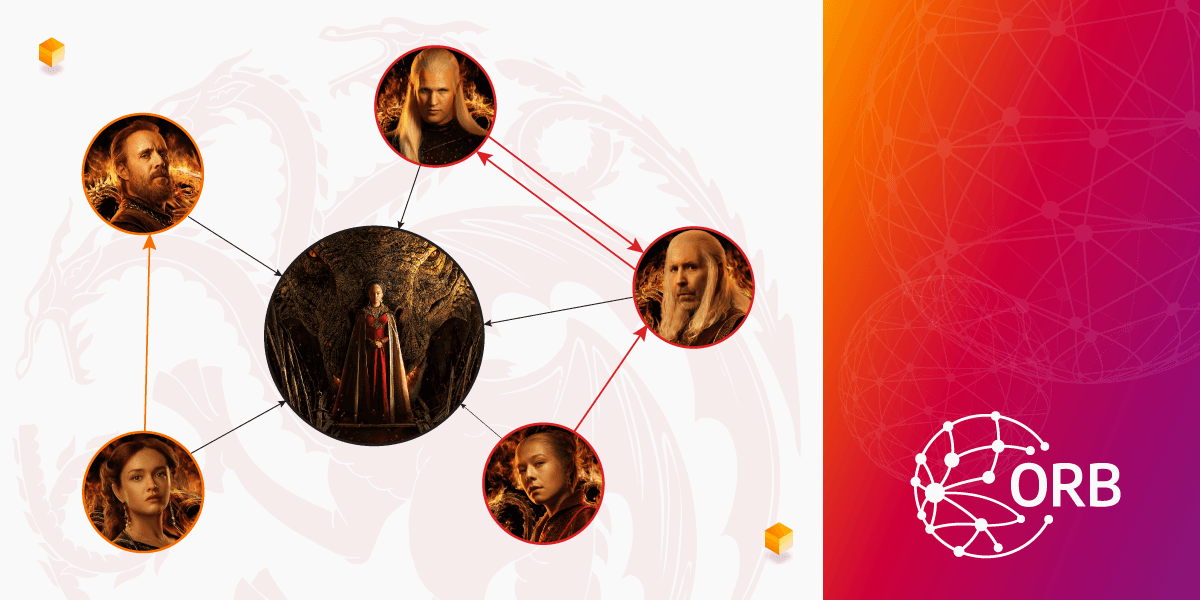
Let's start with a simple graph. In the following example, we have six nodes (featured cast of the TV show House of the Dragon) and nine edges (relationships between the characters). In order to visualize the graph:
- Initialize the Orb with the
containerwhere the Orb will draw the graph. - Set up Orb graph data model with a function
orb.data.setupthat expects information about nodes and edges:- Each node can have different kinds of properties, but the required one is the
id(unique node ID). - Each edge can have different kinds of properties, but the required ones are
id(unique edge ID),start(source node ID), andend(target node ID).
- Each node can have different kinds of properties, but the required one is the
- Render the Orb graph data model with
orb.view.render, which will draw the graph in the initialized container.
Copy the code below within the <script> tags in the HTML template above. Check the complete code on the prepared GitHub GIST.
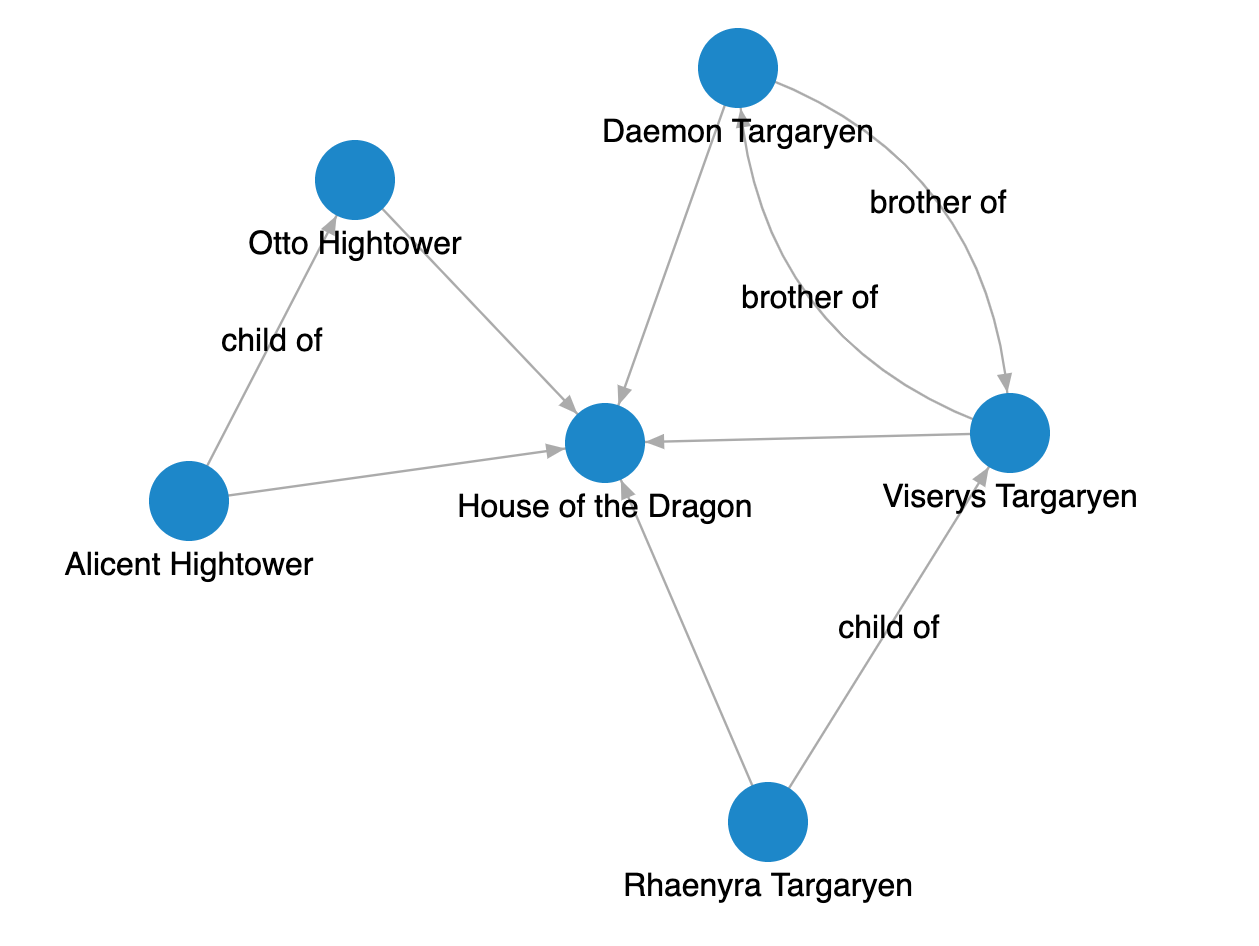
const container = document.getElementById("graph");

const nodes = [
  { id: 1, name: "House of the Dragon", type: "Show" },
  { id: 2, name: "Rhaenyra Targaryen", type: "Person", family: "Targaryen" },
  { id: 3, name: "Daemon Targaryen", type: "Person", family: "Targaryen" },
  { id: 4, name: "Viserys Targaryen", type: "Person", family: "Targaryen" },
  { id: 5, name: "Otto Hightower", type: "Person", family: "Hightower" },
  { id: 6, name: "Alicent Hightower", type: "Person", family: "Hightower" },
];
const edges = [
  { id: 1, start: 2, end: 1 },
  { id: 2, start: 3, end: 1 },
  { id: 3, start: 4, end: 1 },
  { id: 4, start: 5, end: 1 },
  { id: 5, start: 6, end: 1 },
  { id: 6, start: 3, end: 4, label: "brother of" },
  { id: 7, start: 4, end: 3, label: "brother of" },
  { id: 8, start: 2, end: 4, label: "child of" },
  { id: 9, start: 6, end: 5, label: "child of" },
];

const orb = new Orb.Orb(container);

// Initialize nodes and edges
orb.data.setup({ nodes, edges });

// Render and recenter the view
orb.view.render(() => {
  orb.view.recenter();
});
Once you run the example, you should get something like this:
Render a custom-styled graph
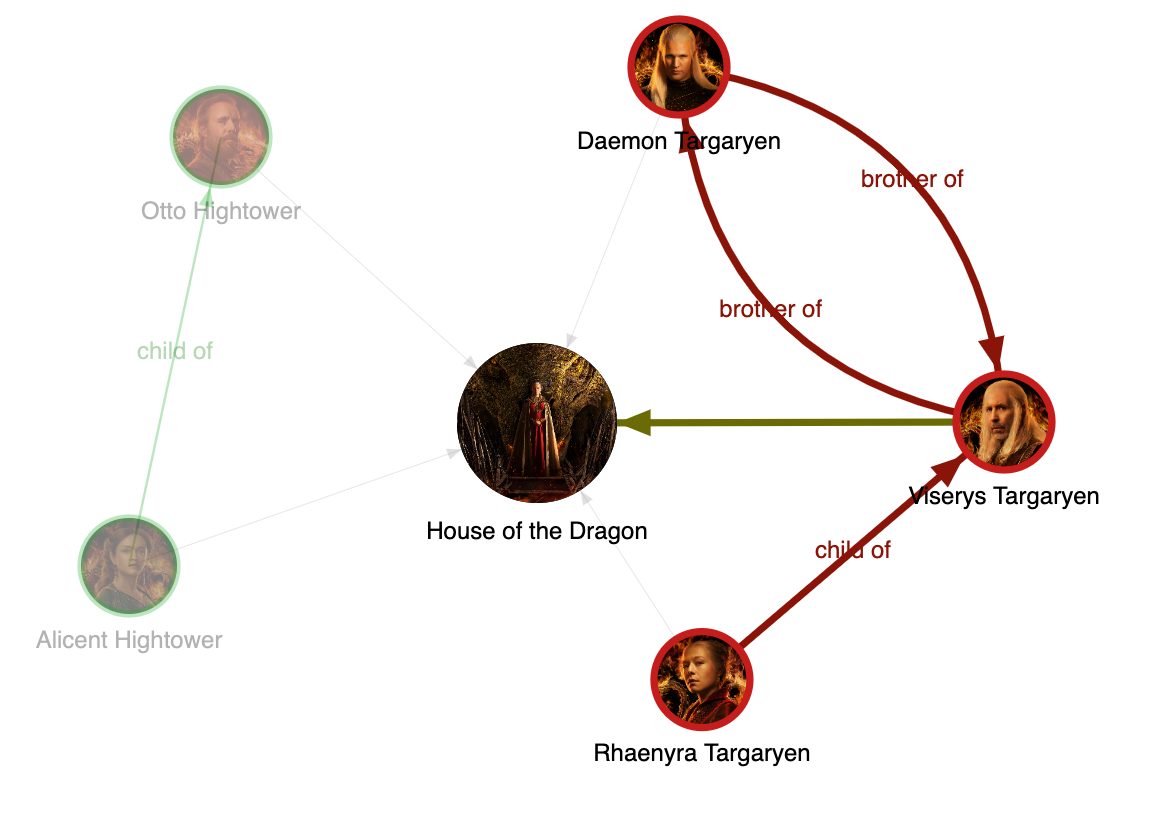
Orb comes with a default style in which nodes are blue and edges are gray. You can set your own default style for nodes and edges using the orb.data.setDefaultStyle function as shown in the example below.
Here are the styling rules we want to apply to the graph nodes and edges:
- Add an image from the HBO landing page for each node so we can easily see what each character looks like.
- Make the “Show” node larger than the “Person” node.
- Add a border around character nodes representing the family house (red for Targaryens, green for Hightowers).
- Color the edges between the character nodes in the family house color (red for Targaryens, green for Hightowers).
- Make the width of the edges with a label (text) larger than the ones without it.
To define a default style, you need to implement one or both callbacks in orb.data.setDefaultStyle: getNodeStyle and getEdgeStyle. Both callbacks should return an object containing node and edge style properties (color, size, width). Check out the list of all properties.
Copy the code below between the initialization of the Orb const orb = new Orb.Orb(container) and the set-up of the graph model orb.data.setup({ nodes, edges }). Check the complete code on the prepared GitHub GIST.
const imageUrlByNodeId = {
  1: "https://static.hbo.com/2022-06/house-of-the-dragon-ka-1920.jpg",
  2: "https://static.hbo.com/2022-05/house-of-the-dragon-character-rhaenyra-512x512_0.jpg?w=512",
  3: "https://static.hbo.com/2022-05/house-of-the-dragon-character-daemon-512x512.jpg?w=512",
  4: "https://static.hbo.com/2022-05/house-of-the-dragon-character-viserys-512x512_0.jpg?w=512",
  5: "https://static.hbo.com/2022-05/house-of-the-dragon-character-otto-512x512.jpg?w=512",
  6: "https://static.hbo.com/2022-05/house-of-the-dragon-character-alicent-512x512_2.jpg?w=512",
};
const colorByFamily = {
  Targaryen: "#c51c1c",
  Hightower: "#1ead2a",
};

// Set default style for new nodes and new edges
orb.data.setDefaultStyle({
  getNodeStyle(node) {
    const imageUrl = imageUrlByNodeId[node.id];
    // Shared style properties for all the nodes
    const commonProperties = {
      size: 10,
      fontSize: 3,
      imageUrl,
      label: node.data.name,
    };

    // Specific style properties for nodes where ".type = 'Person'"
    if (node.data.type === "Person") {
      return {
        ...commonProperties,
        // Border color will be the color of the family
        borderColor: colorByFamily[node.data.family],
        borderWidth: 0.9,
        size: 6,
      };
    }

    return commonProperties;
  },
  getEdgeStyle(edge) {
    // Using Orb.Color to easily generate darker colors below
    const familyColor = new Orb.Color(
      colorByFamily[edge.endNode.data.family] ?? "#999999"
    );
    return {
      color: familyColor,
      colorHover: familyColor.getDarkerColor(),
      colorSelected: familyColor.getDarkerColor(),
      fontSize: 3,
      fontColor: familyColor.getDarkerColor(),
      // Edges will "label" property will have 3x larger width
      width: edge.data.label ? 0.3 : 0.1,
      widthHover: 0.9,
      widthSelected: 0.9,
      label: edge.data.label,
    };
  },
});
Save the file, open it in a browser, and you will see a custom-styled graph like this:

Handle graph events
Orb doesn’t only do what it's told. It also offers events you can subscribe to in order to trigger an action. Check out the full list of events the Orb emits.
The example below shows simple events where we listen for node clicks, node mouse hovers, and edge clicks. The console output is logged on each event.
Copy the code anywhere below the initialization of the Orb. Check the complete code on the prepared GitHub GIST.
orb.events.on("node-click", (event) => {
  console.log("Event: node-click", event);
});

orb.events.on("node-hover", (event) => {
  console.log("Event: node-hover", event);
});

orb.events.on("edge-click", (event) => {
  console.log("Event: edge-click", event);
});
Just like before, save the file and open it in a browser. Open the developer console to see all the click and hover events:
Handle graph data changes
All the previous examples had a static graph model. Orb offers a way to handle graph changes with two additional functions:
orb.data.merge- Update (via unique ID) or insert new nodes and/or edges.orb.data.remove- Remove nodes and/or edges by unique IDs.
In the example below, we use both functions:
- On edge click, the edge will be removed with
orb.data.remove. - On node click, if it is a node character, the node will be removed with
orb.data.remove. - On node click, if it is a main “Show” node, all the removed nodes and edges will be added again with
orb.data.merge.
Along with the graph changes on node and edge click events, we also changed the view settings with orb.view.setSettings to:
- Enable the physics which makes the graph alive because of active node simulation and positioning on any event (e.g. node drag).
- Disable the context alpha, which disables transparency of unselected and not hovered nodes and edges.
Copy the code anywhere below the initialization of the Orb. Check the complete code on the prepared GitHub GIST.
// Change view settings to enable the physics (graph is more alive), and to
// disable transparency of unselected/not hovered nodes/edges
orb.view.setSettings({
  simulation: {
    isPhysicsEnabled: true,
  },
  render: {
    contextAlphaOnEventIsEnabled: false,
  },
});

orb.events.on("node-click", (event) => {
  if (event.node.data.type === "Show") {
    // If it is a central "Show" node, we want to return all the nodes and
    // edges - we use merge
    orb.data.merge({ nodes, edges });
  } else {
    // Otherwise, remove the clicked node from the orb
    orb.data.remove({ nodeIds: [event.node.id] });
  }
  orb.view.render();
});

orb.events.on("edge-click", (event) => {
  // On edge click, we want to remove the clicked edge
  orb.data.remove({ edgeIds: [event.edge.id] });
  orb.view.render();
});
Save the file, open it in a browser and interact with the graph by clicking on nodes and edges:
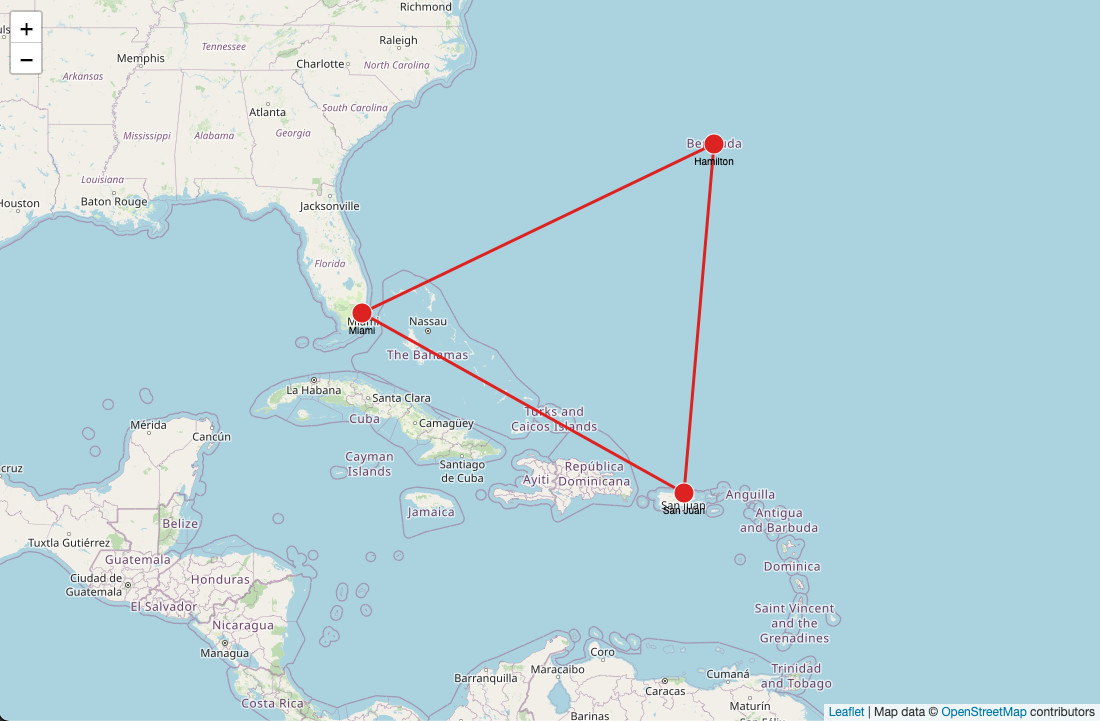
Render a graph with a map background
Now, something completely different. Let’s move on from the TV show House of the Dragon and render a graph on top of a map background. Orb currently offers two different views: DefaultView and MapView. DefaultView was used in the examples above: graph on a blank canvas. MapView additionally uses a Leaflet library to draw map tiles as the background of the graph.
To start with the MapView make sure to add the following CSS to the HTML:
<link
  rel="stylesheet"
  href="https://unpkg.com/leaflet@1.8.0/dist/leaflet.css"
/>
In the example below, you can see how MapView is initialized and used. The beauty of the Orb is that you can change views by changing only the code that defines the view. Everything else stays the same.
The view is changed with an orb.setView function where a new view needs to be initialized. In terms of the MapView, the initialization requires a definition of the callback function getGeoPosition, which expects to receive a numeric latitude and longitude for each node. MapView doesn’t have a simulator to get node positions as DefaultView does, the user has to define where each node is on the map.
Check the complete code on the prepared GitHub GIST.
const container = document.getElementById("graph");

const nodes = [
  { id: "miami", label: "Miami", lat: 25.789106, lng: -80.226529 },
  { id: "sanjuan", label: "San Juan", lat: 18.4663188, lng: -66.1057427 },
  { id: "hamilton", label: "Hamilton", lat: 32.294887, lng: -64.78138 },
];
const edges = [
  { id: 0, start: "miami", end: "sanjuan" },
  { id: 1, start: "sanjuan", end: "hamilton" },
  { id: 2, start: "hamilton", end: "miami" },
];

const orb = new Orb.Orb(container);
orb.setView(
  (context) =>
    new Orb.MapView(context, {
      getGeoPosition: (node) => ({ lat: node.data.lat, lng: node.data.lng }),
    })
);

// Assign a default style
orb.data.setDefaultStyle({
  getNodeStyle(node) {
    return {
      borderColor: "#FFFFFF",
      borderWidth: 1,
      color: "#DD2222",
      fontSize: 10,
      label: node.data.label,
      size: 10,
    };
  },
  getEdgeStyle() {
    return {
      arrowSize: 0,
      color: "#DD2222",
      width: 3,
    };
  },
});

// Initialize nodes and edges
orb.data.setup({ nodes, edges });

// Render and recenter the view
orb.view.render(() => {
  orb.view.recenter();
});
Copy the above code within the <script> tags, save the file, and open it in a browser. You will see a graph of a Bermuda triangle on the map:
Check it out and contribute
Even though it started as an internal tool used in Memgraph Playground and Memgraph Lab, it is now open-source, and you can use it in your graph visualization journeys. If you are curious about under-the-hood architecture, check the blog post about how we created Orb and why you shouldn’t.
Also, feel free to contribute to the Orb! Or at least give a star to the repo because we will add a bunch of cool future updates.