You Want a Fast, Easy-To-Use, and Popular Graph Visualization Tool? Pick Two!
In our pursuit of creating the go-to platform for graph development, we researched existing graph visualization libraries since our old Memgraph Lab implementation struggled with performance issues.
There are a lot of visualization options out there. Some have a very wide use case, others are popular but out of date, while the rest have performance issues or provide a terrible developer experience. The main focus of our research was JavaScript libraries since we were looking for a tool to integrate into our ecosystem. There are more amazing standalone projects and commercial products such as Graphistry that do not fit our use case and are out of the scope of this research.
In this blog post, we first outline the focus points of our research, in other words, which requirements the library must meet to satisfy our demands. Then we present contenders that made it to the final cut. We highlight their pros and cons and, finally, pit them against each other in a battle of benchmarks.
Requirements
We already used a graph visualization library in our previous Memgraph Lab implementation, so we knew what we were looking for this time around.
Popularity and maintenance
The library in question needs to be popular and maintained. This was a key requirement since our existing Memgraph Lab implementation relied on a not-so-recently deprecated library - Vis. And although a passionate community still supports it, we preferred an up-to-date library with official support from the original creators. We measured the popularity by GitHub stars, npm weekly downloads, and how long ago was the latest publish date.
Ease of use
Ideally, the library has to be easy to use to shorten our development time. To estimate this, we judged the contenders’ documentation on a subjective scale from 1 to 5.
Speed and multithreading capabilities
It would be perfect if the library were fast, but the multithreading capabilities were even more important. In web technologies, multithreading is done via WebWorkers. For them to work, the most computationally expensive operations mustn't depend on the DOM (Document Object Model), because WebWorkers don’t have access to the browser window reference, so any library that depends on that won’t perform well.
Styling
The library needs to have a flexible styling system where we can decorate graph properties such as node and edge shapes, colors, sizes, etc.
In our previous Memgraph Lab implementation, we developed a graph styling language called GSS (Graph Style Script) How we integrated custom CSS-like language to style graphs, which is similar to CSS but provides more programming capabilities through directives and functions. It was important to us that the library could easily implement the GSS specification.
Graph visualization landscape overview
You can get a high-level overview of our research findings in the table below. Since some of these libraries are modular, we also decided to include their parent repositories. For example, you can notice that Vis has long been deprecated, but vis-network is still updated by the community. D3-force is a part of D3, but you can notice that although many projects depend on it, the library by itself isn’t as popular as its parent package. SigmaJS uses Graphology for its data modeling, so we decided to include both since Graphology serves a similar purpose as d3-force.
| GitHub stars | Weekly downloads | Latest version / latest publish date | Documentation | Ease of use | Rendering / styling capabilities | Multithreading | |
|---|---|---|---|---|---|---|---|
| Vis | 7.9k | 34k | 4.21.0-EOL / 3 years ago deprecated | 5 | 5 | 5 | no |
| vis-network | 2.2k | 70k | 9.1.2 / 5 months | 5 | 5 | 5 | no |
| D3.js | 103k | 1.9M | 7.6.1 / 2 months | 5 | 3 | 1 | yes |
| d3-force | 1.4k | 2.2M | 3.0.0 / 1 year ago | 5 | 3 | 1 | yes |
| SigmaJS | 10.1k | 3.5k | 2.3.1 / 3 months | 2 | 4 | 5 | yes |
| Graphology | 718 | ~70k | 6 months | 5 | 4 | 1 | yes |
| VivaGraphJS | 3.5k | 89 | 3 years | 4 | 4 | 5 | no |
| Cytoscape.js | 8.7k | ~65k | 3.22.1 / 2 months | 5 | 4 | 5 | no |
| NeoVis.js | 1.2k | 500 | 2.0.0 / 2 months | 4 | 5 | 5 | ? |
| Cosmos | 182 | - | 1.0.0 / 2 months | 5 | 5 | 3 | yes |
That is how we ended up with three main candidates - VisJS, D3, and SigmaJS.
VisJS
A very popular, easy-to-use tool with rich documentation that provides a lot of graph visualization options through the vis-network repository. Our old Memgraph Lab used Vis to simulate and render graph results. What we liked the most was the powerful graph styling options that the library provides.
The problem is that the library is tightly coupled, and it’s hard to separate the physics computation simulation from the visual rendering engine. This is a problem in a WebWorker environment, which doesn’t have access to the window object. Enormous issues also arise when trying to cram a big graph into Vis. Simulating and rendering such a graph takes ages and what’s worse - blocks the main thread which results in a terrible user experience.
Sadly, it seems that the library has run its course and is mostly deprecated. You can read about it more in this Issue that was posted back in 2019. But, the community is still keeping it alive through libraries such as vis-network, vis-timeline, etc.
D3
D3.js is the gold standard of visualization libraries. Chances are you already had a run-in with it if you introduced any charts or visuals in your application.
The strength of D3 lies in its modularity. It’s very cleanly segmented into several repositories, which, when combined, form D3 as we know it.
One of the drawbacks is that it requires a pretty steep learning curve. The library is very powerful but you’d have to invest a decent amount of time in wrapping your head around its concepts and getting started with it. It doesn’t help that there are 7 major versions and although there is a good amount of documentation, you’re never sure which version you are reading.
Another drawback is that D3 by itself doesn’t provide any out-of-the-box graph visualization capabilities if you want to use the HTML5 Canvas API. You have to do the drawings manually.
SigmaJS
Another candidate is SigmaJS - a powerful tool with impressive performance. It uses WebGL in its visualization which is by far the fastest option but introduces a layer of complexity. While SigmaJS focuses on visualization, it relies on the Graphology library for graph layout and simulation calculation. Graphology is a well-documented library, although somewhat less popular than D3.
The big issue for us with SigmaJS is the lack of documentation. While it is written in TypeScript and this does help development through types, there doesn’t seem to be a proper reference guide. It does, however, have good examples written on the documentation page.
Others
Here we list the honorable mentions. All of these are amazing projects, but for one reason or another, they didn’t make the final cut.
- VivagraphJS - A seemingly good option with WebGL rendering capabilities. We didn’t dive deeper because of the low number of weekly downloads and prolonged publish dates. We chose to consider SigmaJS instead.
- Cytoscape - An amazing platform that was originally envisioned for visualizing molecular interaction networks and biological pathways, but has grown to be so much more than that. The reason it doesn’t work for us is that its DOM-dependant architecture doesn’t support multithreading which is a big impact on responsiveness.
- NeoVis - A fork of the Vis library adapted to Neo4j. We didn’t find any documentation regarding WebWorker support but were highly doubtful it supports multithreading since it’s an extension of vis-network. This, along with the low number of weekly downloads steered us away from it.
- Cosmos - The most recent contender and a late entry on our list. In our initial research, Cosmos wasn’t even out yet so we didn’t get a chance to properly assess the library. What’s unique about Cosmos is the blazing speed it achieves. It can easily render more than a hundred thousand nodes. While other libraries use WebGL for faster rendering, Cosmos one-ups the competition by performing simulation calculations on the GPU as well. The documentation and API look great. But, one of our key requirements is styling. In that regard, Cosmos’ styling capabilities are limited. It enables modifying only basic properties such as node sizes, edge widths, colors, etc.
Commercial and standalone products
Besides the mentioned libraries, there are several amazing commercial projects, as well as standalone products. They do not fit our use case, but it would be a shame not to at least mention some of them.
- Graphistry - An extremely powerful analytics platform that can easily make sense of big data. It provides multiple integrations such as API embeddings and data science notebooks.
- Linkurious - A visualization platform that focuses on detecting and investigating complex criminal activity.
- Ogma - A commercial JavaScript library for visualizing and interacting with large-scale graphs. It was developed by Linkourious to replace Linkourious.js after it got deprecated.
- Gephi - A free and open-source graph visualization and exploration platform.
Benchmark setup
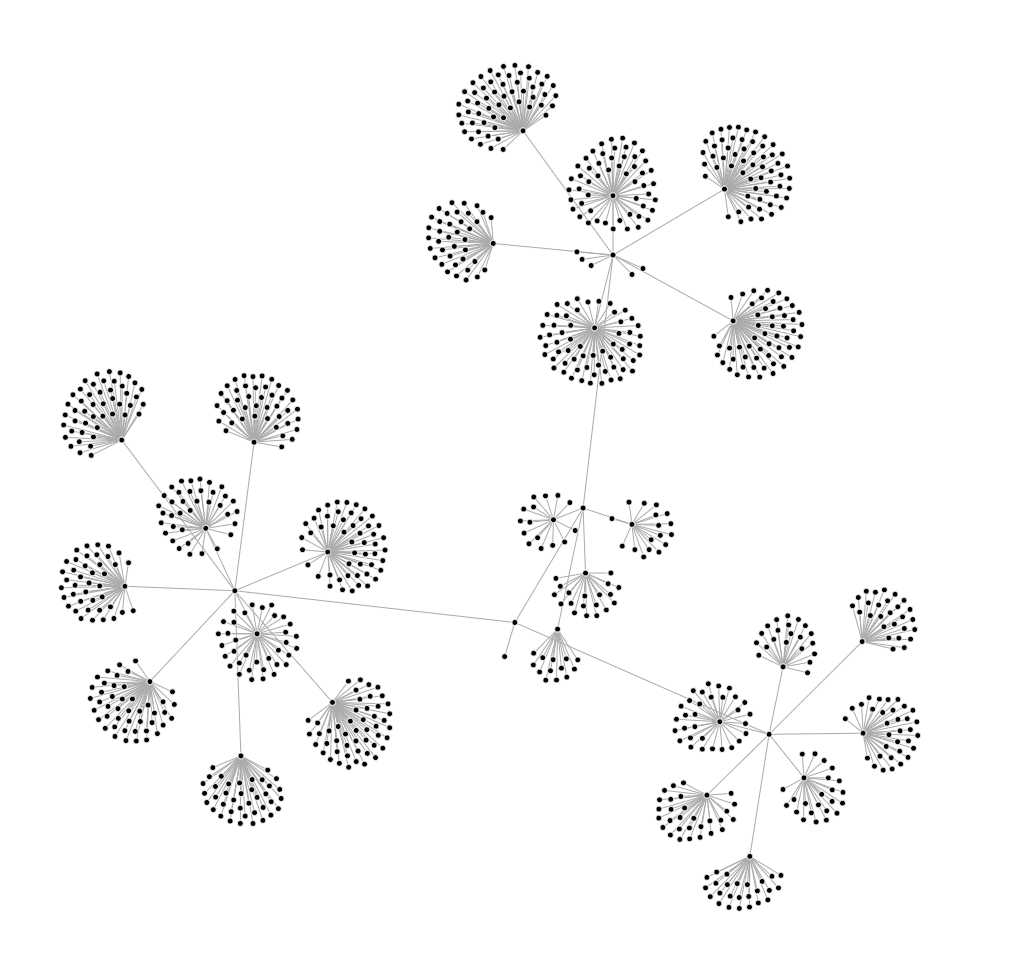
Now that we narrowed down our list of candidates to our final contenders: D3, Vis, and Sigma - it’s time for a challenge. Let’s see how they perform under pressure. This is what our benchmark graph looks like. It's a good sample because it has an equal number of nodes and edges and can scale easily.
You can generate such a graph with the following JavaScript code:
nodes = new Array(n);
edges = new Array(n);
for (let i = 0; i < n; i++) {
  nodes[i] = {
    id: i,
    label: `Node ${i}`,
  };
  edges[i] = {
    id: i,
    start: Math.floor(Math.sqrt(i)),
    end: i + 1,
  };
}
Using this little algorithm we generated graphs in 3 different sizes:
- Small (S) = 100 nodes + 100 edges
- Medium (M) = 1k nodes + 1k edges
- Large (L) = 10k nodes + 10k edges
We decided to test the following:
- Our old Vis-based Memgraph Lab
- Vis on canvas
- Vis on canvas optimized for big graphs
- D3 on canvas
- SigmaJS on WebGL
We didn’t bother to include any SVG solutions in our benchmark. This is because in our experience, rendering a large number of elements with SVG is several orders of magnitude slower than a canvas or WebGL-based engine. SVG excels at drawing a small number of large elements, where it performs even better than the HTML5 Canvas or WebGL. But that’s not our use case.
Benchmark results
Finally, we can take a look at the cold hard numbers. The table below shows the results of two tests. In the first three rows, we tested the total time of rendering each frame of animation until the graph converged to the final position. In the last three rows, we only render the final graph layout after the simulation engine finished its calculations.
| Setup | D3 (Canvas, standalone) | Vis (Canvas, standalone) | Vis (Canvas, standalone, Optimized for Big Graphs) | Old Memgraph Lab (Vis canvas) | SigmaJS (WebGL, standalone) |
|---|
| Render first 100 nodes, 100 edges | 0.4s | 2s | 2s | 3s | 1s | | 1k nodes, 1k edges | 3.2s | 1:14min | 45s | 1min 27s | 2s | |10k nodes, 10k edges | 27s | very long | 10.5min | very long | 5-10s | | Simulate first 100 nodes, 100 edges | 0.2s | 1.2s | 1s | 2s | instant | |1k nodes, 1k edges | 2s | 35s | 15s | 1min 15s | 2s | |10k nodes, 10k edges | 26s | ~15-20min | 7min | >20min | 15s |
Here we can see that Vis is the slowest of the bunch being an order of magnitude slower than the competitors. When optimized for large graphs it performed somewhat better, but not much when compared to the other two. The D3-based solution is in the middle of the pack, while the WebGL-based SigmaJS is considerably quicker in rendering bigger graphs. In some cases, our old Memgraph Lab implementation was sweating so much that we simply gave up and threw in the towel.
Our decision - enter the Orb
While the speed of SigmaJS was tempting, the lack of documentation and greater popularity of D3 steered us away from it. And although Sigma provides a flexible styling system, we have already developed a graph styling language called GSS in conjunction with Vis. Vis, besides being slow, lacked the multithreading capabilities which was a key requirement for us.
In the end, we decided to create our library called Orb by using the power of d3-force simulations and our own rendering engine, which uses parts of the Vis canvas implementation. The reasoning behind this was that it would be easier to do this than to adapt SigmaJS to fit our GSS specification. We also made Orb extensible and left space for a WebGL renderer in the future. You can read more about how we did this in our “Under the hood” blog post How to build a graph visualization engine and why you shouldn’t.
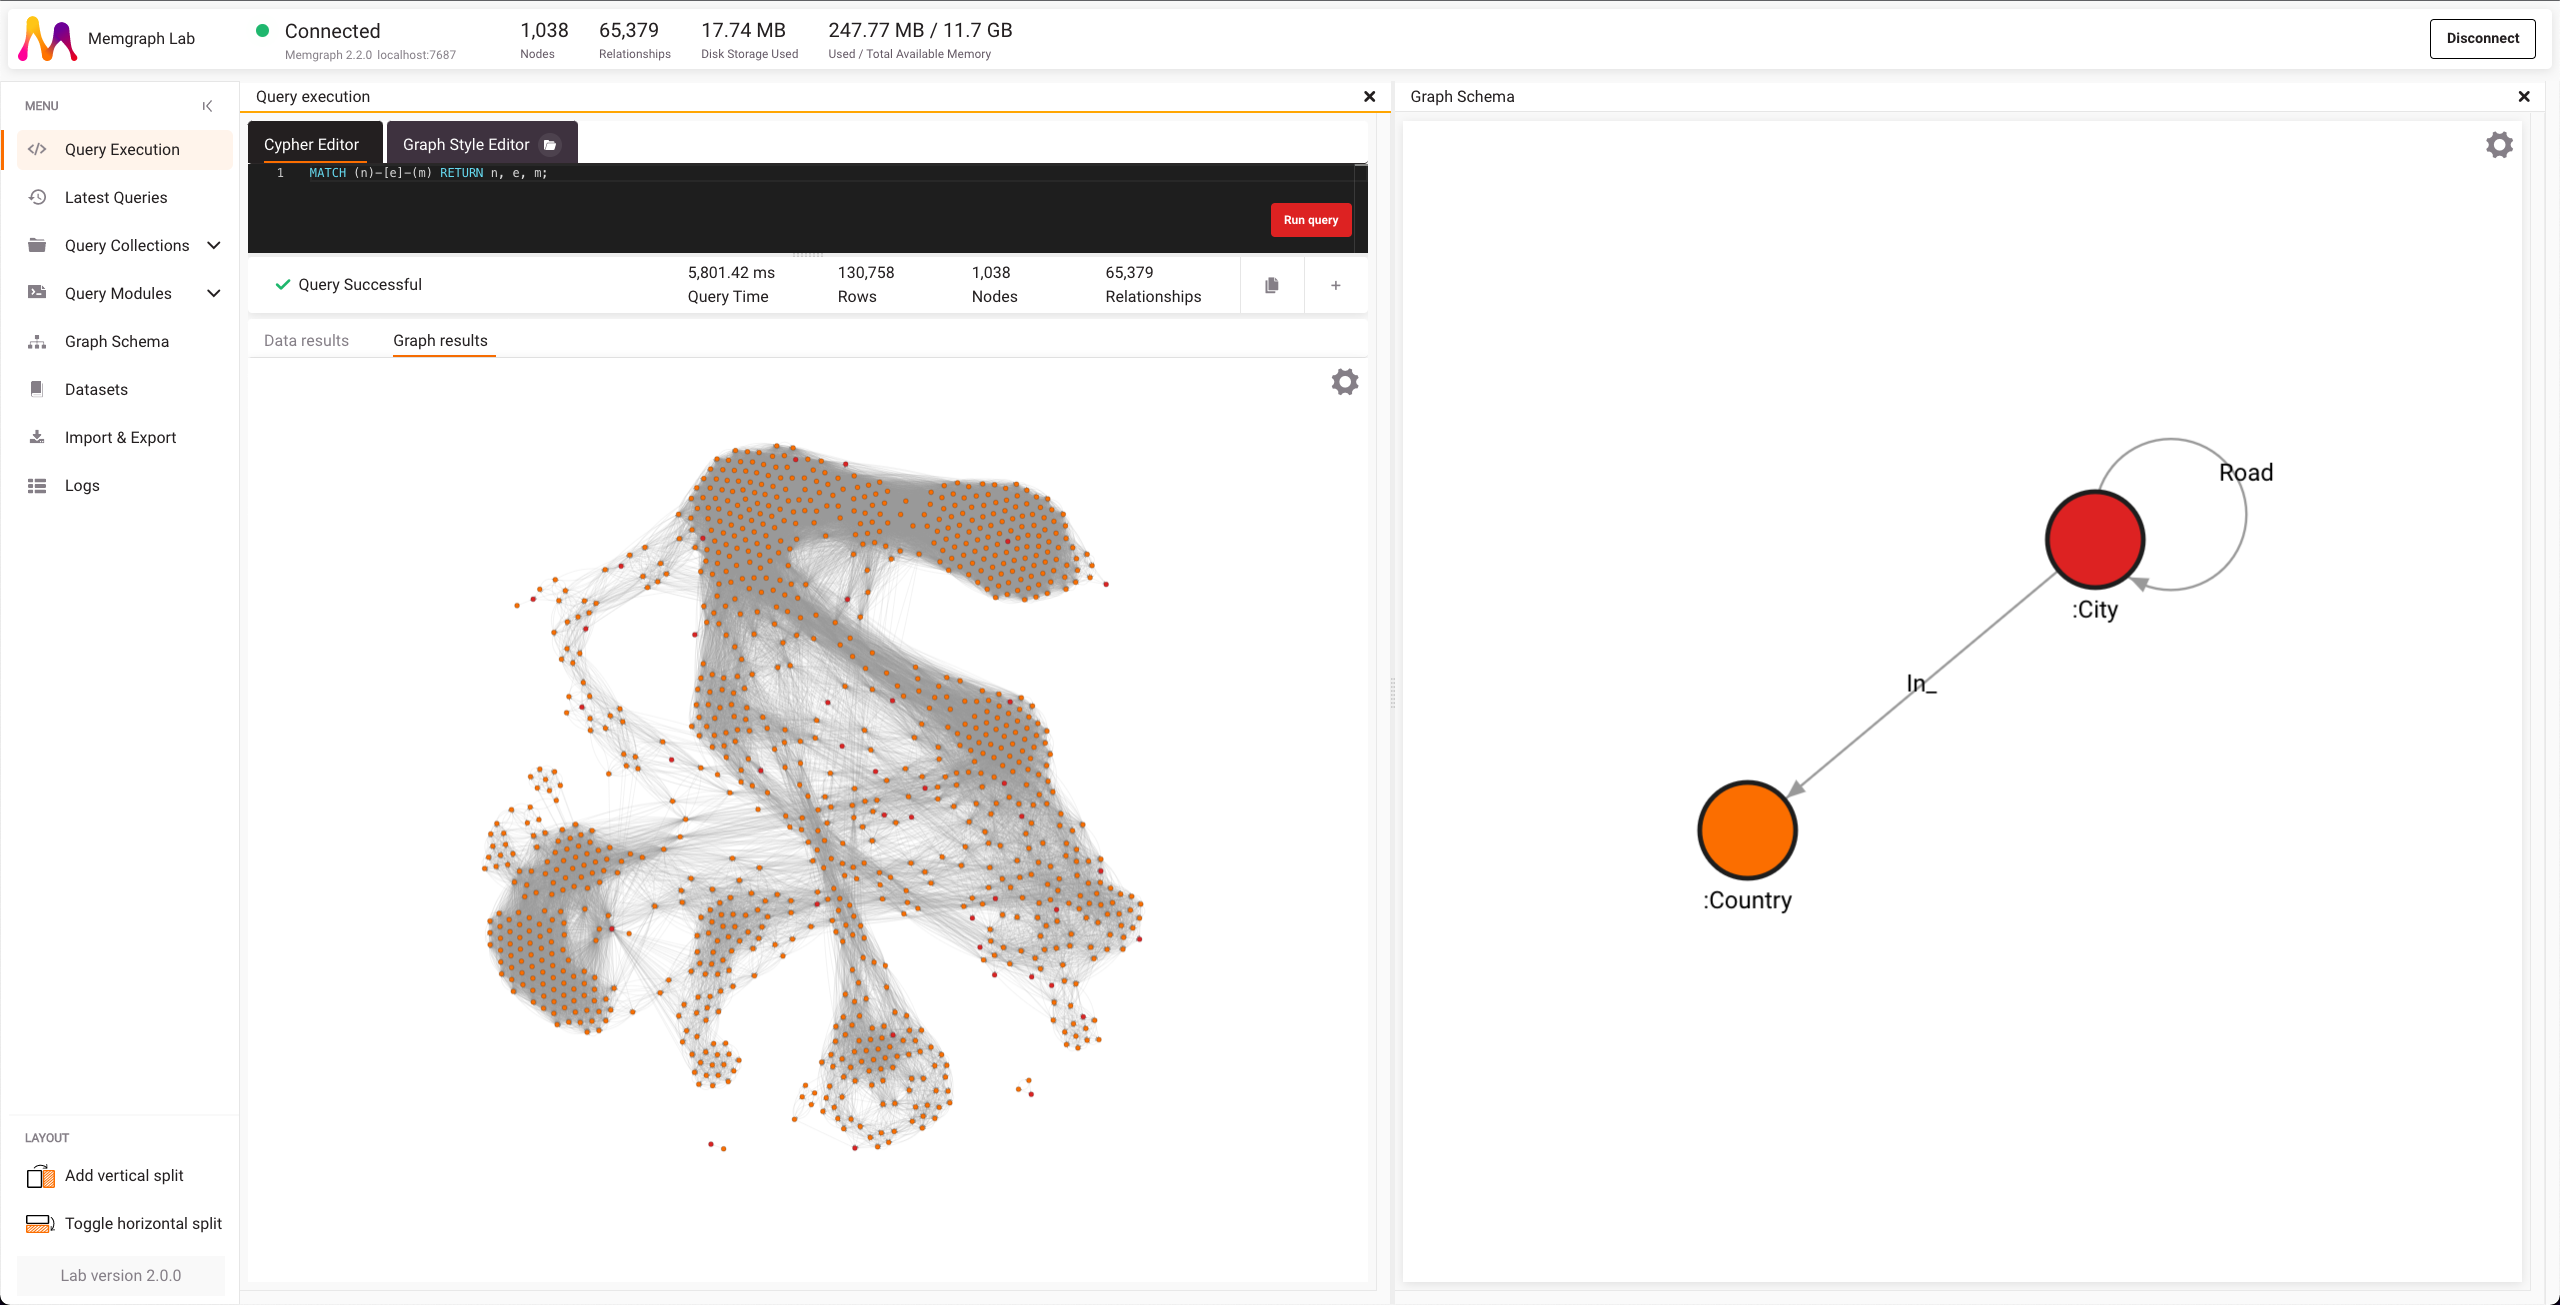
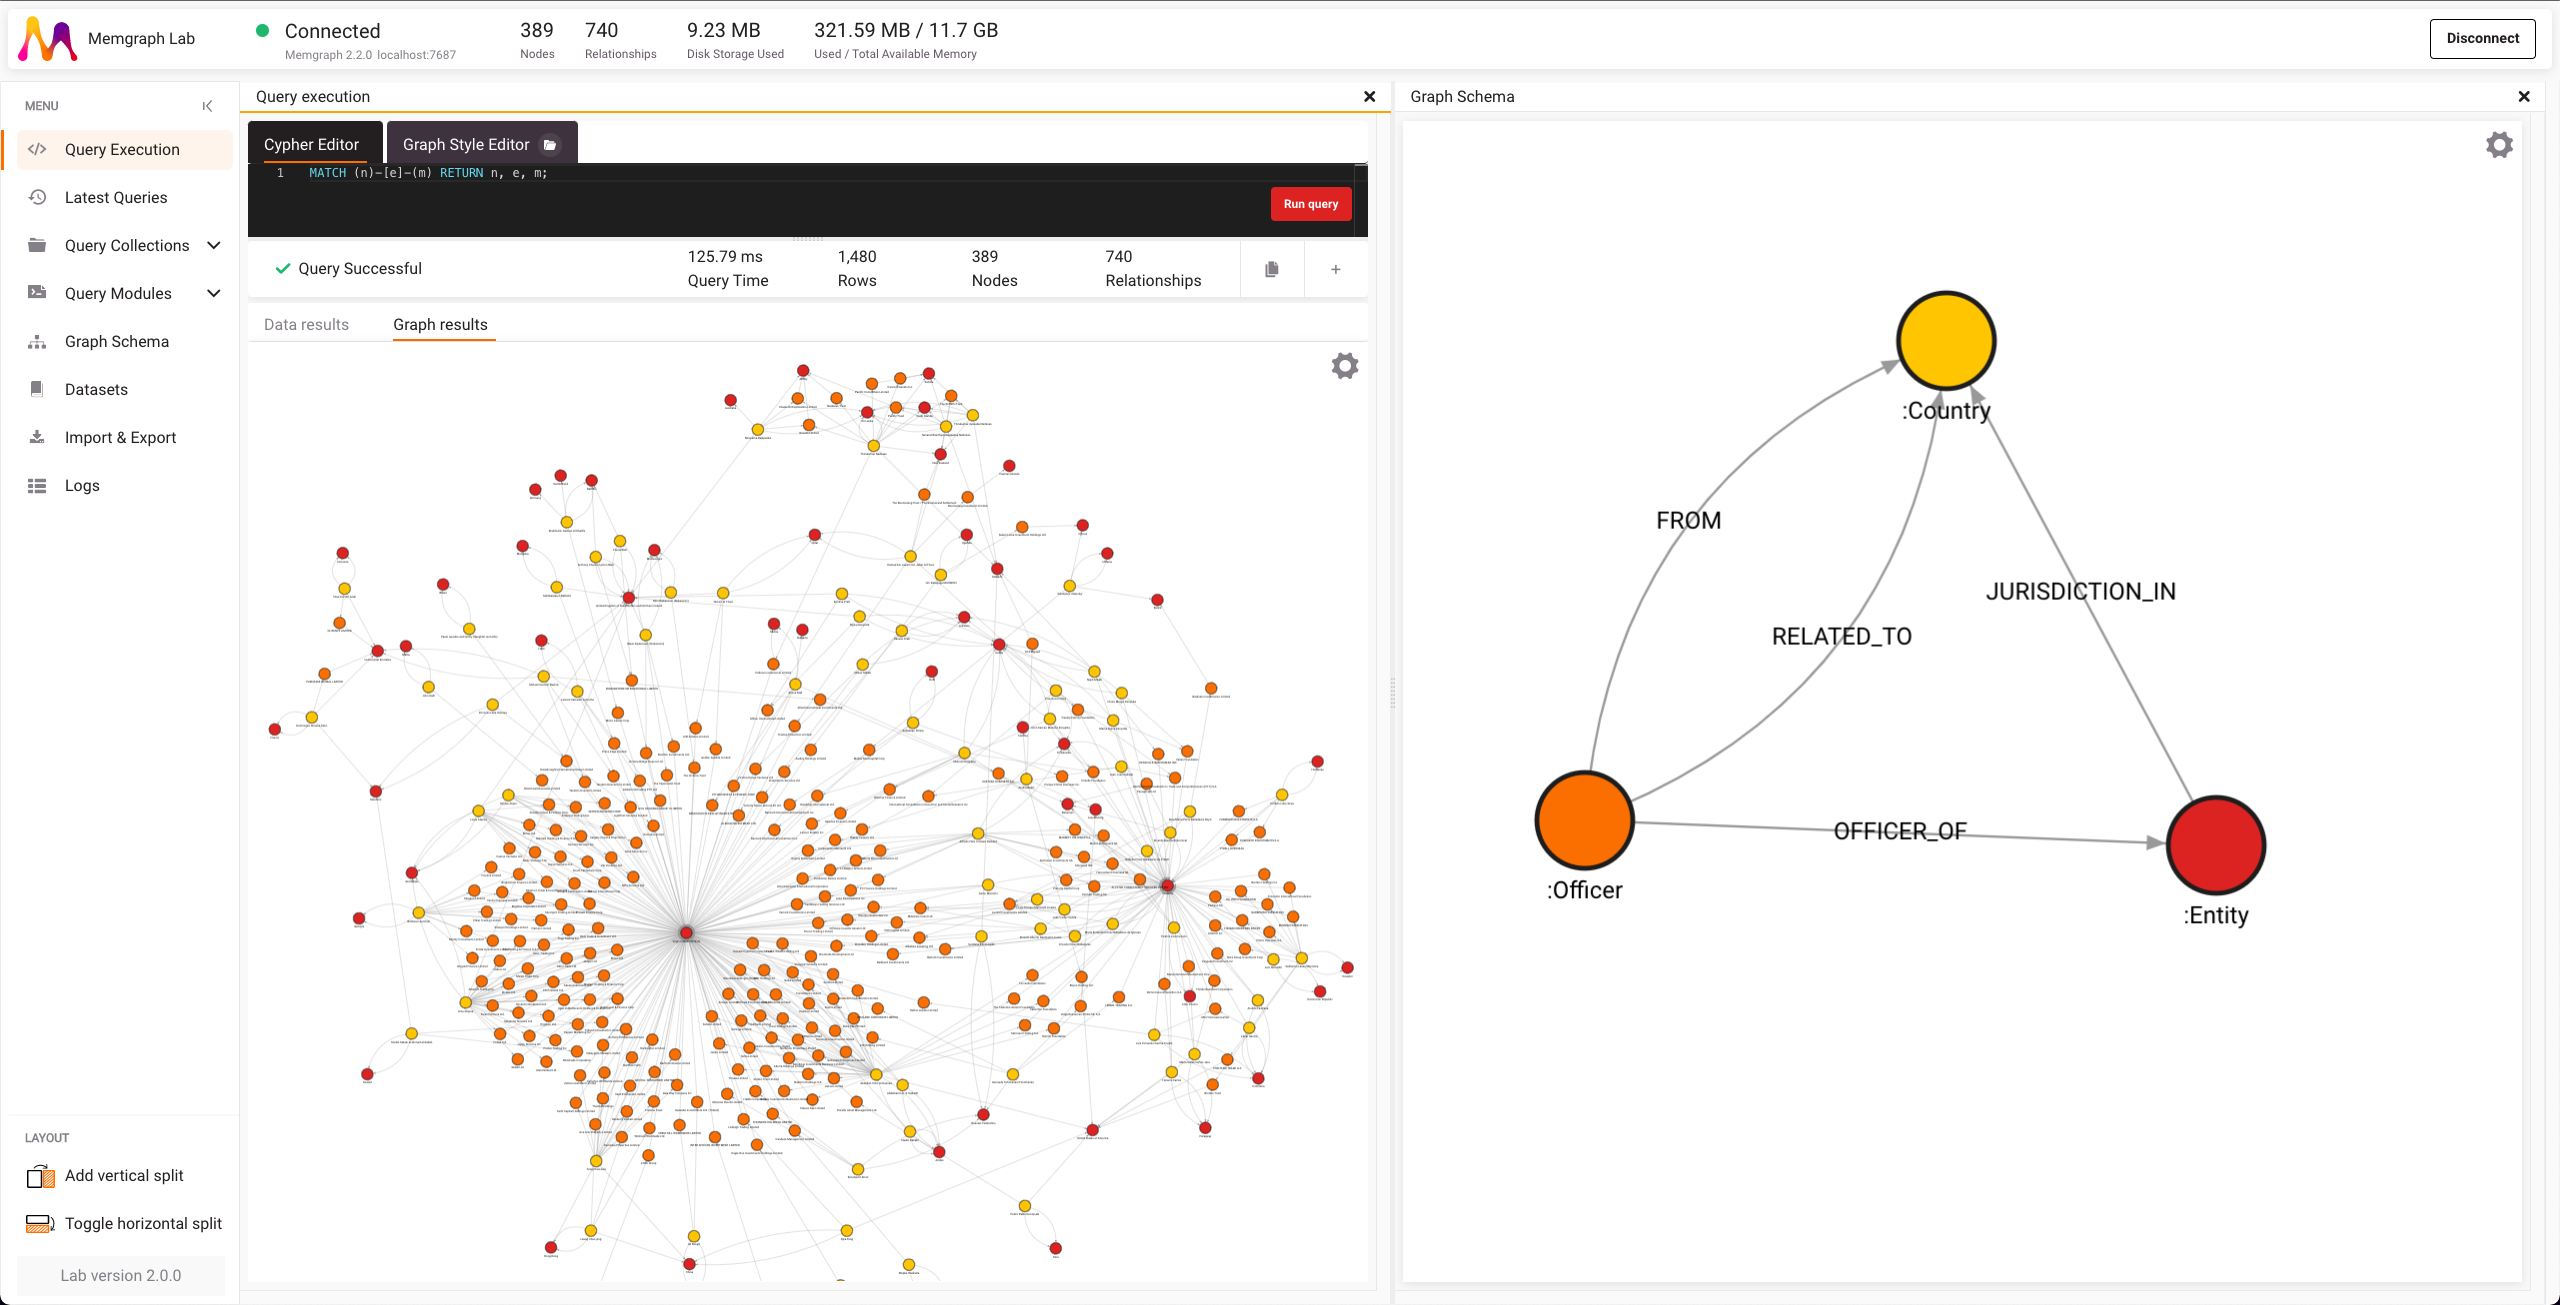
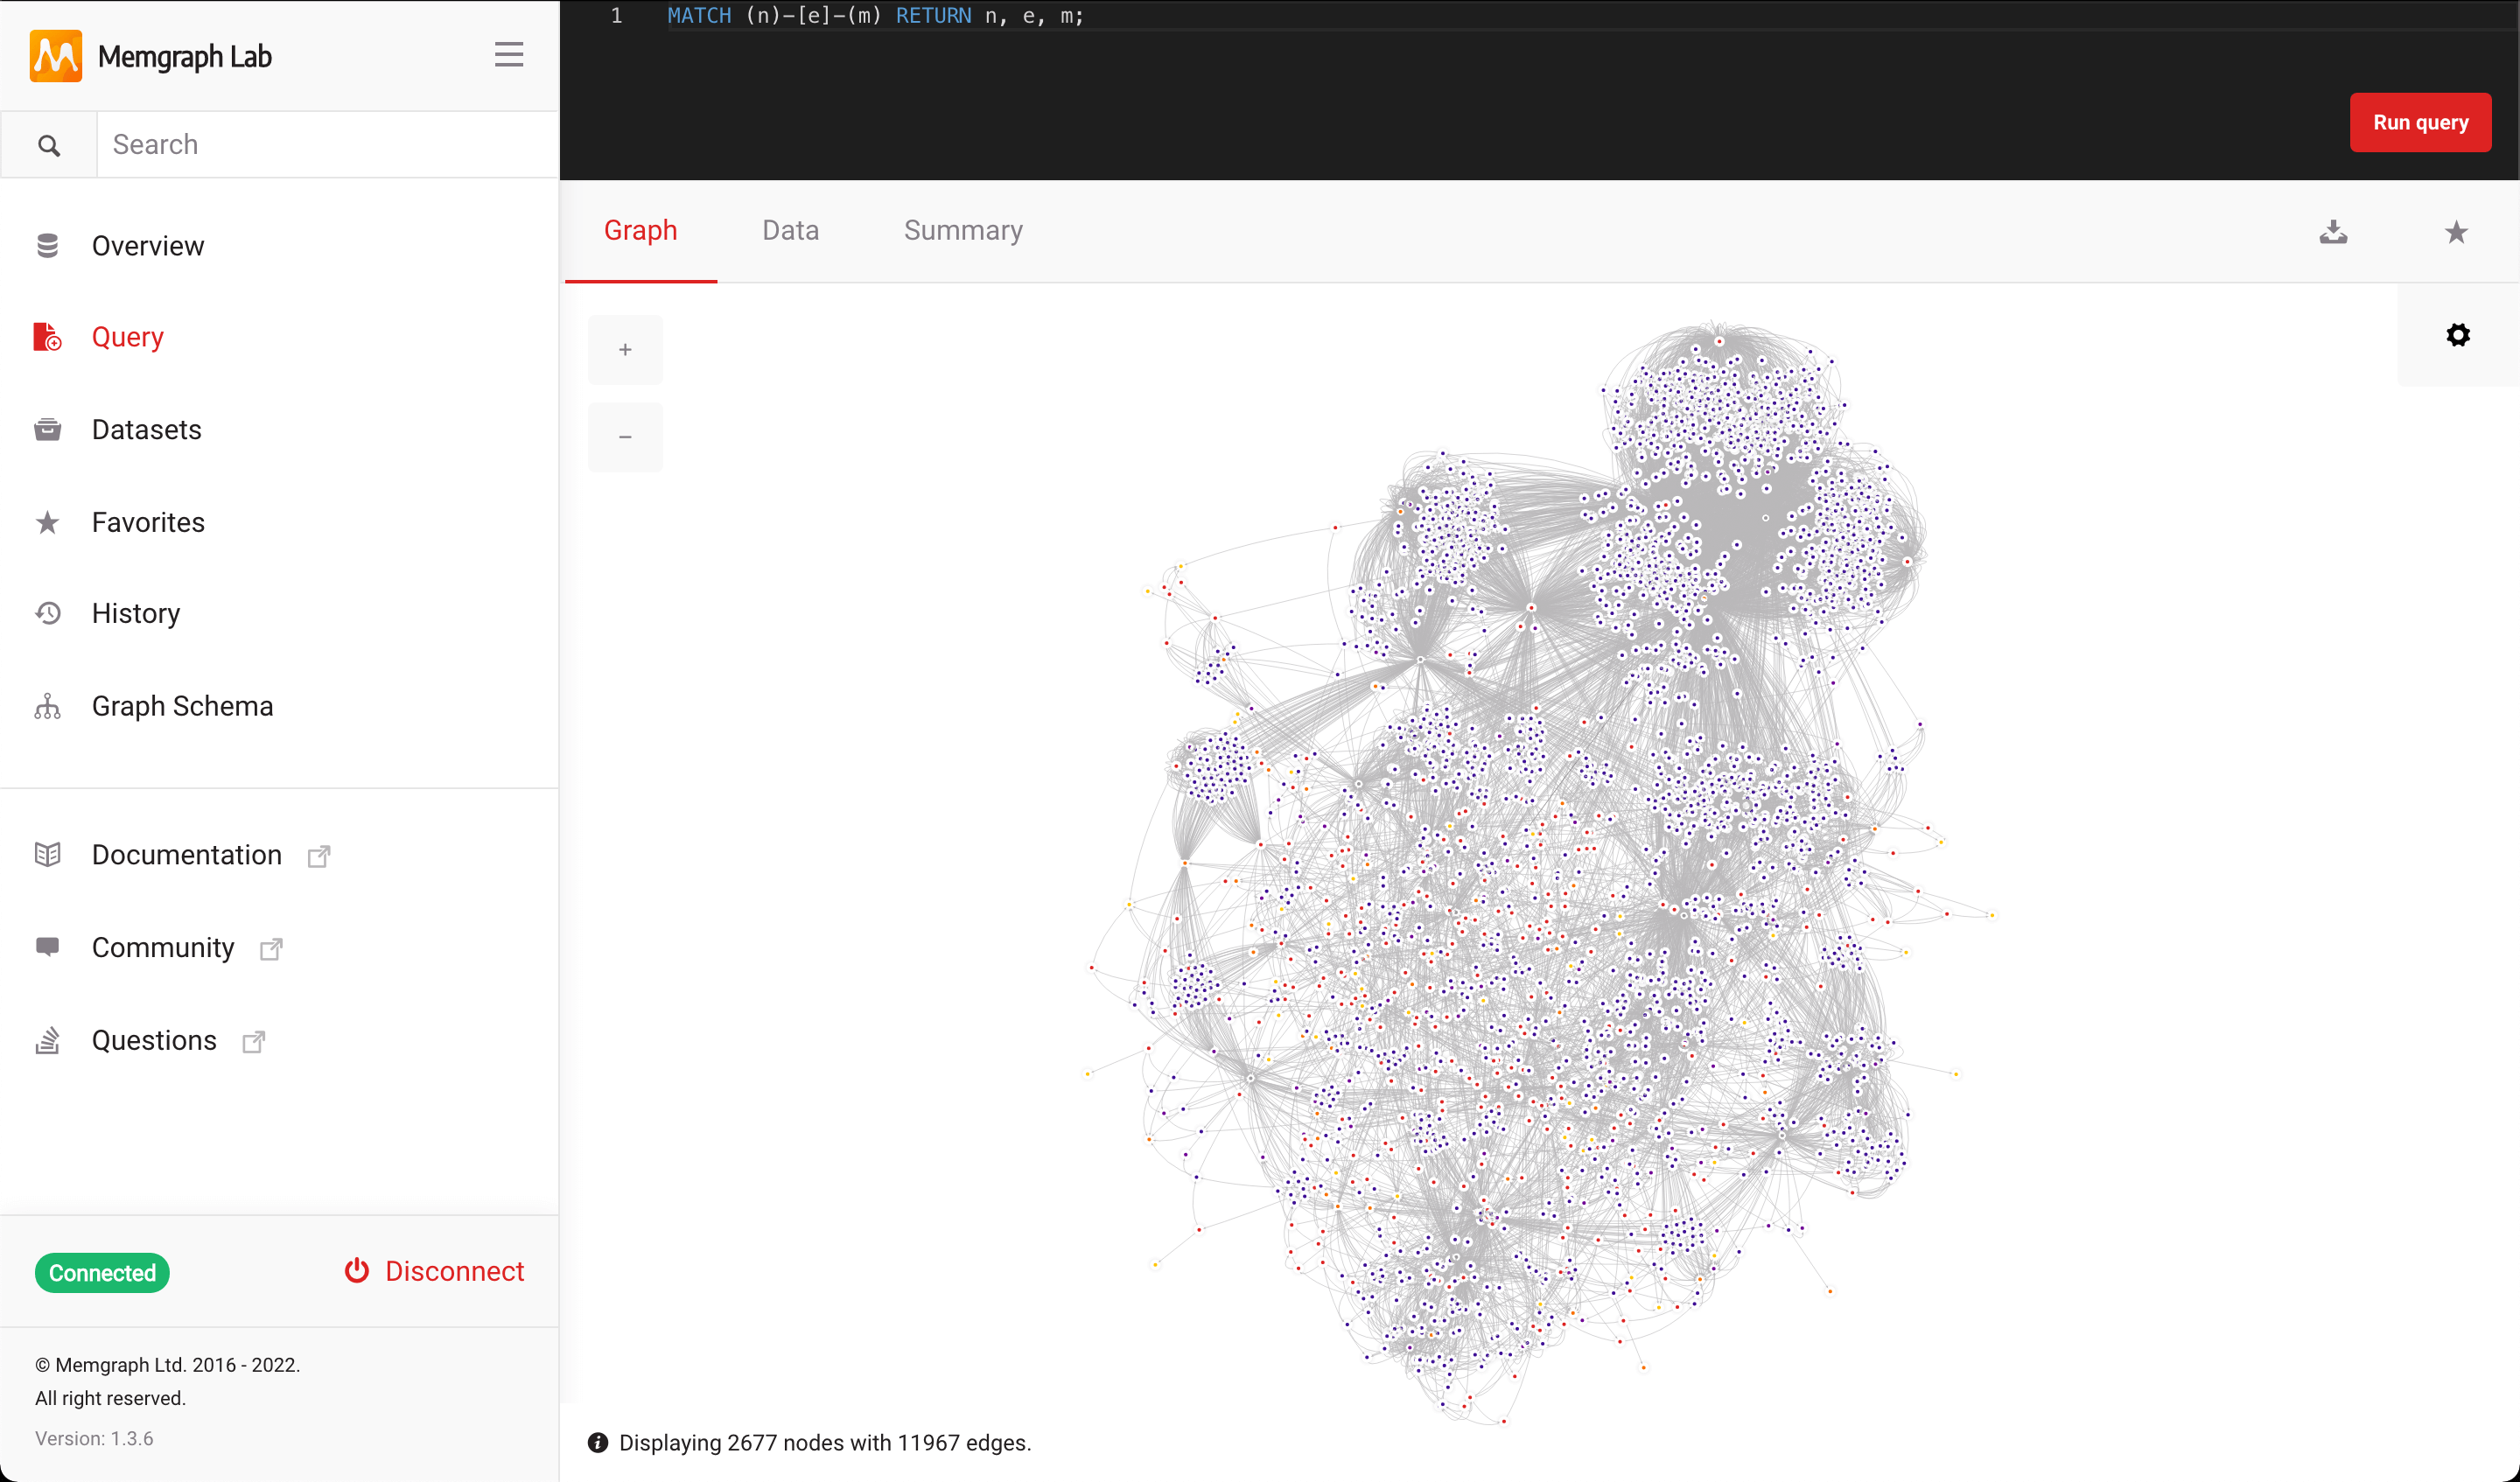
We tested our final implementation in a less artificial environment by integrating Orb into our new Memgraph Lab v2. We compared the results with our old Vis-based implementation. As seen below, on smaller graphs the Orb is 20x faster. On larger ones, it goes up to 40x faster. For some, we just didn’t have the patience to wait for the old implementation to finish, but we assume the Orb is 60-80x faster.
| Dataset | # of nodes | # of relationships | Old Lab | New Lab | Improvement |
|---|---|---|---|---|---|
| Game of Thrones | 3000 | 12000 | 10 min | 15 sec | 40x times faster |
| Pandora Papers | 400 | 700 | 50 sec | 3 sec | 20x times faster |
| Europe road network | 1000 | 60000 | Too much time | 20 sec |
What combo will it be - fast, easy-to-use, or popular?
It seems that there still doesn’t exist a go-to graph visualization library that satisfies all our needs.
While Vis is a popular, easy-to-use library with rich documentation that is still being maintained by the community, the original version is officially deprecated. Also, the problem with our old implementation of Memgraph Lab, which relied on Vis, is that it’s difficult to extract the computation algorithms from the visual rendering engine. The entire library relies on the DOM and it’s difficult to delegate the simulation calculations to a WebWorker. This’s why it was critical for our next implementation to separate the computationally expensive simulation algorithms from the visual rendering engine.
For the simulation part, our decision boiled down to two choices: D3 and Graphology. While Graphology provides good documentation and is very up-to-date, in the end, we decided to base our solution on D3 because of its popularity, documentation, and modularity. It is a reliable choice as it is by far the most popular offering on this list, as well as the gold standard in browser visualization technologies.
Regarding the rendering engine, the choice boiled down to the difference between SVG, HTML5 Canvas, and WebGL. SVG-based solutions work well for rendering a small number of large elements but are too slow for rendering a big graph that consists of a large number of small elements. While WebGL-based solutions provide the fastest rendering, it comes at the cost of a steeper learning curve and more difficult maintenance. But this isn’t the main reason we decided against it.
In our previous Vis-based implementation, we developed a graph styling language called GSS(Graph Style Script). This language enables us to style graphs in a fashion similar to CSS, but with additional programming options through directives.
Without this requirement, SigmaJS seems like a solid offering and a reasonable choice. Its fast WebGL-based engine also allows for flexible visuals, and although decently popular, the documentation isn’t as extensive as the alternatives. In the meantime, a new contender entered the ring. Cosmos is an extremely fast library that works great for big graphs. It does this by performing simulation calculations and visual rendering on the GPU. It has great documentation but lacks styling capabilities.
So in the end we chose to implement our own visual library where we have absolute control to implement the GSS specification. We used the HTML5 Canvas API to create our rendering engine which is partly derived from Vis. We did leave space for developing a WebGL version of our rendering engine by making it extensible and modular.
If you would like to read more about how the architecture of the Orb and how it works, check out the blog post How to build a graph visualization engine and why you shouldn’t