Vislet – Visualize Geographic Data in Memgraph Lab
TLDR; You have graph data that consists of nodes and edges. Nodes contain geographic data (lat, lng). Your goal is to visualize graph data on a world map in Memgraph Lab.
Introduction
In graph data visualization it's important to extract properties of nodes and edges and visualize them in a memorable way. When you derive new visual information people make more sense of your data. In Memgraph Lab, visualizing any graph data is possible. With a new style scripting language you can dynamically customize your visual output to your liking. What about geographic data? Currently, there is no proper way to make use of latitude and longitude coordinates of each node with a style scripting language. For example, distances between countries can't be shown visually and intuitively.
Example of such dataset – neighboring countries:
- each node is a country
- two countries are neighbors if an edge connects them
Geographic data makes sense only when you show it on a real-world map. Because of this, we created something specifically for visualizing both graph and geographic data in Memgraph Lab.
Vislet – a set of functions and event handlers that synchronize vis-network and Leaflet!
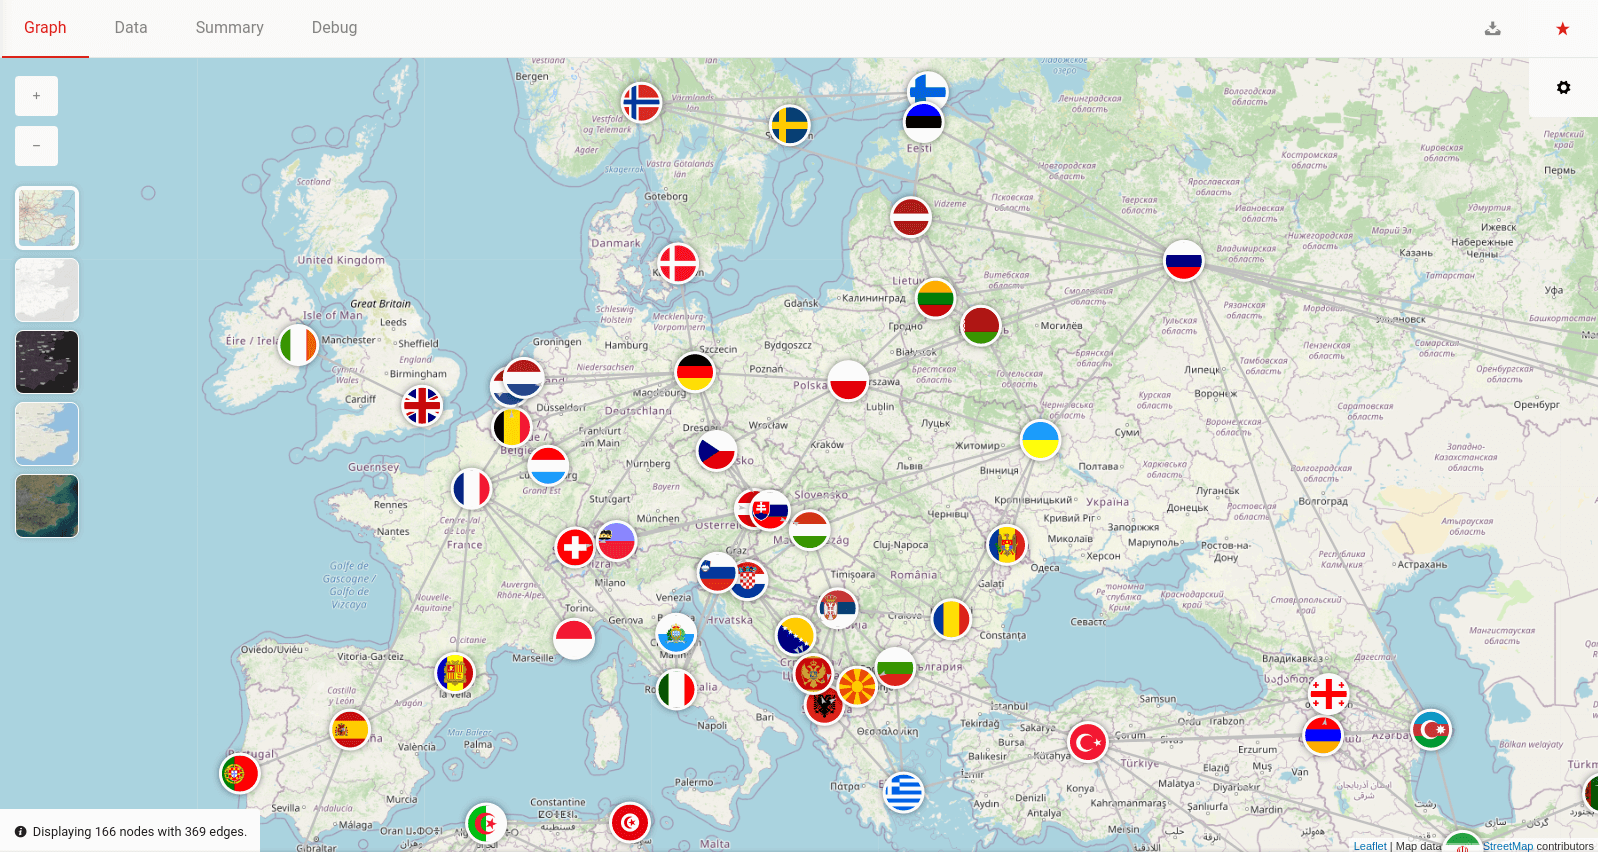
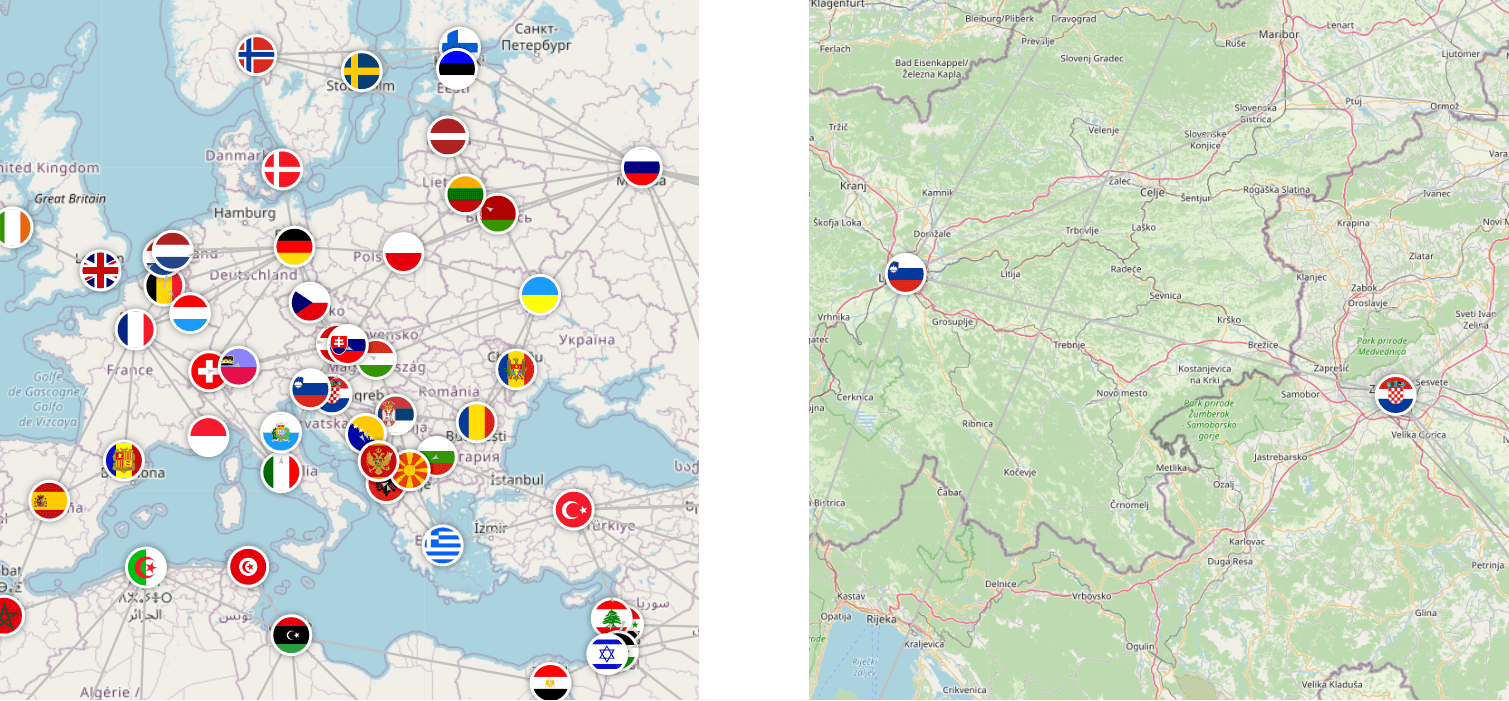
With Vislet, you can visualize a graph of neighboring countries in Europe:
How to use Vislet?
In Memgraph Lab, Vislet is automatically activated when it detects geographic data from the returned query. For now, if any of the returned nodes contain lat and lng numeric properties it is considered geographic data.
Example of a geographic node:
(node:City { name: "London", lat: 51.5074, lng: 0.1278 })
Importing dataset
For storing, manipulating, and creating graph data, you need a query language. Cypher is a query graph language used in Memgraph. With Cypher, you can create nodes (countries) and edges/relationships (neighboring countries) between nodes. If you have no experience with Cypher, check out Memgraph tutorials. In Memgraph, you can also import the existing graph dataset. Importing of a graph dataset is supported for multiple dataset formats such as CSV or Cypher queries. When loading different dataset formats, you can follow these guides.
In this tutorial, we will use Cypher queries to load data. To load data via Cypher queries into Memgraph, you can follow guide. Memgraph just executes all Cypher queries listed in the imported file.
Here you can find the dataset of neighboring countries in Cypherl format.
- Memgraph can be installed as a package or as a Docker image. Commands for importing the dataset will be different depending on how you installed Memgraph. No worries, both guides for dataset importing have explanations for each method.
Once you have successfully downloaded and imported the dataset into Memgraph:
- as a service, if you installed Memgraph as a package:
systemctl start memgraph
- as a Docker container, if you installed Memgraph as a Docker image:
docker run -p 7687:7687 -v mg_lib:/var/lib/memgraph -v mg_log:/var/log/memgraph -v mg_etc:/etc/memgraph memgraph
-
Open Memgraph Lab
-
Connect to running instance of Memgraph
- host should be
localhost - port stays the same (
7867)
- In the "Query" section of Memgraph Lab, run a query that returns all nodes connected with edges
MATCH (n)-[r]->(m) RETURN n,r,m
Vislet will then show returned geographic nodes in Memgraph Lab on the map on their respectful lat and lng positions:
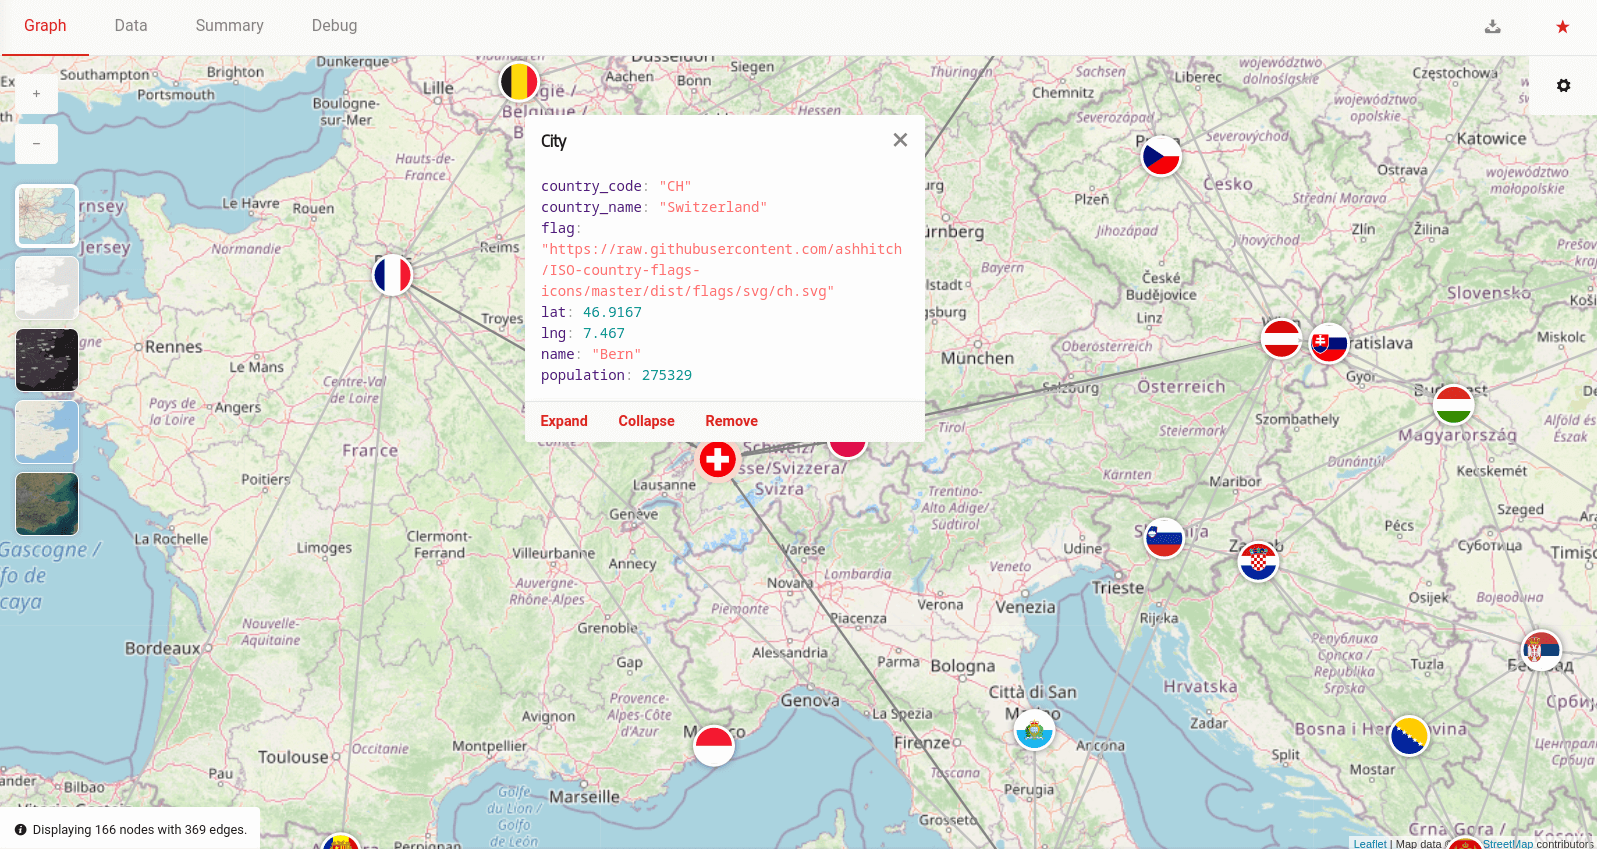
Clicking on the node to get more information as well as features such as expanding, collapsing and closing are still available in Vislet. Node dragging is disabled as nodes should stay on their lat and lng locations.
You can still use Memgraph Lab's style scripting language. In the image, lat and lng properties are added to the node's label while flag property is used for the node's image.
The info text is located on the bottom-left side of the graph. There, you can see how many nodes are shown on the map. Information is formatted like this: Displaying X out of Y nodes, where X stands for a number of nodes with lat and lng properties while Y is a total number of returned nodes. Result of subtraction Y-X is a number of nodes without valid lat and lng properties. Such information is helpful to figure out if all returned nodes are possible to be drawn on a map.
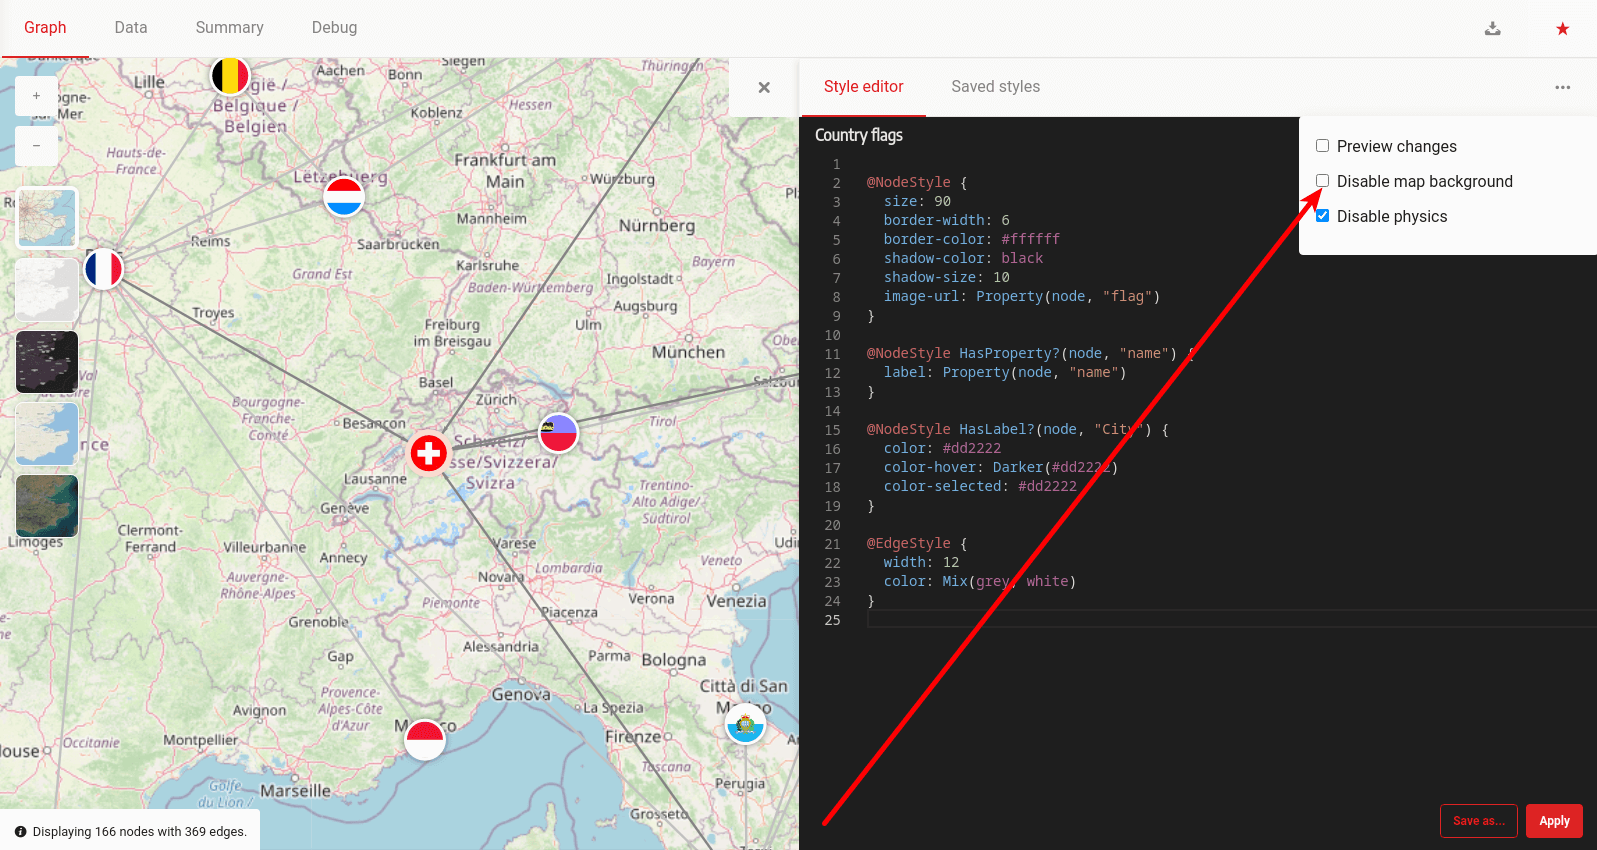
The map won't show nodes that don't contain lat and lng properties. You can toggle the map with the Disable map background button after opening options with the ••• button. After you turn the map off, Memgraph Lab will return and show all nodes, both geographic and non-geographic.
For Vislet, panning and zooming on the map aren't a problem. You can pan and zoom on the map while nodes and edges will pan and zoom accordingly. Visual properties (e.g. size of the node, width of the edge) are scaled accordingly when zoom event occurs. Constant adjusting of style's properties values, like size and width, won't be necessary. Once you create a style, it stays intact and works on every zoom level!
How does Vislet work?
In Memgraph Lab, Vislet combines two javascript libraries to visualize graph data on a map.
- vis-network – quickly visualize graph data. Examples and docs show you how to generate quick and good looking graphs. You can create a simple graph of neighboring countries using the dataset given above.
- Leaflet – use interactive maps. Leaflet allows you to display geographic data on the map and other custom layers. Quick start and docs both explain how to integrate a world map or a custom layer into your project. Circles, pins, markers and more can be used to visualize data.
vis-network and Leaflet map are rendered into their own HTML div elements:
<div id="map" style="z-index: 1"></div>
<div id="network" style="z-index: 2"></div>
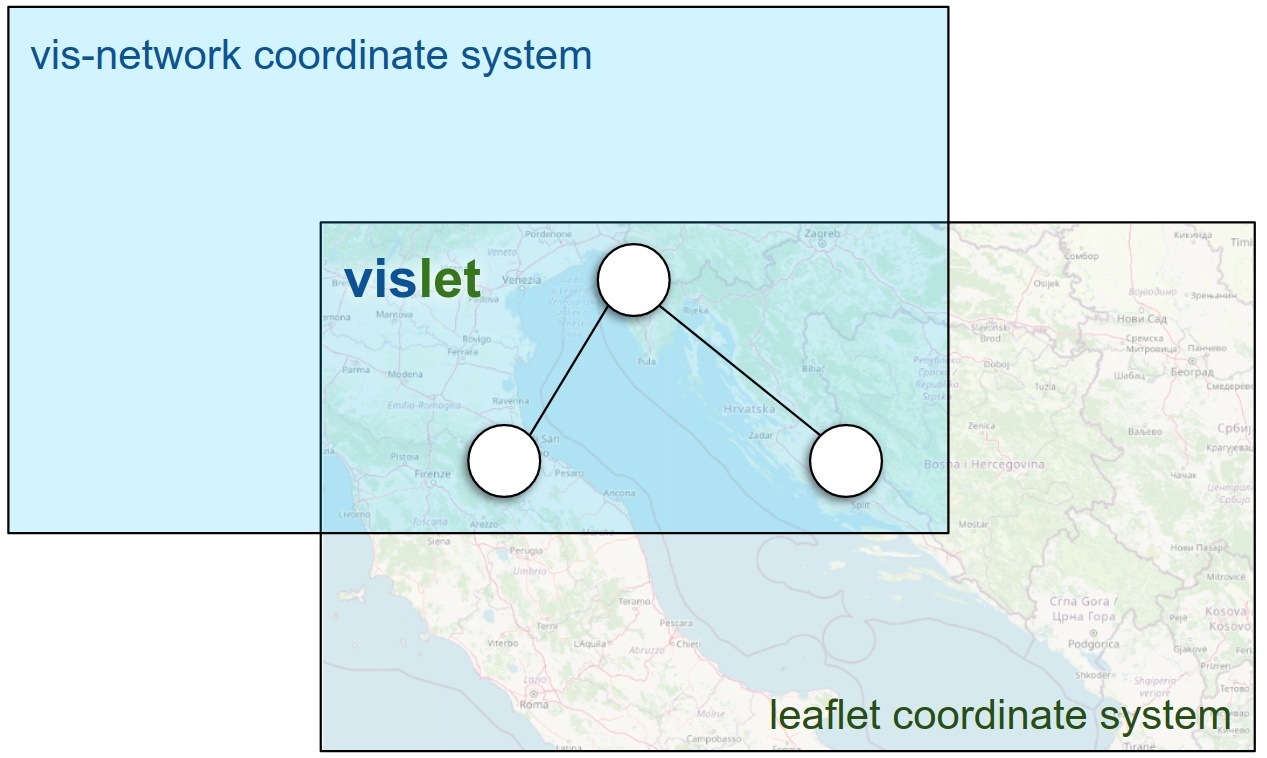
Both vis-network and Leaflet have their own coordinate system. Vislet transforms those two coordinate systems into one coordinate system, Vislet's coordinate system. Now, you work with one instead of two coordinate systems. Vislet's coordinate system makes sure that nodes on vis-network have the map as a background underneath that's properly positioned and scaled. Vislet also constrains two coordinate systems as they both have their limits. Therefore, Vislet makes sure that vis-network nodes won't magically escape outside of the map. Every geographic node can always be found on a map at it's lat lng location. With Vislet, you can still click on the nodes and edges as vis-network is above (z-index) the Leaflet map.
Next steps
Implementation of Vislet is still barebone which means every aspect of Vislet is highly customizable. Further testing and development are needed for a fully working and robust implementation of Vislet. For example, automatically finding lat/lng node properties, showing nodes on an infinite map, finding better settings for vis-network and Leaflet map, etc.
Vislet is a new project and we would like to hear what other features and updates you would like to see in it!