From Events to Insights: Memgraph Production Telemetry Stack with AWS, ClickHouse, and Grafana
We needed production telemetry that answers engineering questions in minutes, not hours. The core requirements were durable raw storage, efficient batching, and fast aggregations over semi-structured events.
This article explains the architecture we use today with AWS, ClickHouse, and Grafana, including why we keep raw data as the source of truth and how batching lets us scale without turning telemetry into a separate platform team.
Why We Needed This Stack
At Memgraph, we build and operate a distributed graph database that runs in a wide range of environments, from local developer machines to large production deployments. As usage grew, so did the importance of understanding how Memgraph behaves in the real world.
Telemetry plays a key role in that understanding. It allows us to answer questions like:
- How are different Memgraph versions being used?
- Which features see the most adoption?
- How does the system behave across deployment types and workloads?
- Where should we focus our engineering effort next?
Early on, simpler approaches were sufficient. But as the volume, variety, and importance of telemetry data increased, we needed a more robust solution that could handle high ingestion rates, long-term retention, and flexible analysis without becoming an operational burden.
The result is our current production telemetry stack, built on AWS, ClickHouse, and Grafana. Together, these tools let us collect raw events at scale, transform them into meaningful metrics, and explore the data interactively while keeping the system reliable and cost-effective.
In the sections that follow, we’ll walk through this architecture in detail, starting with a high-level overview and then diving into how each component fits into the overall system.
High-Level Architecture
At a high level, our telemetry system is designed as a pipeline that turns raw events into actionable insights, while keeping each stage loosely coupled and independently scalable.
The flow looks like this:
- Memgraph deployments emit telemetry events
- Events are ingested through AWS-managed infrastructure
- Raw data is stored durably in Amazon S3
- Telemetry data is batched and ingested into ClickHouse
- Grafana provides dashboards, exploration, and alerting
This separation allows us to scale ingestion, storage, processing, and visualization independently, depending on where the bottlenecks are.
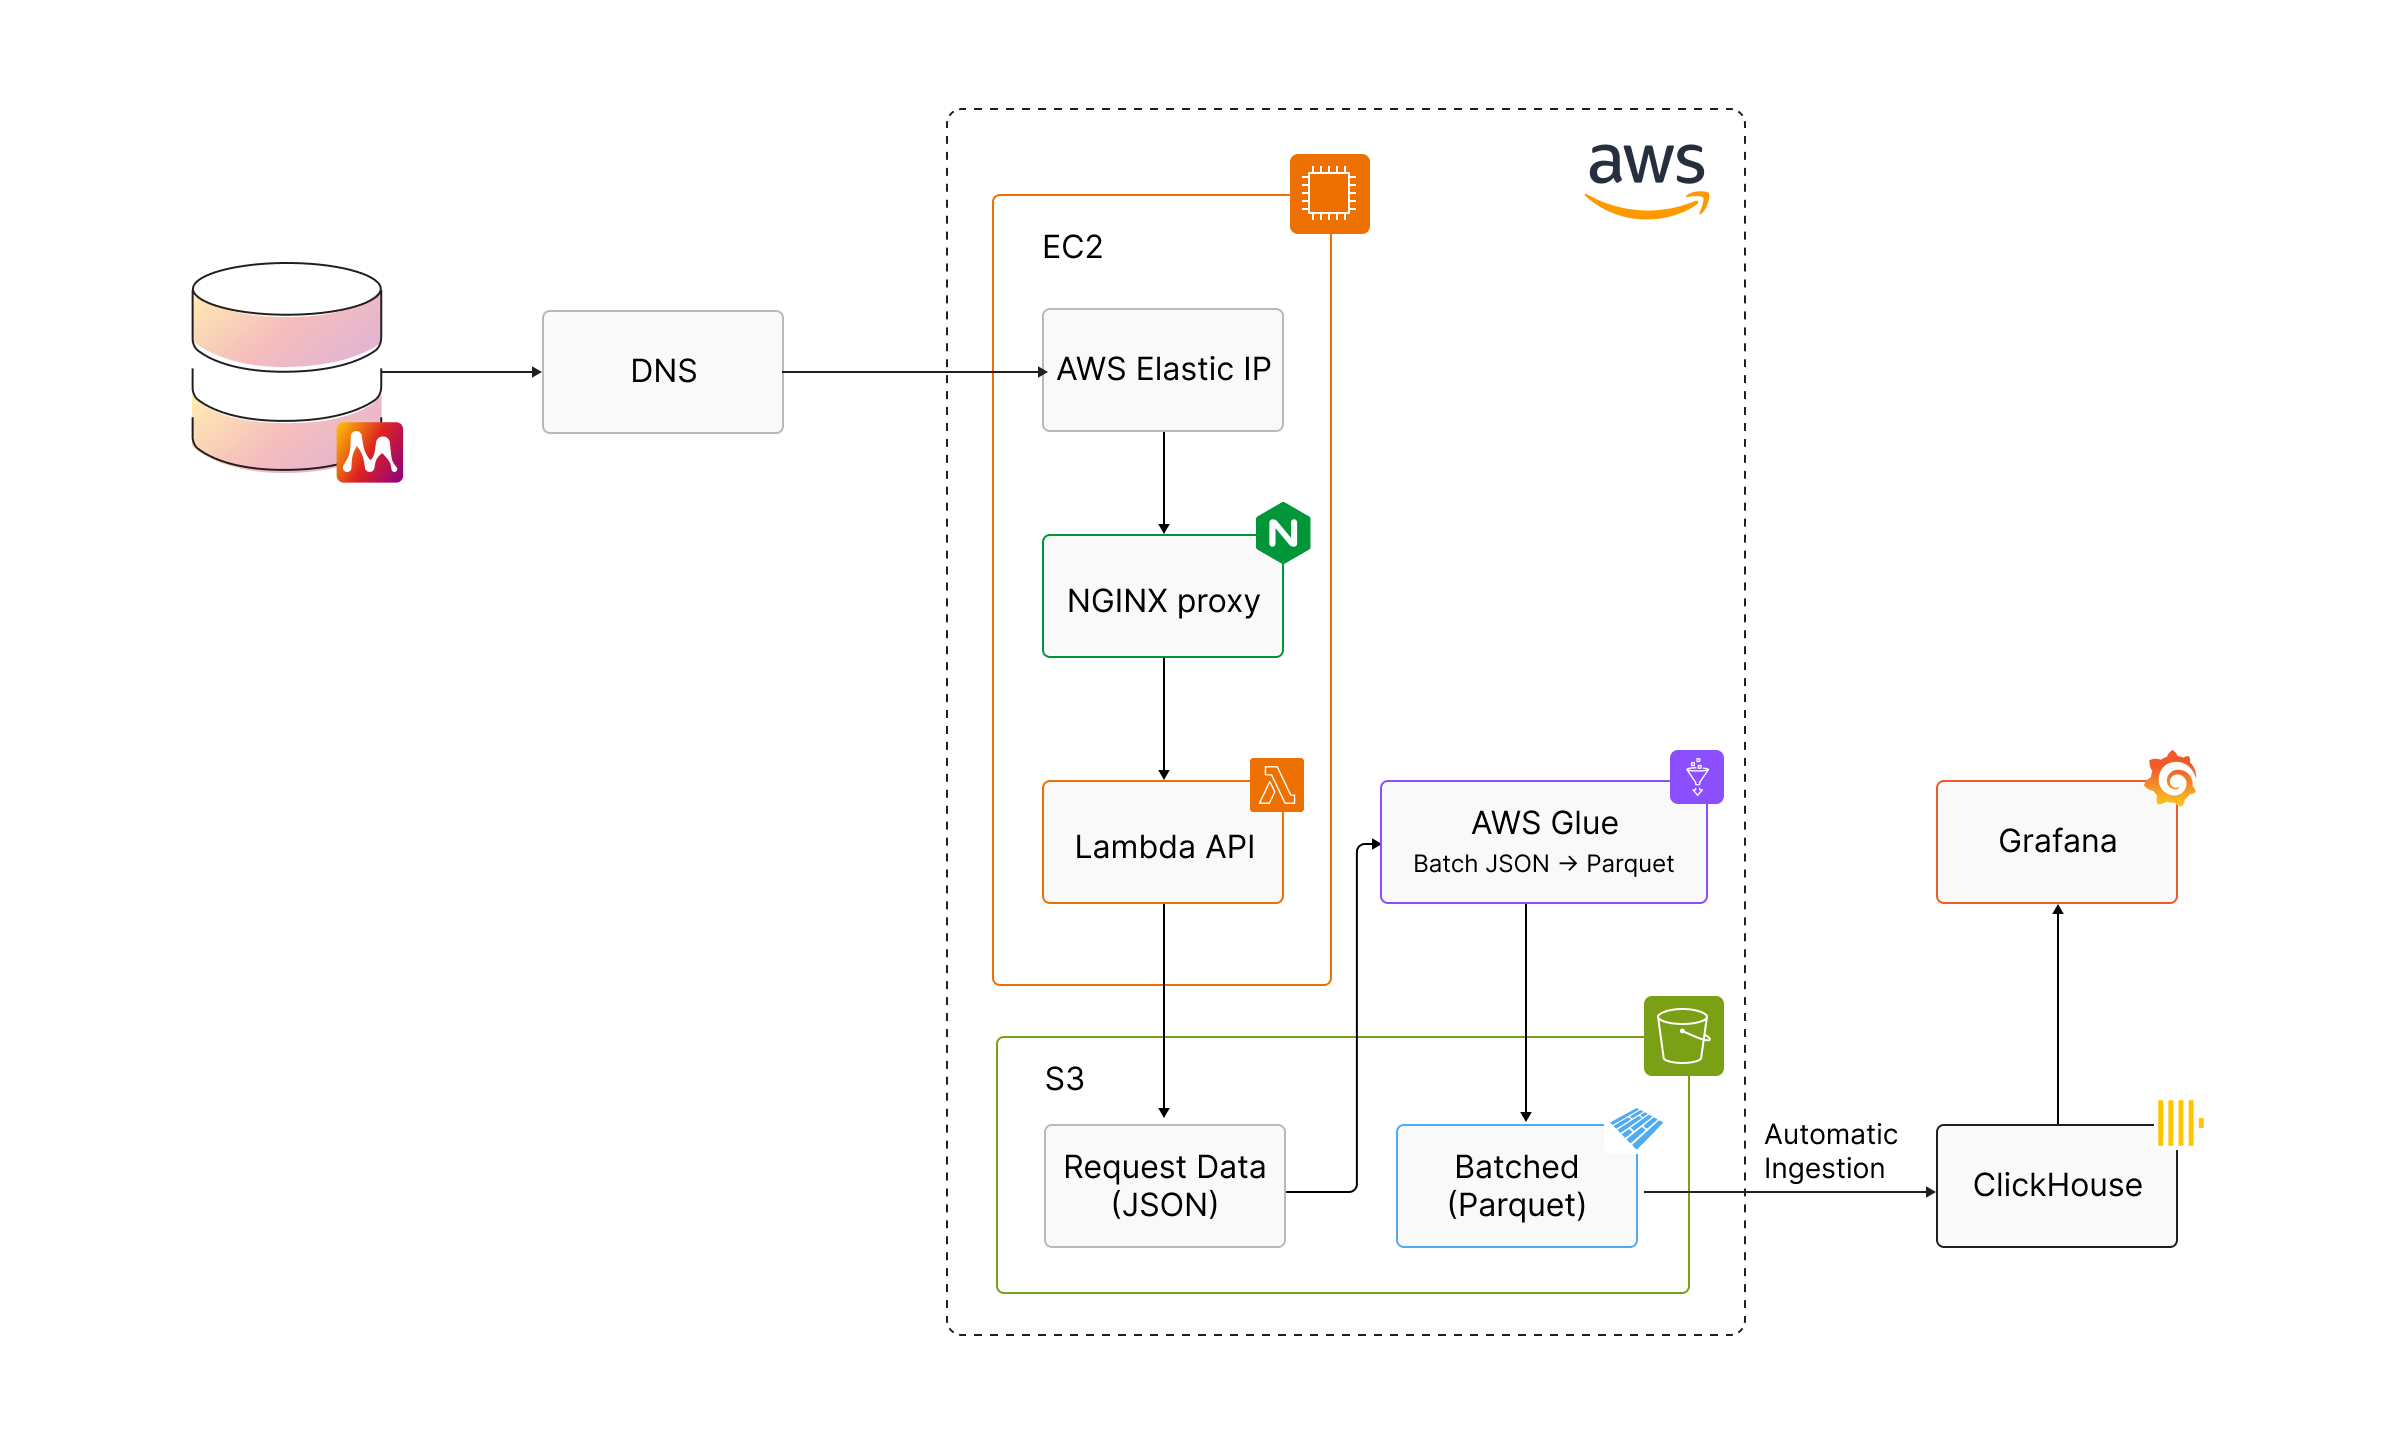
Telemetry events enter the system over HTTPS and are routed through a lightweight edge layer before reaching our ingestion API. From there, events are written to durable object storage, giving us a reliable source of truth for all incoming data.
Before data is loaded into ClickHouse, we run a batch processing step. Importantly, this step performs minimal transformation of the telemetry payloads. Rather than aggressively reshaping or normalizing the data, we preserve the original request JSON almost entirely. The primary purpose of this stage is to batch together hundreds of thousands of small telemetry requests into compact, daily Parquet files, which makes downstream ingestion and querying significantly more efficient.
This approach works well because ClickHouse can natively and efficiently work with semi-structured data. We take advantage of its flexible JSON column support to query telemetry data without requiring a rigid schema upfront. This is something we’ll come back to in more detail later.
ClickHouse sits at the center of the architecture. It stores both raw and derived telemetry and serves as the primary backend for dashboards and analysis. Grafana connects directly to ClickHouse, enabling real-time visibility as well as long-term trend exploration without requiring a separate metrics pipeline.
By keeping each part of the system focused on a single responsibility, we can evolve the architecture incrementally. Without having to redesign the entire stack, we can change how data is ingested, how long it’s retained, or how it’s aggregated.
In the next sections, we’ll walk through each part of this architecture in more detail, following the data from ingestion all the way to visualization.
Why AWS
AWS provides the foundation for our telemetry system, primarily by handling ingestion, durability, and batch processing. We deliberately use a small set of well-understood services, each with a clear responsibility, rather than building a complex streaming pipeline.
At the edge of the system, an Elastic IP is used to receive telemetry traffic routed through Cloudflare. This gives us a stable public endpoint while still allowing us to manage and scale the underlying infrastructure. The Elastic IP points to EC2 instances running an NGINX proxy, which acts as a simple and reliable ingestion layer before requests enter the rest of the system.
From there, telemetry requests are forwarded to a Lambda-based API. Lambda allows us to handle large numbers of concurrent requests without pre-provisioning capacity, which is especially useful during traffic spikes caused by releases or upgrades. The API performs lightweight validation and then persists the raw request data directly to Amazon S3.
S3 plays a central role in the architecture. All incoming telemetry is written to S3 as raw JSON, giving us durable, low-cost storage and a complete source of truth for the data we collect. We also use S3 lifecycle rules to automatically clean up old, unbatched request data, which keeps storage usage predictable without manual intervention.
Batch processing is handled by AWS Glue, which runs nightly jobs to group hundreds of thousands of small telemetry requests into compact Parquet files. This step is intentionally focused on batching rather than transformation. By reducing the number of small files and applying compression, we make downstream ingestion into ClickHouse significantly more efficient while preserving the original structure of the data.
Overall, AWS allows us to absorb bursty workloads, retain raw telemetry safely, and process data in large batches with minimal operational overhead. This lets us focus on analyzing telemetry and improving Memgraph, rather than managing ingestion infrastructure.
Why ClickHouse
ClickHouse sits at the center of our telemetry architecture and is the system that turns raw telemetry into something we can actively explore and reason about.
One of the key design decisions is that ClickHouse pulls data directly from S3. Batched Parquet files produced by our nightly jobs are ingested automatically, which gives us a very strong separation between storage and compute. As long as the data exists in S3, we can redeploy ClickHouse at any time, in any environment, without losing historical telemetry.
This also gives us flexibility when evolving the system. We can adjust table definitions, change schemas, or introduce new derived tables without having to replay raw ingestion traffic or rebuild the entire pipeline. The raw, batched data remains immutable and durable in object storage.
Most of the telemetry data itself is stored inside a JSON column. Rather than enforcing a rigid schema upfront, we preserve the structure of the original telemetry requests and rely on ClickHouse’s native support for querying semi-structured data. This allows us to run expressive queries directly over JSON fields while still benefiting from columnar storage and high-performance aggregation.
For fields that are queried frequently, we use type hints to tell ClickHouse how to interpret specific JSON paths. This gives us the best of both worlds: flexibility for evolving telemetry payloads, and performance for common queries used in dashboards and analysis.
Retention is handled directly at the database level using TTLs. We keep roughly two years of batched telemetry data in ClickHouse, which gives us enough historical context for long-term trends without letting storage grow unbounded. Older data remains safely stored in S3 if it ever needs to be reprocessed.
Perhaps the most important benefit of this approach is how it decouples telemetry evolution from infrastructure changes. Memgraph developers can add new fields to telemetry events without coordinating database migrations or pipeline updates. Once a batch containing the new field is processed, it becomes immediately queryable and can be surfaced in Grafana dashboards right away.
In practice, this means telemetry can evolve as quickly as the product itself, without becoming a bottleneck for either engineering or operations.
Grafana: Turning Telemetry into Insights
Grafana is the primary way we interact with telemetry data day to day. It sits on top of ClickHouse and allows us to turn large volumes of raw, semi-structured data into clear, high-level views of how Memgraph is being used.
Using Grafana, we build dashboards that focus on aggregated trends rather than individual events. This includes understanding things like:
- how features are adopted over time
- how Memgraph is deployed in different environments
- broad patterns in resource usage
- long-term trends across releases and versions
These views help us answer product and engineering questions without needing to run ad-hoc queries for everything. Because Grafana queries ClickHouse directly, dashboards can evolve quickly as new telemetry fields are introduced or existing ones change.
Importantly, the dashboards are designed to surface system-level signals, not to track individual users or deployments. Telemetry data is analyzed in aggregate, and our focus is on trends that inform product direction, performance work, and capacity planning, rather than monitoring specific installations.
Grafana also plays a role in operational awareness. Dashboards make it easy to spot unexpected changes, regressions, or shifts in usage patterns following releases. When something looks off, engineers can drill down just enough to understand what’s happening, while still keeping the analysis at an appropriate level of abstraction.
By combining ClickHouse’s flexible data model with Grafana’s visualization and exploration capabilities, we’re able to move quickly from raw telemetry to meaningful insight. Thid allows us to scale without over-collecting data or over-engineering the observability layer.
How It All Fits Together
Individually, AWS, ClickHouse, and Grafana each solve a specific problem. Together, they form a telemetry system that is reliable, flexible, and easy to evolve.
AWS handles the front of the pipeline: ingestion, durability, and batch processing. Telemetry events can arrive in bursts, be written safely to long-term storage, and be batched efficiently without requiring always-on infrastructure or complex streaming systems.
ClickHouse provides the analytical core. By ingesting batched Parquet files directly from S3 and storing telemetry largely in a flexible JSON format, it allows us to query evolving telemetry data without constant schema migrations. Retention policies keep the working dataset manageable while preserving historical data in object storage.
Grafana sits on top of ClickHouse and makes the data accessible. Dashboards and exploratory queries turn raw telemetry into high-level insights that inform product decisions, highlight trends, and surface unexpected changes.
A key theme throughout the system is decoupling. Ingestion is decoupled from analytics, storage is decoupled from compute, and telemetry evolution is decoupled from infrastructure changes. This lets each part of the system change independently as requirements grow or shift.
The result is a telemetry stack that scales by design. It can absorb high event volumes, adapt to new telemetry fields, and be redeployed or evolved without disruption. As Memgraph continues to grow, this architecture gives us the confidence to collect telemetry responsibly, analyze it flexibly, and focus on insights that help us build a better database.