
How HIWE IT Leveraged Memgraph for Enhanced Supply Chain Insights
The modern supply chain is a complex ecosystem, with raw materials from one continent transforming into finished products delivered to another in a matter of days. This intricate web of supply chain players demands real-time visibility and the ability to rapidly adapt to disruptions. Traditional relational databases, designed for structured data, struggle to keep pace with this dynamic environment.
This is where graph databases come in. By enabling companies to map out intricate connections and visualize interdependencies, graph databases offer a more efficient and intuitive way to manage, analyze, and optimize supply chains.
Driven by this innovative approach, HIWE IT teamed up with Memgraph to deliver advanced supply chain graph analytics solutions for businesses facing these very challenges. By leveraging Memgraph’s high-performance graph database, HIWE IT helps companies uncover hidden patterns, streamline processes, and gain deeper insights into their supply chain networks, all in real-time.
In this article, we'll explore the role of graph databases in modern supply chain management, highlight the advantages over traditional relational databases, and showcase how HIWE IT leverages Memgraph to create robust supply chain analytics applications.
Let's dive in!
Supply Chain Management - Relational Databases vs Graph Databases
While relational databases organize data into tables, graph databases organize data based on relationships. In supply chain management, these relationships are vital. A single disruption in one part of the chain can ripple through the network, causing unforeseen problems. Graphs allow you to trace these connections more efficiently, pinpoint bottlenecks, and forecast potential risks.
Here's why graph technology is superior for supply chain analysis and optimization:
- Modeling complex relationships - Graphs naturally map multi-tier nodes (suppliers, manufacturers, retailers) for easy querying.
- Real-time analytics - In-memory graph databases like Memgraph handle real-time data for immediate insights.
- Dynamic querying - Graphs excel at querying evolving relationships, unlike rigid relational schemas.
- Efficient traversal - Graphs quickly traverse relationships, optimizing routes or assessing supply disruptions.
- Intuitive visualization - Graphs visually highlight bottlenecks, risks, and opportunities in supply chains.
Graph Use Cases for Supply Chain
Graph databases provide a powerful way to visualize and analyze the intricate connections within a supply chain. Let’s explore how these key graph capabilities transform supply chain management:
Multi-Tier Supplier Relationships & Dependencies
Graph databases naturally model complex supplier relationships as interconnected nodes, making it easy to visualize multi-tier dependencies. This allows businesses to quickly assess their full supplier network and potential risks or opportunities.
Take Trademo, for example. By switching to Memgraph's graph database, they slashed their query times from a sluggish 1 minute to a lightning-fast 7 seconds for their multi-tier supply chain data. This dramatic speed boost supports them with real-time decision-making and agile responses to supply chain disruptions.
Potential Bottlenecks
Using metrics like betweenness centrality, graph analytics highlights critical nodes that could disrupt the supply chain if they fail. Graph databases efficiently visualize these chokepoints or bottlenecks, allowing for proactive risk management.
Optimal Routing & Logistics Planning
Graph databases leverage algorithms like shortest path to find the most efficient routes between suppliers and distribution centers. By considering factors such as distance, transportation time, and capacity constraints, graphs can provide valuable insights for logistics planning. This helps businesses optimize transportation, reduce costs, and adapt to real-time changes.
Inventory Flow & Stock Level Optimization
Graphs track inventory movement across nodes using traversal algorithms, helping businesses monitor stock levels and optimize replenishment. This reduces both overstocking and stockouts by providing a clear view of inventory flow. By analyzing historical data and demand patterns, graphs can identify imbalances and suggest adjustments for efficient inventory management.
Hidden Patterns and Inefficiencies in the Supply Network
Graphs reveal hidden patterns by analyzing relationships and interactions in the supply chain. For instance, you can use Community detection algorithms to uncover inefficiencies like redundant suppliers or routing issues, helping optimize operations.
HIWE IT: Advancing Graph-Based Solutions for Modern Supply Chain Challenge
Hiwe IT is a forward-thinking professional services company specializing in building innovative solutions around and on top of graph databases. With a deep understanding of both business needs and cutting-edge technology, HIWE IT is at the forefront of applying graph-based analytics to solve complex supply chain challenges.
HIWE IT's expertise in leveraging graph databases, particularly Memgraph, enables them to create powerful, tailored applications that provide critical insights into supply chain operations.
Supply Chain Graph Analysis - HIWE IT’s Demo Tools
HIWE IT has developed a comprehensive supply chain analysis demo application using Memgraph. This demo showcases various tools using graph-based analytics to provide critical supply chain insights:
Order Analysis
A user-friendly tool that provides a comprehensive, real-time snapshot of all pending orders, including quantities and ordered products. The system identifies products ready to ship and flags those that require production, highlighting any items not stored in any warehouse.
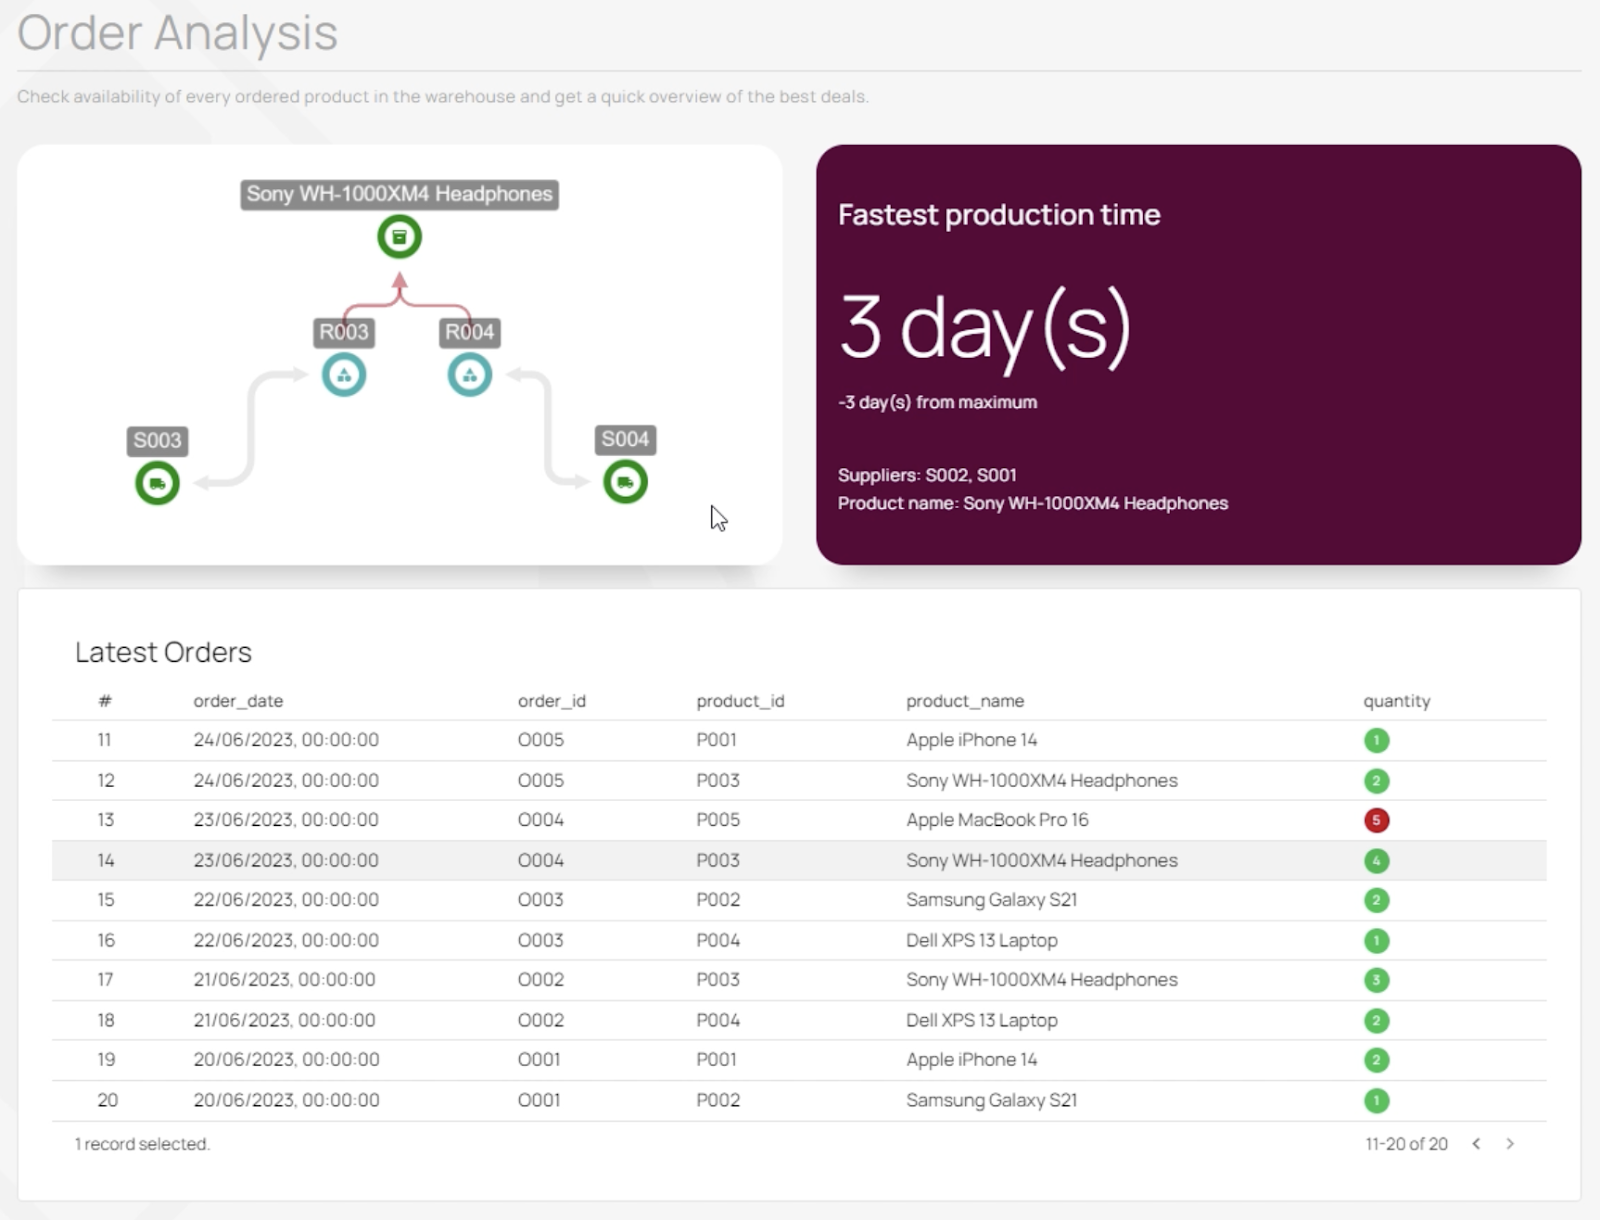
Memgraph enhances this process by offering smart supplier recommendations, optimizing both cost and delivery time.
Users can easily click on any order in the table to instantly view the cheapest production price and the fastest production time. The tool also prioritizes suppliers based on the lowest cost or quickest delivery, helping users to make informed decisions with minimal effort.
Product Availability
A powerful simulation tool that allows users to effortlessly evaluate different supplier combinations and production options. The tool provides a complete list of available suppliers and products, highlighting any items not currently stored in warehouses for easier decision-making.
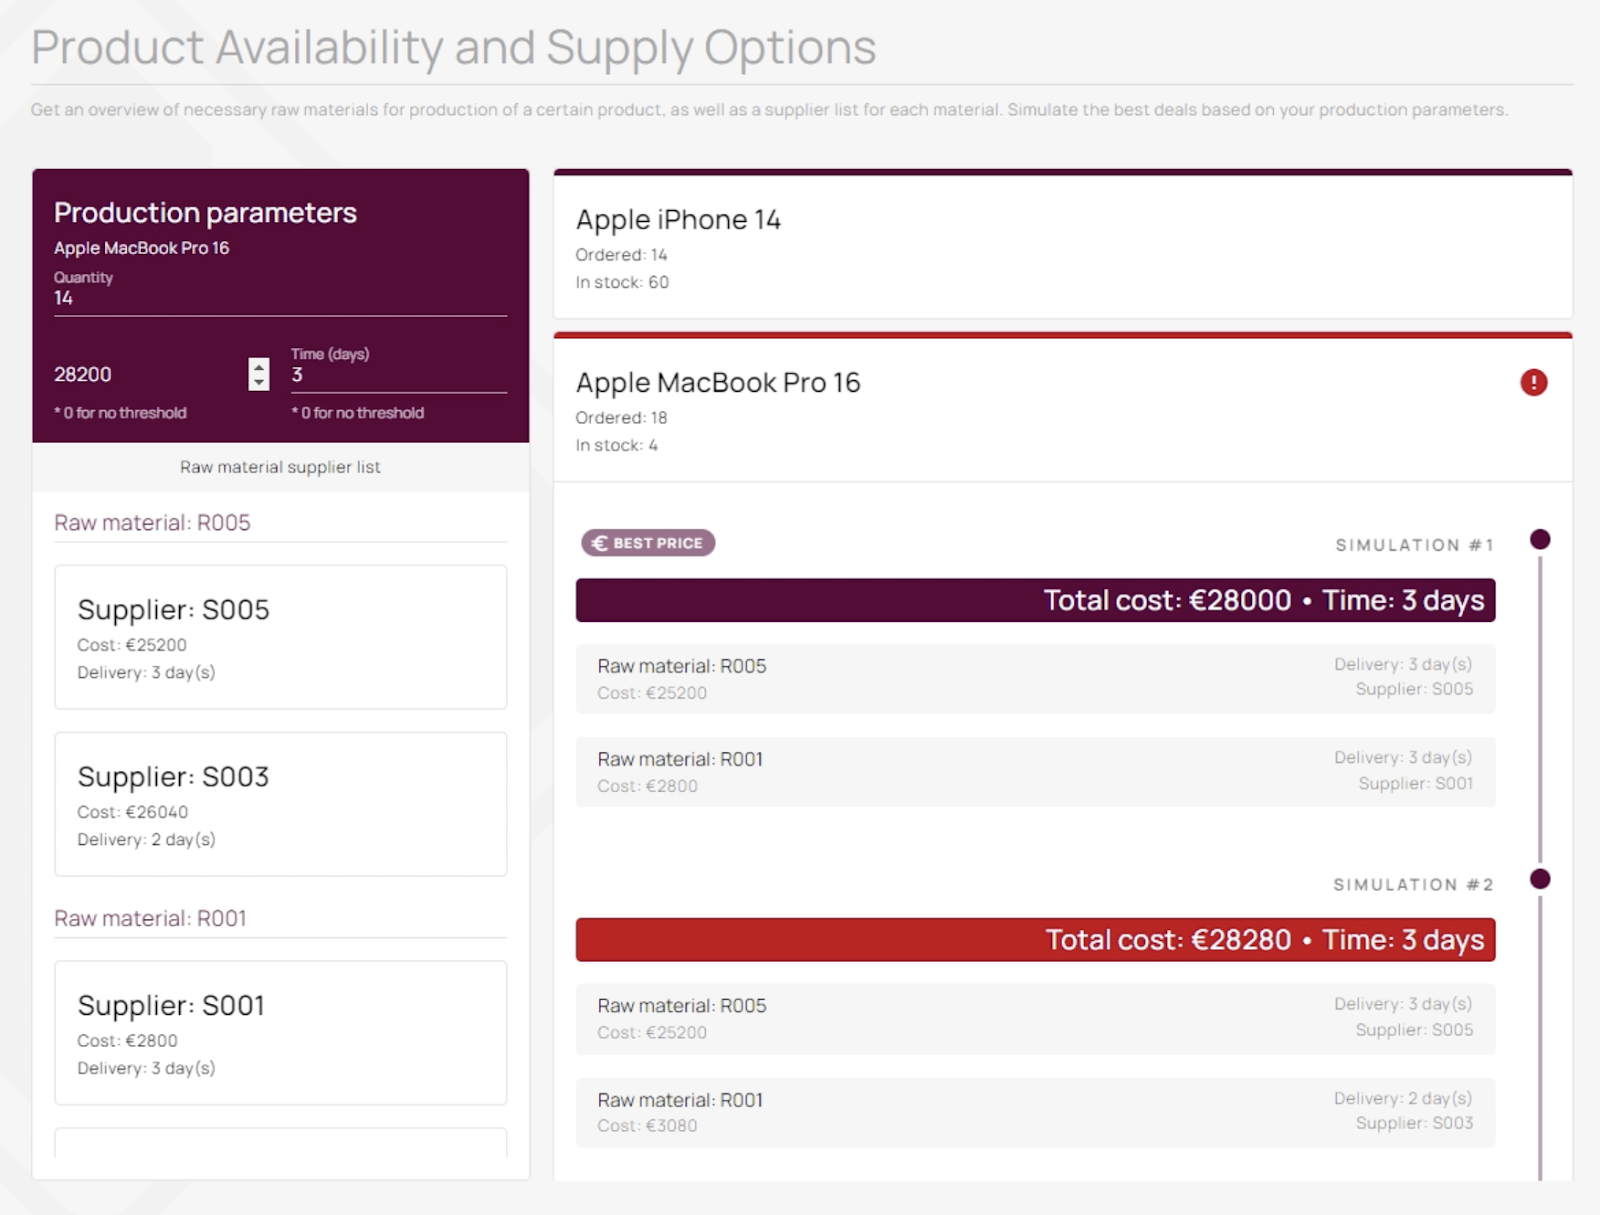
With real-time pricing and delivery data, users can simulate various supplier combinations to find the best option—whether it's the cheapest, the fastest, or a balance between the two.
Users can specify production quantities, and the system will dynamically recalculate potential costs and timelines. Additionally, by setting price and delivery time thresholds, the tool automatically flags any options that fall outside the specified constraints, ensuring users stay within budget and meet deadlines with ease.
Impact Analysis
One of the most critical questions in supply chain management is: what happens if a supplier becomes unavailable to deliver raw materials?
This impact analysis tool addresses this concern by providing a user-friendly interface that allows users to exclude specific suppliers from the supply chain. Instantly, they can visualize the effects on raw material prices and delivery times.
Additionally, HIWE has developed a straightforward scoring system for suppliers, which considers multiple factors, including their production capacity, delivery speed, and price competitiveness compared to other suppliers of the same product. This scoring system enables businesses to make informed decisions when considering which suppliers to exclude.
By strategically excluding suppliers with lower scores, businesses may find that production parameters remain unaffected. Conversely, excluding a supplier with a higher score can lead to significant increases in price and delivery times, potentially rendering some products impossible to produce.
This real-time impact analysis enables businesses to adapt proactively to supply disruptions, streamlining the response process and enhancing overall operational efficiency. By reducing the time spent on manual assessments, companies can quickly identify affected areas and explore alternative solutions.
Memgraph Features Driving Supply Chain Insights
The development of HIWE IT’s supply chain analysis demo application is significantly enhanced by several key features of Memgraph:
-
Fast prototyping with quick data import and schema creation
- Memgraph's native CSV imports and openCypher support allow for rapid integration of raw supply chain data, enabling HIWE IT to efficiently map complex relationships between suppliers, production processes, and shipments.
-
Smooth workflow via Memgraph Lab
- Memgraph Lab enabled HIWE IT to interactively write and test openCypher queries, allowing them to quickly and accurately tweak and optimize their queries for insights. Its visualization features also helped them clearly map the relationships between different supply chain entities.
-
Efficient query execution with the Node.js Connector
- Memgraph's Node.js connector helped seamlessly pass queries and their parameters from HIWE IT's application directly to the database. This ease of parameter passing and real-time execution of complex queries allowed them to focus on building an intuitive frontend without worrying about backend performance issues.
-
Comprehensive documentation
- Memgraph’s extensive documentation supports HIWE IT throughout the development process, ensuring quick resolutions to technical challenges and promoting rapid feature iteration.
Supply Chain Success Story: Metal Industry
In the metal industry, managing the supply chain and ensuring product traceability is highly complex. Metal products typically go through multiple stages of production and are sourced from a diverse range of suppliers.
Key Challenges
One of HIWE IT's clients, a major player in the metal industry, faced significant challenges in managing their complex supply chain using a traditional relational database.
The company needed to meticulously track product traceability across multiple stages of production while ensuring compliance with strict industry regulations. This involved monitoring the origin of raw materials, the various processing methods applied, and the end-products delivered to customers.
The relational system struggled to process and analyze these intricate, multi-hop supply chain relationships, resulting in slow query times and limited insights. This made it challenging to maintain product quality, optimize operations, and make informed decisions in real-time.
With the growing complexity of their supply chain and the need for faster, real-time insights, the company realized that their existing relational database infrastructure was no longer sufficient. They required a more advanced solution capable of handling the interconnected nature of their supply chain data in real-time.
Graph Database Solution
HIWE IT implemented a graph database solution that transformed the way the client managed their supply chain.
By switching to a graph-based model, the client could easily map supplier networks, track raw materials, and manage production processes. Ultimately, the client was able to get answer to the following business-critical questions:
-
Which suppliers consistently delivered materials that required reprocessing?
-
What alternative suppliers or routes could be used to minimize delays or reduce costs?
-
How could they trace all batches of steel made using raw materials from a specific supplier and processed in a particular plant, especially those that failed quality checks?
-
Which machines were used during the forging of a specific component?
Key Results
-
Faster data access - Critical queries that previously took minutes to execute in the relational system were completed in seconds, helping the client optimize supplier selection, reduce delays, and improve overall efficiency.
-
Improved efficiency - The ability to track product traceability and identify supply chain bottlenecks in real time allowed the client to optimize production and minimize disruptions.
-
Real-time analytics - Graph databases' multi-hop traversal functionality helped the client obtain instant insights across multiple stages of production, enabling more agile responses to supply disruptions, better resource allocation, and faster decision-making.
Wrapping Up
Graph databases provide a transformative solution for addressing complex supply chain challenges, especially in industries with intricate data dependencies like the metal industry. HIWE IT's successful use of graph technology showcases how real-time insights can streamline operations, cut costs, and improve supply chain resilience. As more companies recognize the value of adopting graph-based solutions, supply chain management will become faster, more efficient, and smarter.
Ready to unlock the potential of graph databases for your supply chain?
Contact HIWE IT’s team of experts today to explore how Memgraph can help you achieve greater efficiency, visibility, and agility in your operations. Together, let's build a more resilient and competitive supply chain.