
Optimize and Manage Supply Chain Network With Memgraph
“The supply chain stuff is really tricky.”, said Elon Musk at one point during an interview. And he’s not wrong, as the logistics behind the complex interdependencies can be endless and difficult to manage. Expert teams in the field are often tasked with creating schedules to make optimal build processes for the company’s products. The most challenging question asked during scheduling are - is the schedule optimal, and can we do it faster, cheaper, or better?
This article will explain how you can ease your way into analyzing your supply chain using graph analytics and Memgraph. You can use these tools to get accurate and meaningful information for optimizing your supply chain network. We’ll dive deep into the problems and algorithms in graph theory that can free you from hours of menial work, resulting in deploying your expert teams where their domain knowledge is of utmost importance.
To make you understand the concepts, we have prepared a simple supply chain graph that will use as an example throughout this article. During reading, you can scale it to your use case. At the end of the article, you can find a link to the simple supply chain graph uploaded into the demo application Memgraph Playground. You can use Memgraph Playground in the browser to find insights or further cement your graph understanding of the example.
All the visualizations in the article were made using Memgraph Lab, a visualization tool provided by Memgraph. The algorithms were queried with the help of Memgraph MAGE, a graph algorithm library used for exploring graphs with the most important analytical tools, with the possibility of extension to custom graph analytics in different programming languages.
Motivation
Graph database providers solve network resource optimization problems, and Memgraph is especially equipped for that job. If we look at the supply chain itself, it’s not very different from all the other industries that use networks, like chemical plant optimization or energy management networks. The supply chain is indeed a network of processes that needs to be as efficient as possible to reduce costs and bring more revenue. Simple as that.
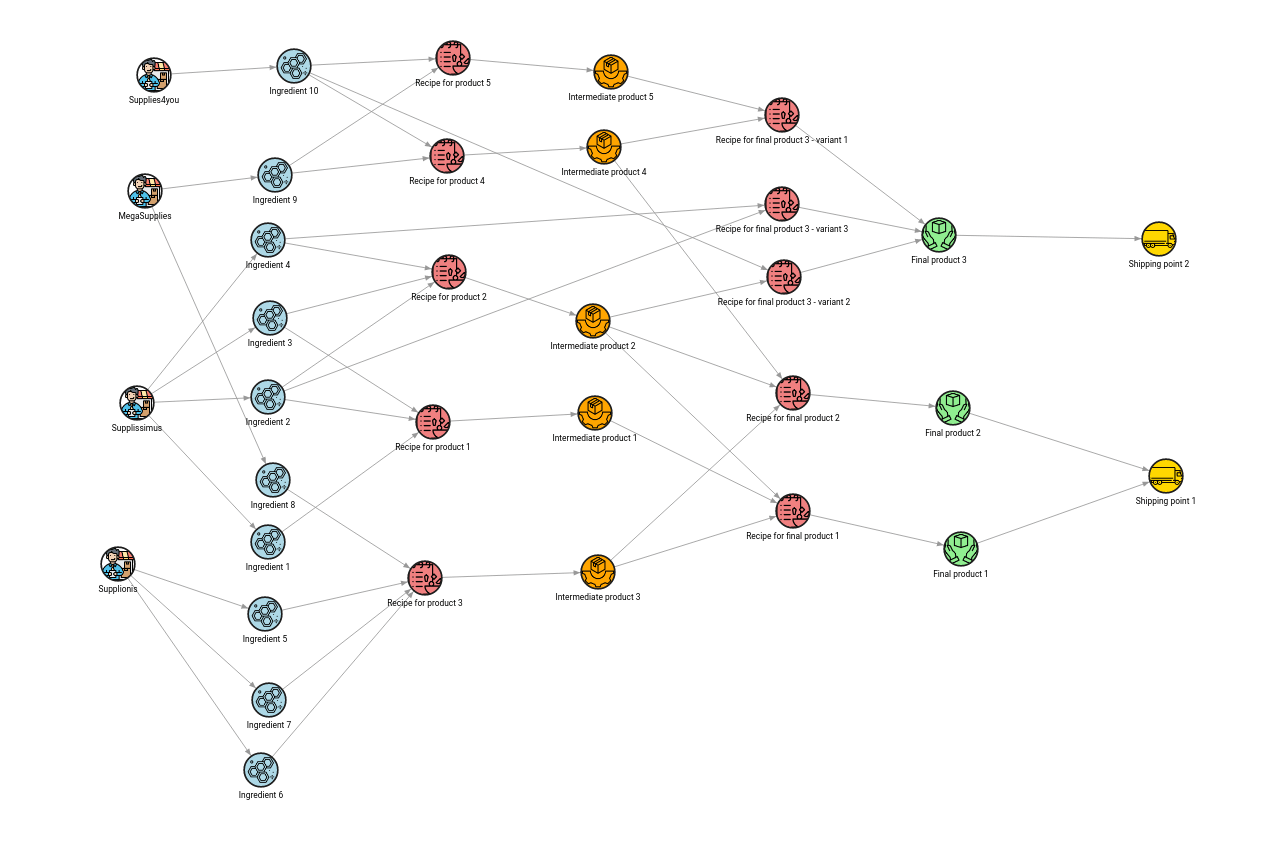
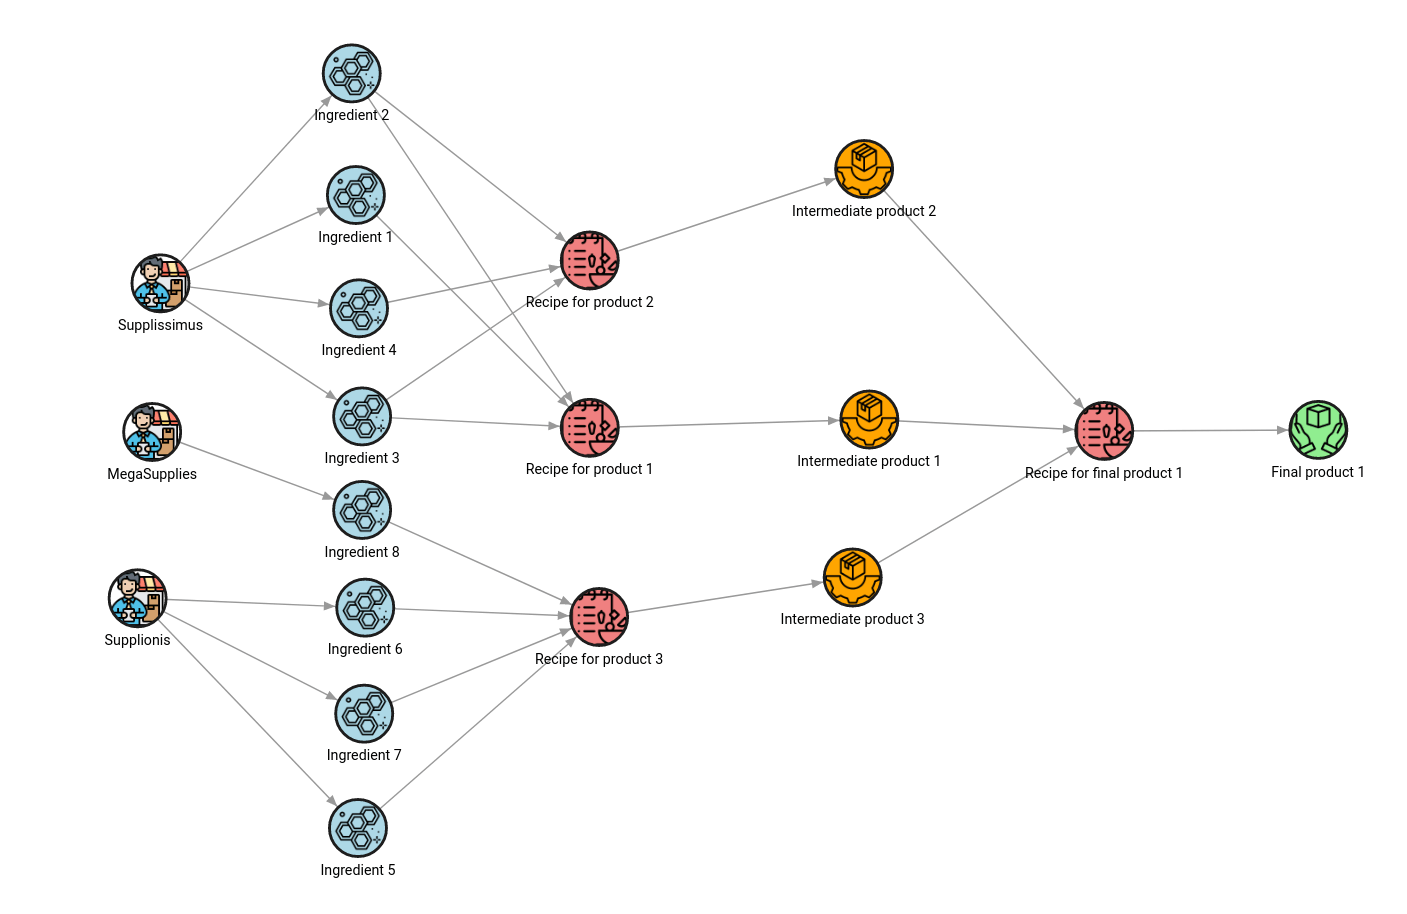
Or is it actually that simple? When we look at the network itself, it usually consists of different sections with the end goal of shipping the product to the user. Some of the sections are visible in the image below. A simple supply chain has suppliers, ingredients, intermediate products and final products with shipping information inside the same network. Since data is arriving from different sources, as each supplier and vendor or shipping company has its own information, it makes sense to pool all that data in a graph database, then use it as a source of truth for connecting all the dots.
It’s tough to achieve this with relational databases because of all the table joins necessary to discover all the paths from production start to end. But connecting all the nodes is actually a minor problem. The most time-consuming task is to construct a valid supply chain schedule. To design a satisfactory schedule, experts in the domain must have all the information about the current situation in the supply chain and have answers to questions such as:
- What are all ingredients needed for making product X?
- What is the produce production order that will make the supply pipeline flow in all the areas at all times?
- What critical products mustn’t run out of stock to avoid potential losses to the company?
- What quantity of ingredient X is necessary to make product Y?
- What quantity of ingredient X is necessary to make a sufficient amount of product Y, to make an adequate amount of the final product Z, of which Y is an essential part?
How can graph analytics and Memgraph help answer all of these questions?
Analyze dependant products by using pathfinding algorithms
Every supplier ships its materials to the supply chain company. If the graph is a source of truth, it’s easy to check what suppliers provide the company with what materials with the following query:
MATCH (s:Supplier {name:”Supplissimus”})-[r:SUPPLIES]->(i:Ingredient)
RETURN i;
The query above matches the supplier named “Supplissimus” and returns the ingredients it supplies. With the help of the visualization tool Memgraph Lab and the query execution window, we get the materials provided by the supplier as nodes. The result from Memgraph LAB can be observed in the image below.
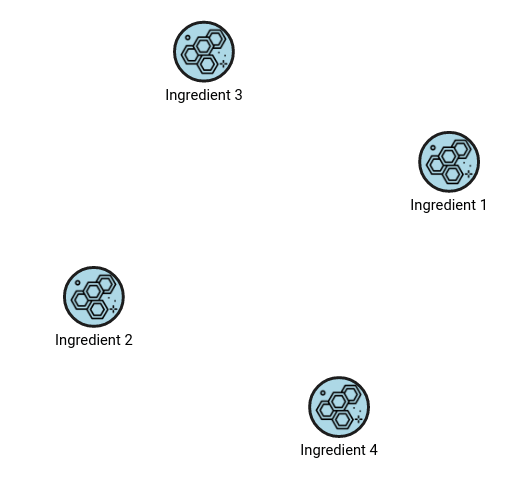
To easily differentiate nodes, each node and relationship type can be styled differently in Memgraph Lab to make visualizations more comprehensible and make different entities in the graph easily distinguishable.
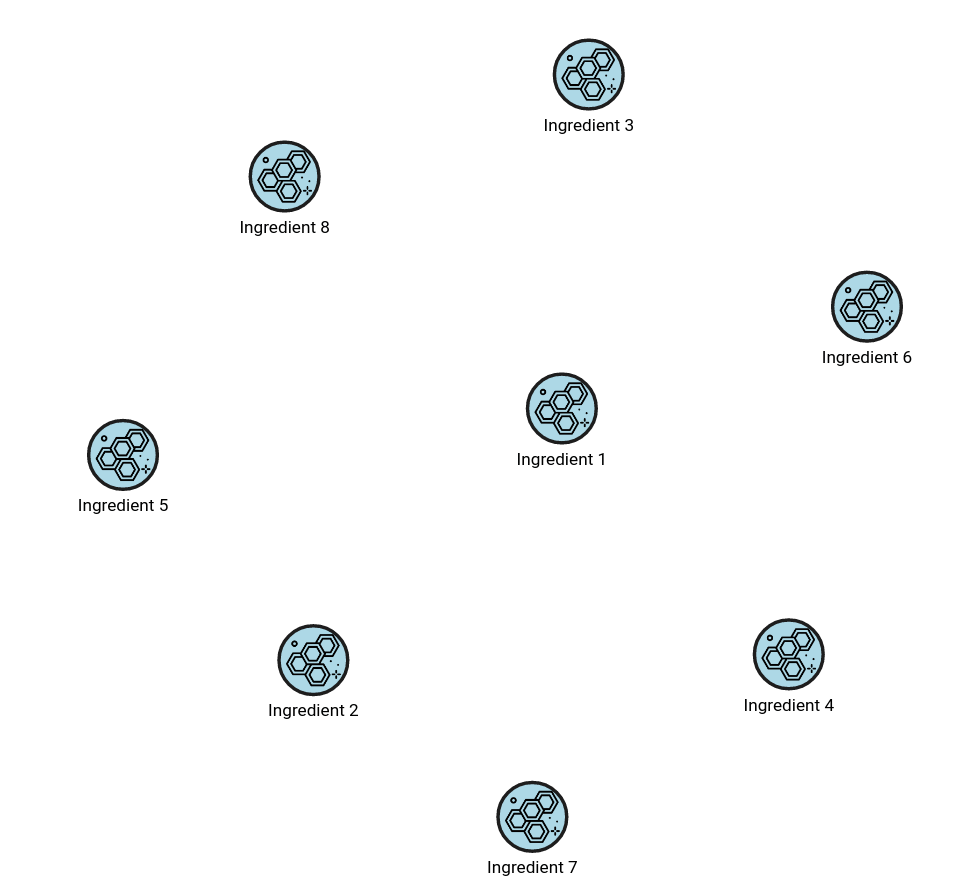
The query above has performed a 1-hop traversal, or querying of nearest neighbors. But since the supply chain is a multi-process network, the goal is to get the information about all primary materials needed to produce the final product. Multi-hop traversals are done with pathfinding algorithms. Several built-in pathfinding algorithms are available in Memgraph, like breadth-first search (BFS), depth-first search (DFS), and weighted shortest path. The BFS algorithm can traverse a graph from the final product all the way down to the primary ingredients needed to produce it:
MATCH p=(i:Ingredient)-[*bfs]->(f:FinalProduct {id:6});
RETURN DISTINCT i;
The above query will return a result like in the image below.
Once the ingredients or materials necessary for product manufacturing have been identified, let’s move on to the pipeline analysis. In logistics, it’s always helpful to know what processes result in the final product. With the graph_util module, contained in the Memgraph MAGE library, we can find out what nodes and relationships come before the inspected node. The query below returns all the ancestors to the final product:
MATCH (f:FinalProduct {id:6})
CALL graph_util.ancestors(f) YIELD ancestors
UNWIND ancestors AS ancestor
RETURN ancestor;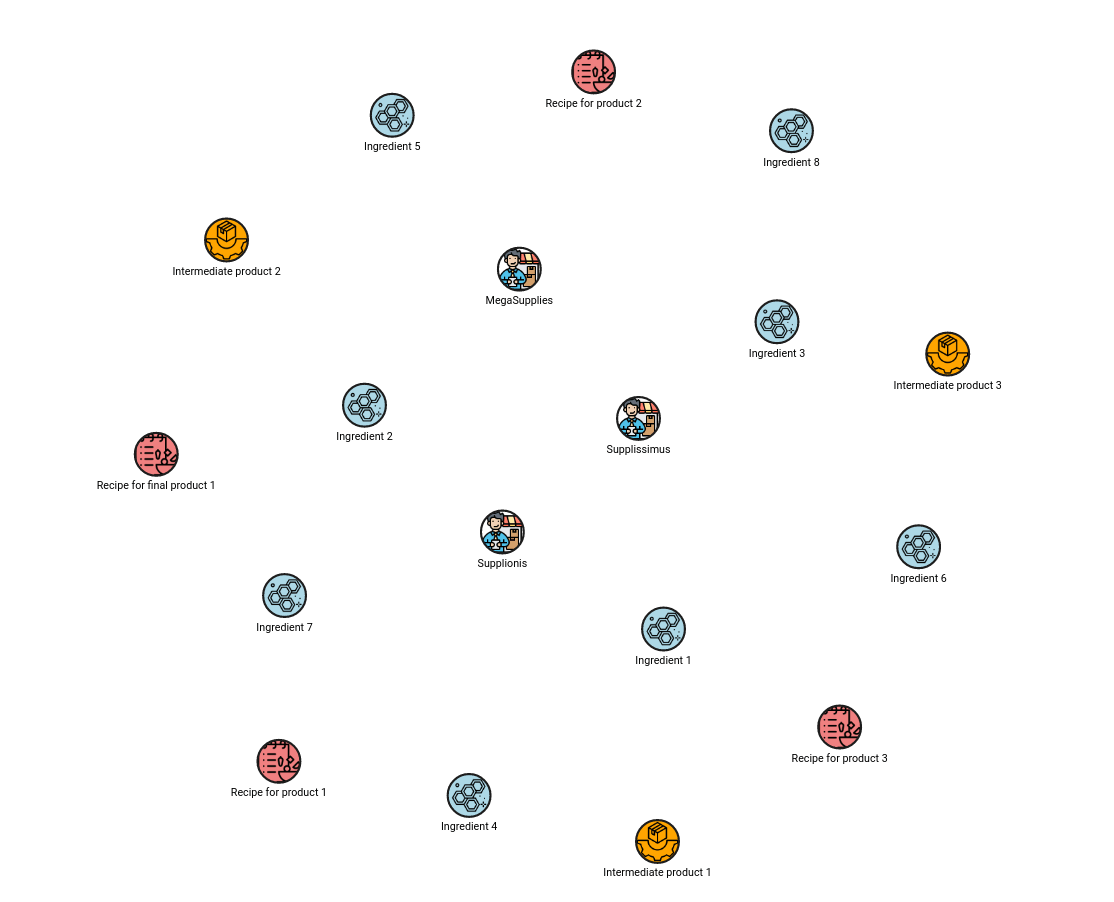
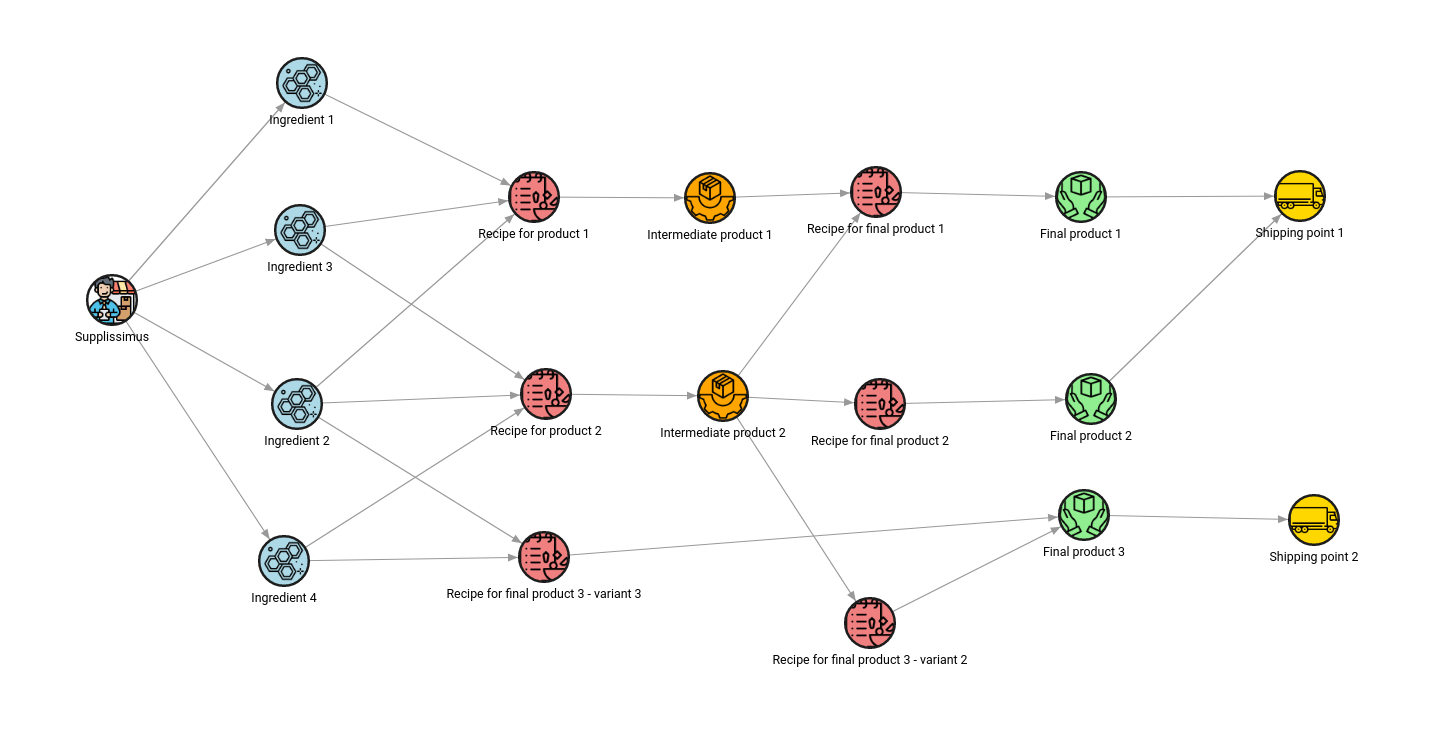
The result might not look very useful because nodes are scattered on the graph, but this is all part of the learning process! Graph_util’s procedure connect_nodes connects all the nodes which are input to the final product:
MATCH (f:FinalProduct {id:6})
CALL graph_util.ancestors(f) YIELD ancestors
WITH ancestors + [f] AS nodes
CALL graph_util.connect_nodes(nodes) YIELD connections
UNWIND nodes + connections AS graph
RETURN graph;
The output of the above query shows all the parameters and steps necessary for constructing the “Final product 1”. By looking at the image, you can gather much more helpful information than looking at the tables in a relational database.
The same model can help observe how critical a supplier is to the supply chain. The following query will return all the products depending on the supplies delivered by a specific supplier:
MATCH (f:Supplier {name:”Supplissimus”})
CALL graph_util.descendants(f) YIELD descendants
UNWIND descendants AS descendant
RETURN descendant;
The graph_util.connect_nodes procedure will show the whole pipeline impacted by the supplier.
MATCH (s:Supplier {name:”Supplissimus”})
CALL graph_util.descendants(s) YIELD descendants
WITH descendants + [s] AS nodes
CALL graph_util.connect_nodes(nodes) YIELD connections
UNWIND nodes + connections AS graph
RETURN graph;
The following query results show that the Supplissimus supplier impacts the pipeline of all 3 final products. The company depends entirely on this supplier and must have a contingency plan for high demand and production.
Order production by using sorting algorithms
The dependency analysis from the previous chapter made sure all the raw materials were present in the right place at the right time. But before the production can be scheduled, we need to know the order in which each production job is executed to get to the final product. If there is enough raw material in stock, but the production line moves in an illogical order, the schedule will be infeasible or suboptimal. Before the jobs can be ordered, we need to know how much product one job needs to produce so there are enough materials for the next job in the production pipeline.
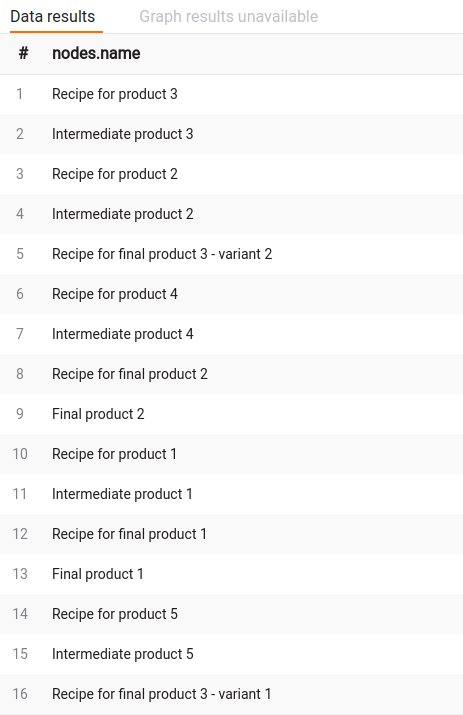
To solve this conundrum, an algorithm called topological sort needs to be used. Until all the dependencies are produced, there is no way of executing the final job, there are either not enough materials or some other jobs need to be finished for the next job to start. The following query orders jobs from first to the last:
MATCH p=(r:Recipe)-[*bfs]->(f:FinalProduct)
WITH project(p) AS graph
CALL graph_util.topological_sort(graph) YIELD sorted_nodes
UNWIND sorted_nodes AS nodes
RETURN nodes.name;
Recipes are the connection between materials that form the products. The results in the image below show that the product “easiest” to produce is “Final product 2” since it comes earliest in the pipeline of all the final products in the pipeline.
Find critical points in the pipeline with centrality algorithms
Most of the analysis above was focused on the best-case scenario. If everything goes right, and there is enough raw materials, and the jobs are scheduled correctly, we will get the exact output and maximize our production. However, life is not a fairy tale. There are unexpected events that we cannot control, such as a bad batch of materials or the unavailability of suppliers. The influence of suppliers on the final product has already been analyzed by exploring the connections between nodes. Still, there is one more algorithm that is an excellent tool for impact analysis and what-if scenarios, called betweenness centrality.
To sum up its behavior, the algorithm assigns a greater value to the nodes which lie on as much paths between pairs of all the nodes. If the node lies on a greater number of paths between nodes, it is critical to the pipeline and by having an insufficient quantity of that specific product, we might have a greater number of paths blocked and our pipeline slowed down.
Let’s run the algorithm to check for weak points in the pipeline:
CALL betweenness_centrality_online.set() YIELD betweenness_centrality, node
SET node.centrality = betweenness_centrality;

MATCH (n)-[r]->(m) RETURN n, r, m;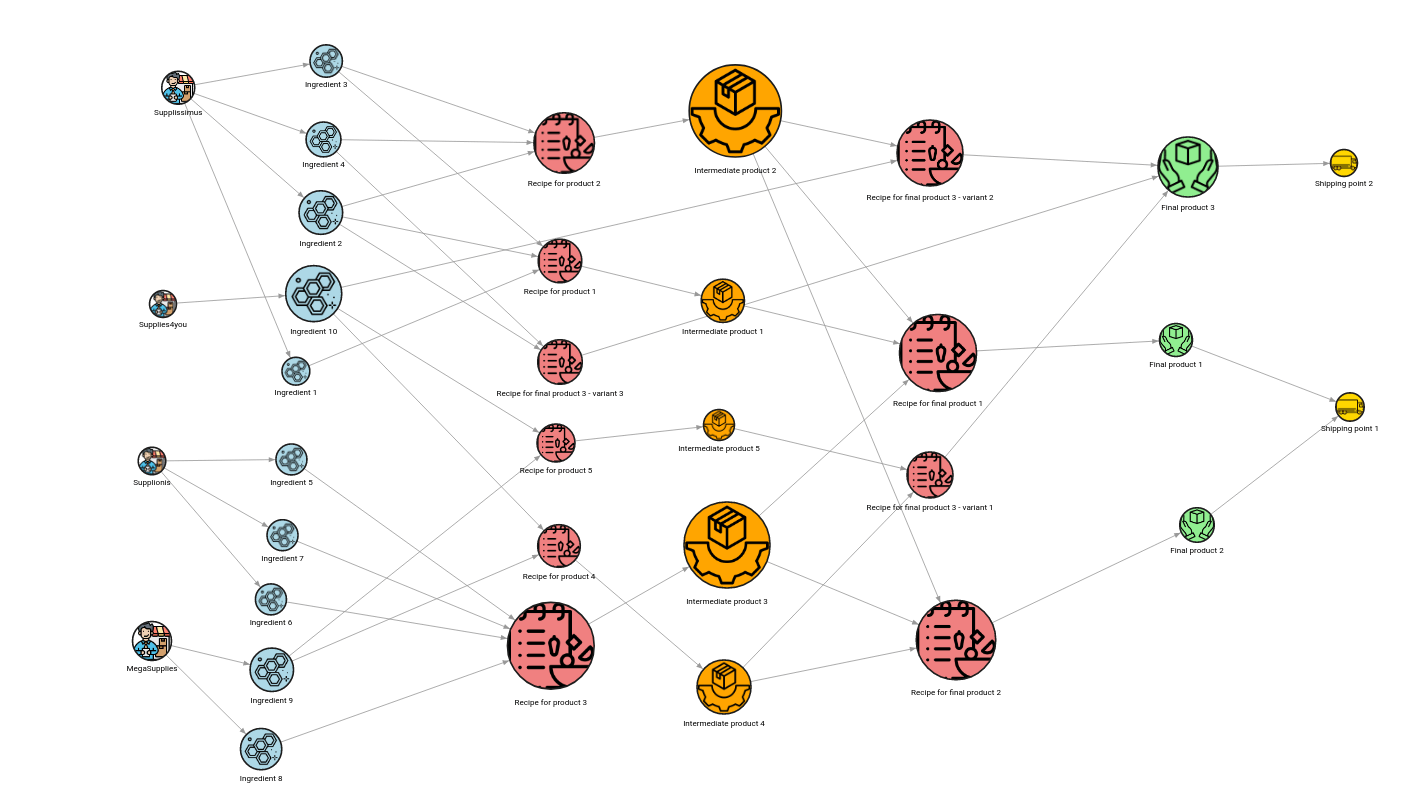
The node with the most significant size is “Intermediate product 2”. And if you look at the connections to the final products, we can see that this material affects the production of all three final products. That is why the betweenness centrality algorithm assigned the highest value to that product. This is the product you should never run out of.
The “Intermediate product 3” is also important, as it affects the production of two final products. If any of the three ingredients that form these two products are missing, the company won’t be able to produce them.
By knowing this, you can focus on strengthening the methodology of job scheduling and take necessary precautions to avoid blockages in the production line.
Do a quantitative analysis of supplies with custom aggregation
As with all solutions in general, there is no silver bullet that works the same for every industry. Graph algorithms may answer many different questions, but it’s impossible to cover all the uncertainties and provide solutions. Each system in the industry is different and has its data models and constraints.
To overcome this issue, Memgraph’s goal was to make graph analytics accessible to anyone. By exposing its API for querying graphs in different programming languages, end users can write their custom analytics on top of graph storage to retrieve meaningful information. If none of the graph algorithm or analytics capabilities the Memgraph engineering team provides do not suit your use case, develop your own.
Everything inside Memgraph’s ecosystem, data persistency, visualization, and analytics are contained in one platform. This reduces the cost of ownership and time spent on menial work trying to connect and maintain a possible alternative of multiple tools and software for a single purpose. The analytics on graph storage also reduces latency and maintenance costs since it’s all one platform tied together for the most optimal performance in experience.
Suppose a data scientist is asked how much primary material the company needs to order, to produce a certain quantity of the final product. There is indeed no straightforward generic graph algorithm that can answer that question.
The experts can handle it by developing their own custom query modules which are run inside of Cypher queries. These are simple functions in Python. They define inputs from the query and outputs necessary to continue running the query.
Here is one example of such a procedure:
import mgp

@mgp.read_proc
def material_quantities(
  context: mgp.ProcCtx,
  product: mgp.Vertex,
  quantity: float
) -> mgp.Record(material=mgp.Vertex, quantity=float):

  next_products = [(product, quantity)]
  results = {}

  while len(next_products) > 0:
    next_product, next_quantity = next_products[-1]
    next_products = next_products[:-1]

    has_recipe = False
    for relationship in next_product.in_edges:
      if relationship.type.name != "PRODUCES":
        continue

      recipe = relationship.from_vertex
      has_recipe = True

      quantity_formed_with_recipe = relationship.properties.get("quantity")
      quantity_needed = next_quantity / float(quantity_formed_with_recipe)

      for recipe_relationship in recipe.in_edges:
        material = recipe_relationship.from_vertex
        quantity_of_material = recipe_relationship.properties.get("quantity")
        calculated_quantity = quantity_needed * quantity_of_material

        next_products.append((material, calculated_quantity))

    if not has_recipe:
      if next_product in results:
        results[next_product] += next_quantity
      else:
        results[next_product] = next_quantity

  return [mgp.Record(material=x, quantity=y) for x, y in results.items()]
The procedure solves an issue which appears when we traverse deeper into the network, as material quantities need to be multiplied as many times as there are hops in the network until the source nodes.
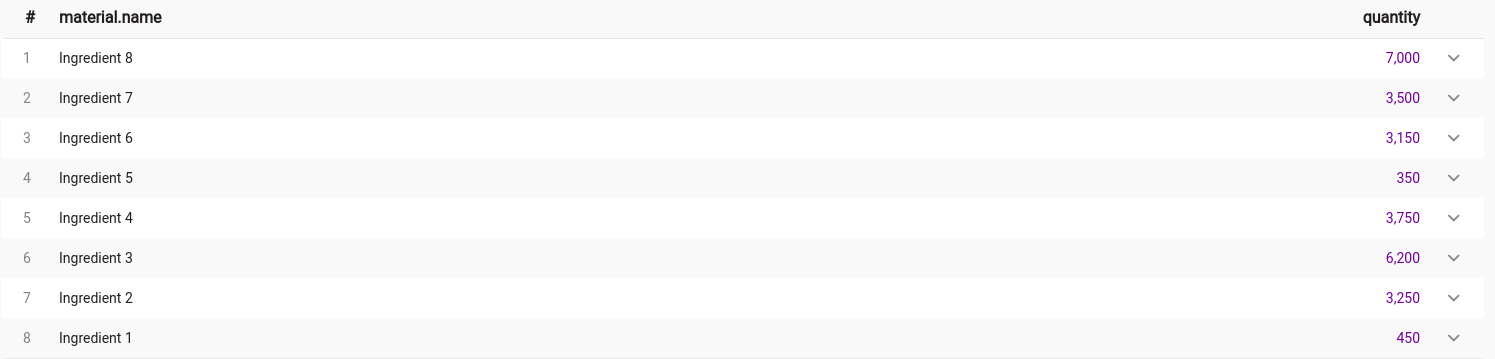
To answer the question of how much material is necessary for the total number of final product, run the following query:
MATCH (f:FinalProduct {id:6})
CALL quantitative_analysis.material_quantities(f, 1.0)
YIELD material, quantity
RETURN material.name, quantity
The results are displayed in the table below.
Conclusion
This blog post showed how to use various graph algorithms to manage the production pipeline, from discovering dependencies, creating production schedules, finding critical points and doing quantitative analysis. If your supply chain is having the same problems addressed here, we’ll be happy to accelerate your software development team and provide a new aspect of analytics to your supply and logistics pipeline!
To dive deeper into the subject, you can play around with datasets in Memgraph Playground and discover additional insights in the pipeline yourself! If you are already building a solution with Memgraph, share it at Memgraph’s Discord server, we would be happy to hear about your use case and help you by providing constructive advice.