Data Persistency, Large-Scale Data Analytics and Visualizations - Biggest Networkx Challenges
If you have been using NetworkX for one of your projects, you’ve probably noticed some of its limitations. Each time you want to change something in the dataset or run another algorithm, you have to load the dataset all over again. This repetitive loading wastes time and slows down the development process, especially for large datasets.
After running the queries, you probably want to explore the results by playing around with their visualization and share exciting insights you come across. As you probably know, NetworkX is not primarily a graph drawing package, so it doesn’t offer much to create visually pleasing and interactive graphs. Also, NetworkX cannot handle visualizations of large graphs, so you need to reach out for another drawing library and learn how to use it. Even when those libraries are better than NetworkX alone, they still have limitations regarding zooming and interacting with nodes and relationships, such as dragging and clicking.
Memgraph can offer you data persistence, allow you to run queries and graph algorithms and create visualizations you can interact with and customize, and it is free to use as it’s open source. Read on to find out more.
To persist or not persist, that is the question
The issue with NetworkX is that it stores data in-memory in instantiated Python objects - Graph, DiGraph, MultiGraph, or MultiDiGraph. So NetworkX can actually give results of graph algorithms on smaller-scale graphs pretty fast. Still, each time you need to change something in the database or run another algorithm, you have to reload the dataset into the appropriate Python object. What’s even more annoying, if you plan to use your project in production, you need to find an appropriate permanent storage solution and additional graph analytics capabilities. There are a couple of solutions to store the data somewhere else, including exporting and importing those Python objects to different formats or using on-disk storage solutions, but that means more software you need to figure out, which slows down the development process significantly.
The bottom line is - you like using Python and NetworkX for analyzing graphs as it allows you to harness the power of graphs, but you have reached its limits. Your graph exceeds the memory limit, or the memory gets eaten up as soon as you fire up one of NetworkX’s graph algorithms, or you need a graph data storage that allows you to perform graph analytics quickly.
Memgraph is, at its core, an in-memory graph database. With Memgraph, you can import large datasets, store them as graphs and run queries and graph algorithms. Although it is an in-memory database, it still has mechanisms that ensure durability, that is, it persists the data. Once you load your data into Memgraph, you can run different graph algorithms and change the database content without wasting time on data re-loading.
To ease the process of using Memgraph for NetworkX developers, NetworkX graph can be transferred into Memgraph using predefined transformations.
Graph analytics on a scale
Although NetworkX is easy to use and fires up quickly, it cannot handle large amounts of data. Many NetworkX graph algorithms, like the Girvan-Newman algorithm, become computationally very expensive on a scale of hundreds of thousands or millions of nodes and relationships. That computational cost comes from a pure Python implementation of NetworkX, and Python implementations are significantly slower than C/C++ implementations.
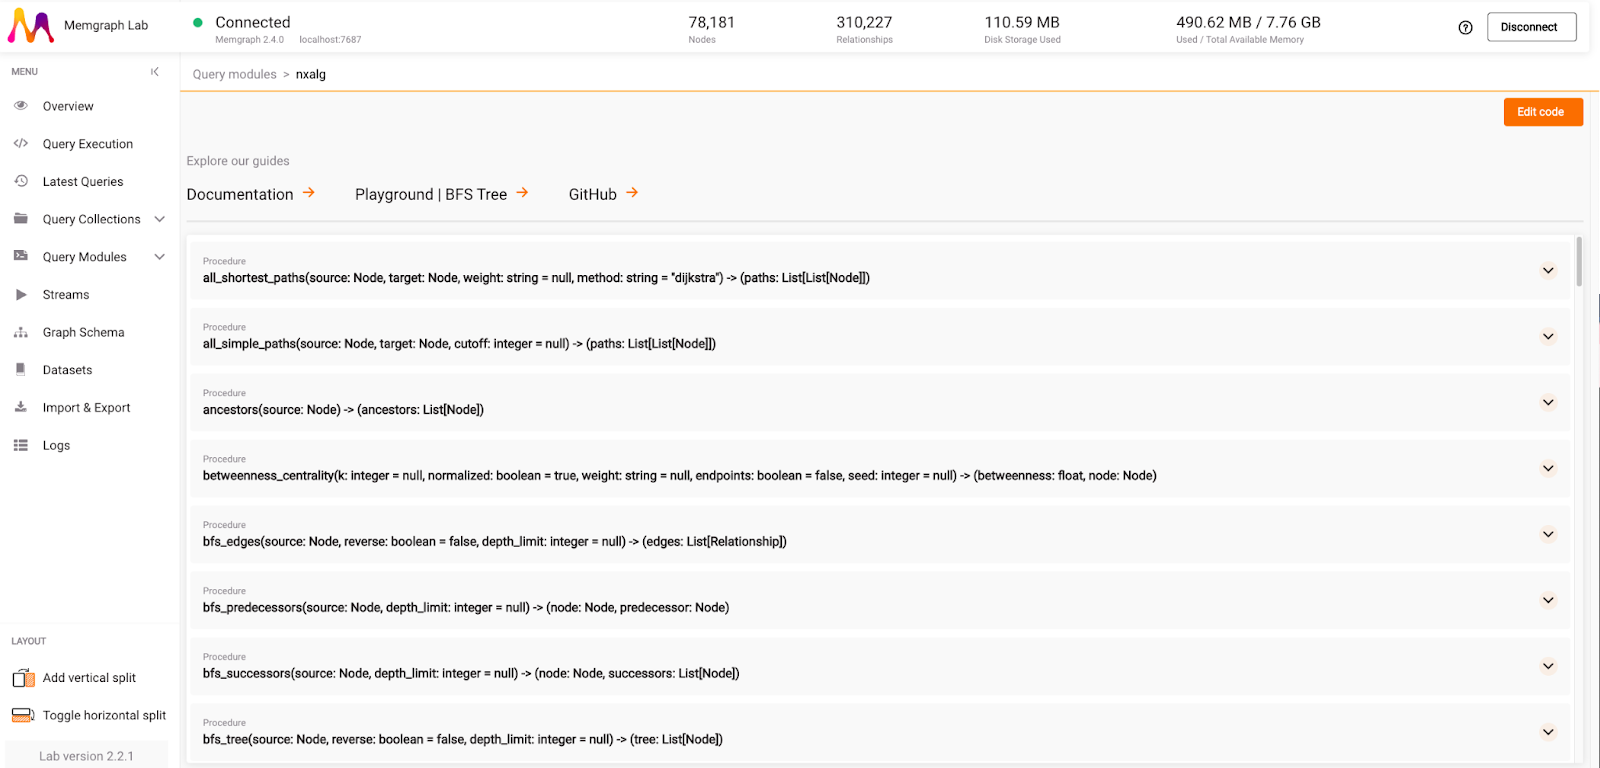
Memgraph is built in C++ and holds wrapper objects for Memgraph’s graph, called MemgraphGraph, MemgraphDiGraph, MemgraphMultiGraph, or MemgraphMultiDiGraph, depending on the graph type. Each of the wrapper objects optimizes the usage of NetworkX algorithms. With procedures from the nxalg query module within MAGE, a graph algorithm library, you can call most of the NetworkX algorithms with Memgraph graphs. If an algorithm you require isn’t available, the MAGE project is open-sourced, so you are more than welcome to contribute.
The library also holds implementation of the graph analyzer which utilizes the NetworkX library. All in all, even though you switch to an environment, all the familiar algorithms are still available.
Once you get used to query modules, utilize Memgraph’s graph algorithms as well. Most of the algorithms are implemented in C++ and heavily optimized to offer the best possible performance, meaning that in most cases, they outperform NetworkX algorithms.
Besides standard implementations of algorithms, Memgraph also offers dynamic graph algorithms, which allow you to analyze the data during ingestion instead of waiting for the long imports of massive datasets. If you have a data stream, you can consume it with Memgraph and trigger dynamic graph algorithm updates on each change. The dynamic graph algorithm approximates values locally around the updated node and propagates them through the whole graph. New values are received much faster, and that speeds up the decision time in time-sensitive use cases.
If the algorithms and procedures above don’t cover your use case, you can always implement your custom graph algorithms in Python by creating your own query modules and procedures.
Drawing large graphs with Memgraph Lab
NetworkX isn’t primarily a graph drawing package, but it does offer basic drawing with Matplotlib and an interface for Graphviz. If your research requires drawing graphs that consist of tens of thousands of nodes and relationships, you’ll probably experience several nervous breakdowns waiting for the visualization to complete. You can utilize other tools, but they all have limited usage, so not every tool will fit the use case you are working on, and there is no end to learning every new tool from scratch.
Memgraph Lab is a visual user interface that can also render graphs. It uses an open-source visualization library called Orb, which allows the implementation of visualizations in the frontend code. The visualizations are adaptable and customizable using a graph-style editor defined by the GSS language.
Check out how Orb and Memgraph Lab visualize 32,436 nodes and 122,920 relationships:
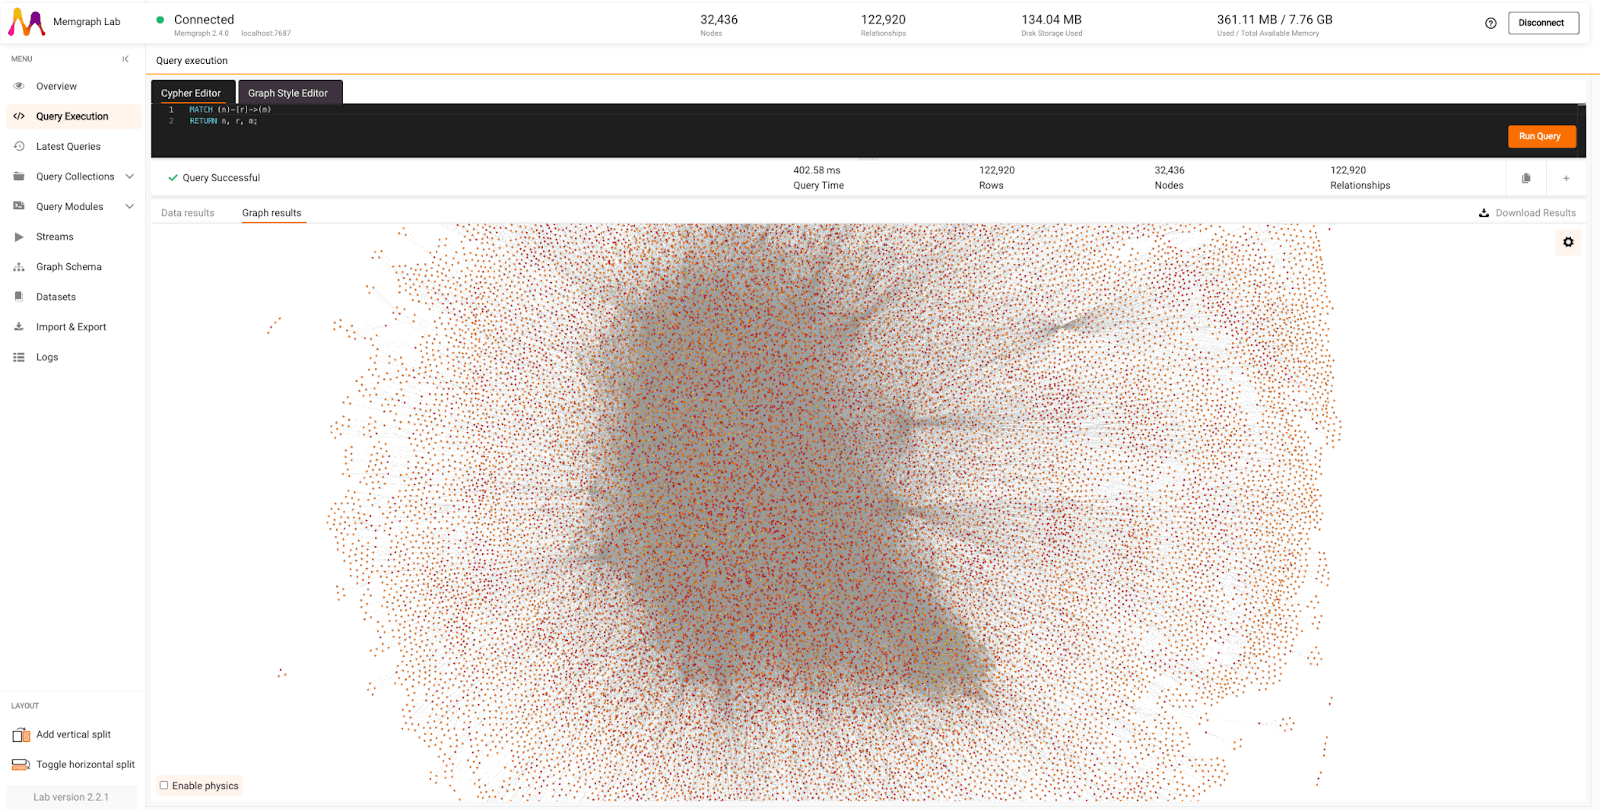
Graphs can also be interacted with. Clicking on graph objects previews their details, such as labels and properties. Nodes can be expanded to show relationships, collapsed to hide them, or dragged around to visualize the story you want the data to tell. If you need objects to interact, you can enable physics and adjust the collision or repulsive forces within the graph.
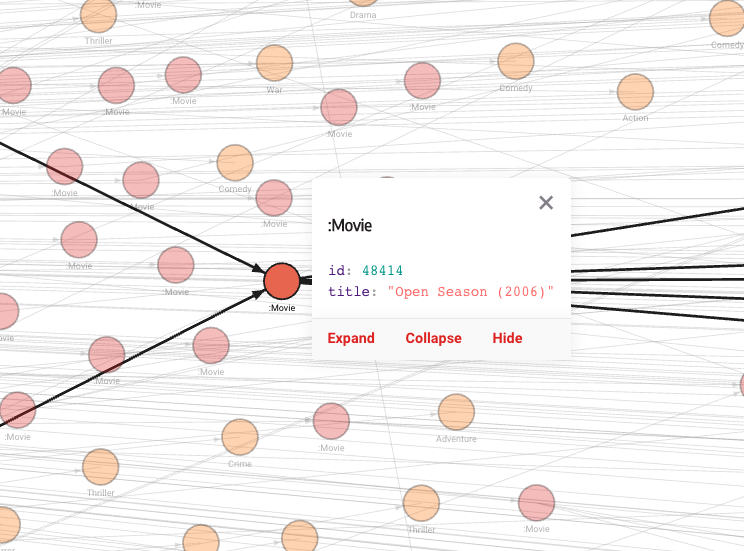
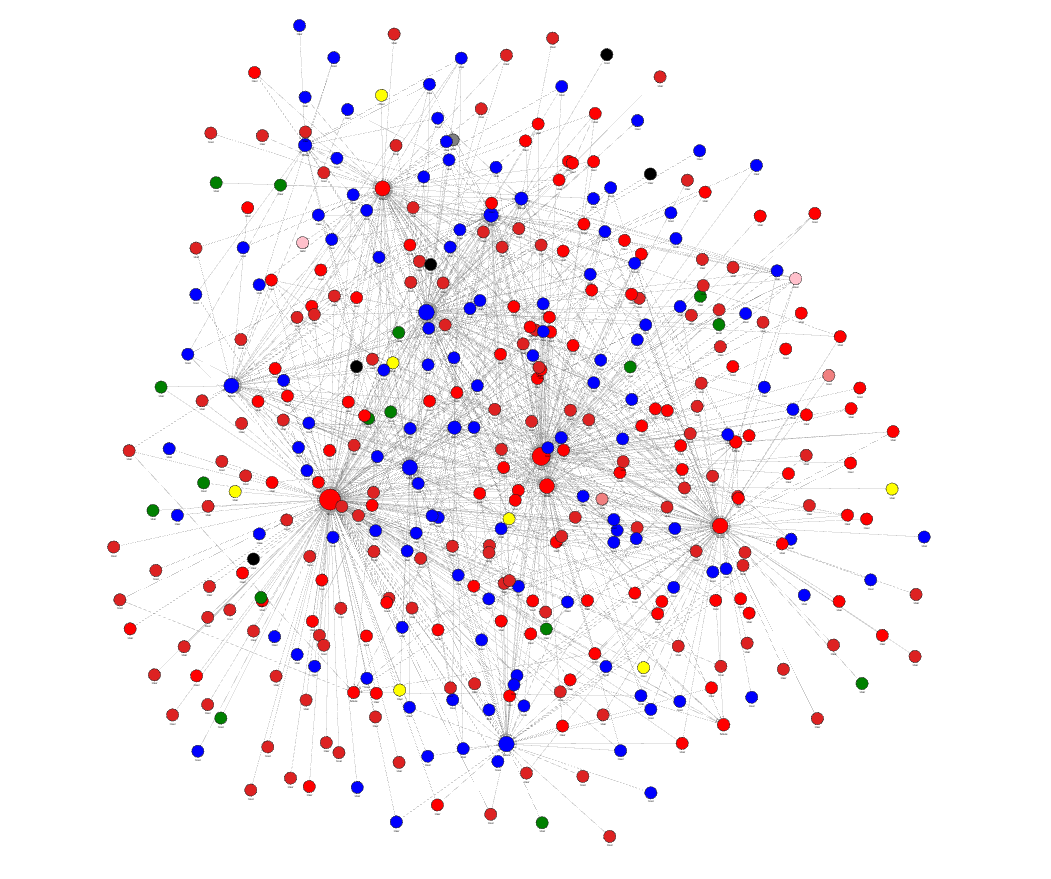
The above visualizations show the default style, but if you decide to tweak it with the Graph Style Script, you can create any kind of visualization that best represents your data. In the image below, nodes are of different sizes and colors, depending on their ranks and the communities they belong to.
Conclusion
If you like using NetworkX as a graph analytic tool required for your project but often need to reach for other tools, remember that Memgraph can speed up your development by being persistent in-memory data storage. You still get to use the NetworkX algorithms you are used to or explore other, more efficient, and dynamic algorithms. To learn why Memgraph's graph algorithms are faster than NetworkX, head over to the Memgraph vs NetworkX PageRank blog post. If default and implemented algorithms and procedures do not cover your use case, extend the Cypher query language with custom procedures.
In the end, a visualization tool is also a part of the Memgraph package, so there is no more need to explore other solutions. Feel free to shape the graph results so they reflect the insights you discovered in the best possible way. Once the project is ready for production, you only need to handle the Memgraph deployment to ship your app easily and show your hard work to other graphistas out there, without writing any boilerplate code! Read how to do that in our blog post.
If you are still not sure which tool to use, or you want to explore more, head over to the Memgraph for NetworkX developers website and learn by reading useful resources or listening to one of our courses.