Better Data Management: Get Solutions by Analyzing the Data Lineage Graph
Nobody should lose sleep from the stress of dealing with an unmanageable data landscape: finding the right report, or ensuring that the latest data source update won’t break every item that uses it. We might not be able to help you cope with such situations, but we’ve got tools to stop them from ever happening again.
Responsible management of your data infrastructure is only possible if you understand it well. Technical data lineage graphs lay out the data landscape of your organization, mapping the data entities and the dependencies between them. With the information from the data lineage, one can see the downstream effects of data updates and migrations, monitor if sensitive data is handled in compliance with the regulations, or discover critical nodes and redundant parts of the system and handle them accordingly.
Memgraph is a tool that helps organizations rise up to these challenges and maintain well-organized, reliable data infrastructure no matter their size.
Technical data lineage
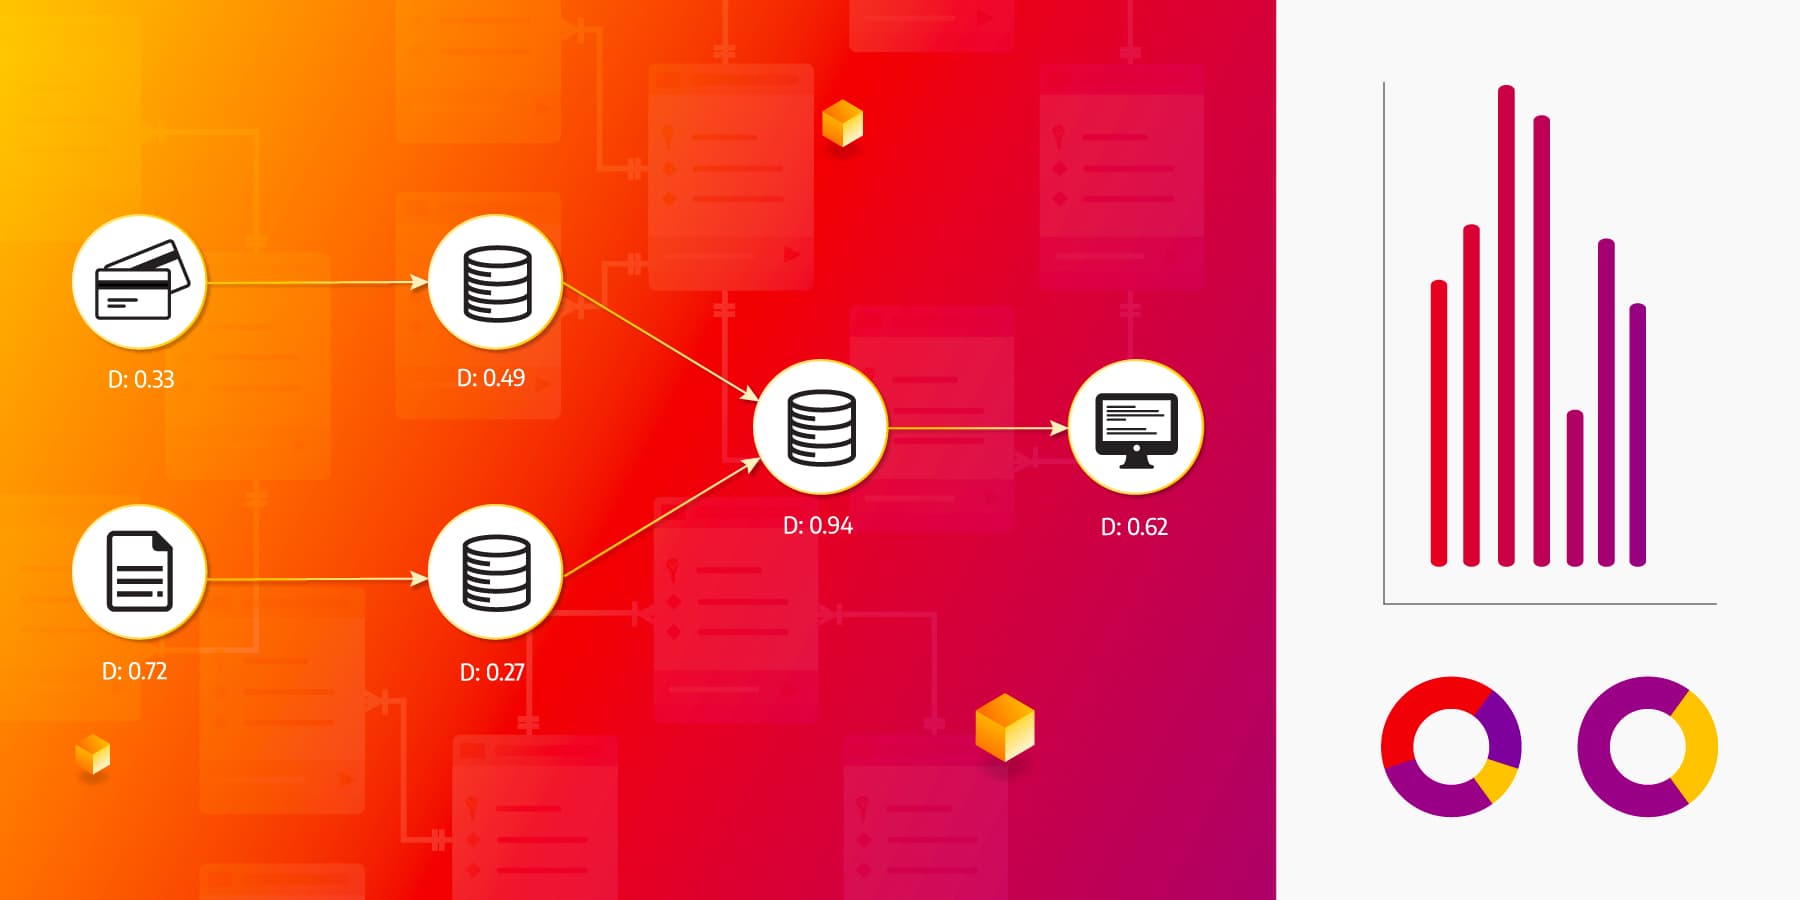
Technical data lineage is the blueprint of the software side of the data infrastructure. It contains detailed views of the data entities up to the column/property level and displays the dependencies between them, e.g. queries, transformations, or ETL jobs. Lineage data is usually stored in graph databases because of their data model, which directly represents dependencies as relationships so as to avoid expensive JOIN operations and simplify query logic.
With technical data lineage graphs, IT and data engineers can drill down into data sources and navigate through data pipelines to find what needs to be done so that business continues uninterrupted:
- analyze the downstream impact of updating data sources (e.g. when integrating acquisitions into existing infrastructure)
- find subsystems that are highly central to the system and thus require higher reliability
- discover redundancies and/or duplicate datasets in the data infrastructure
- track whether data is handled in accordance with regulations
Dynamic graph analytics
Visualization is the conventional way of displaying data lineage in an understandable form. All data lineage software comes with visualization features, and lineage graphs stored in Memgraph can easily be displayed with the Orb library. However, while visualization works well with simpler lineages, it doesn’t scale with complexity.
Graph analytics is the approach for complex lineages. Technical data lineages contain a large amount of information, especially in large organizations that have complex data landscapes. Therefore, analytics is a better fit for the tasks listed in the previous section: impact analysis, centrality measurement, redundancy finding, and data tracking. With Memgraph, you can apply these exact methods to tackle them:
- graph traversal: shortest paths, breadth- and depth-first search
- node centrality metrics
- node similarity metrics
Making changes to any part of the data landscape may affect its functionality; this is trackable by monitoring graph metrics. It is important to get accurate and fast feedback about each change, and this is where dynamic analytics come into play. They use algorithms that leverage the fact that localized changes do not alter the rest of the technical lineage graph, and save time by recomputing only these outputs that depend on the changed parts. Dynamic graph analytics are a highlight of Memgraph Platform’s MAGE library of graph algorithms, and running them is as easy as calling methods from your queries.
Get high-importance nodes
Knowing the relative importance of the data lineage graph nodes has two important applications: impact analysis and system reliability.
Impact analysis comes into the picture when one needs to assess the upstream and downstream impacts of any particular change, be it just a new data property, a migration, or major updates like merging data sources after acquisition. It enables IT to be proactive and timely alert stakeholders of any changes.
The reliability of data consumers depends in part on the reliability of data sources. In the lineage graph, sources whose data is used in many other places throughout the organization correspond to high-impact nodes. These sources must be highly reliable so that the uptime of the subsystems depending on them isn’t reduced.
Betweenness centrality is a common metric for determining the relative importance of all nodes in the graph. For a given node, it’s defined as the fraction of the shortest paths between all pairs of nodes that pass through it:
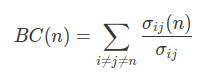 In the above expression, n is the node of interest, i, j are any two distinct nodes other than n, and σij(n) is the number of shortest paths from i to j (going through n).
With Memgraph’s dynamic betweenness centrality algorithm, you can get accurate and fast feedback on the importance of the nodes in the data lineage graph and use that information for impact analysis and reliability tasks.
Find redundancies
Organizations incrementally build their data landscape by gathering data and finding uses for it. As new data is obtained through record-keeping, tracking, mergers and acquisitions, and purchases from third-party sources, teams may use it in business processes while only being familiar with one part of the whole data system. This results in various redundancies popping up throughout the data landscape, with the following consequences:
- higher storage (cloud/hardware) costs
- complicated employee onboarding
- difficult maintenance and upgrades
To uncover redundancies, data engineers can capture metadata and build technical data lineage graphs to be analyzed. Memgraph’s MAGE graph analytics suite has a variety of algorithms for this task: dynamic node2vec, and three node similarity metrics: cosine, Jaccard and overlap similarity. While node2vec is more resource-intensive than the rest, our dynamic version cuts down on excess computation so that one can iterate faster through the task of removing redundancies.
Divide-and-conquer is another approach to this task. One can use community detection to divide the graph into parts and then identify problem areas more easily than on the entire graph. Again, MAGE’s got you covered – it comes with a speedy dynamic community detection algorithm.
Conclusion
Understanding the information in technical data lineage graphs is crucial for responsibly managing your organization’s data. As these graphs are packed with information, graph visualization doesn’t let you see the forest for the trees in bigger organizations.
However, graph analytics is a useful tool that’s able to rise to the challenges of scale. Aided by graph methods, it’s possible to do diverse tasks such as impact analysis, data reliability and fixing redundancies. Memgraph provides dynamic graph algorithms so that you don’t have to slow down.
All in all, Graph DBs are the optimal choice for data lineage tasks in general. If you want to find out more about how data lineage is represented in a graph databases and how Manta uses graph database features for fast and efficient data processing check out the Track Data Lineage With a Graph Database webinar.