Join the Dots: Data Lineage Is a Graph Problem. Here’s Why!
The most common kind of databases is relational DBs. Data in these systems is presented as a collection of two-dimensional tables comprised of rows and columns. Introduced in the eighties, they have proven versatile, but the relational model runs into shortcomings with data lineage problems.
It is essential for data lineages to map the dependencies between data entities in an organization. In practice, relational DBs are cumbersome and inefficient for working with lineages. Because they don’t have object types for dependencies, operations involving them are unnecessarily slow and complicated. Graph databases represent them with relationships, making operations simpler and quicker. For a bird’s-eye view on when to use graph DBs as opposed to relational, consult the Graph Databases vs. Relational Databases blog post.
How to model data lineage as a graph
The graphic below maps the data lineage for a financial organization – the relationships between several data subsystems maintained by it. Zooming in on the upper part of the image, we can see that historical reports are obtained by combining and transforming data from the customer application and credit card subsystems.
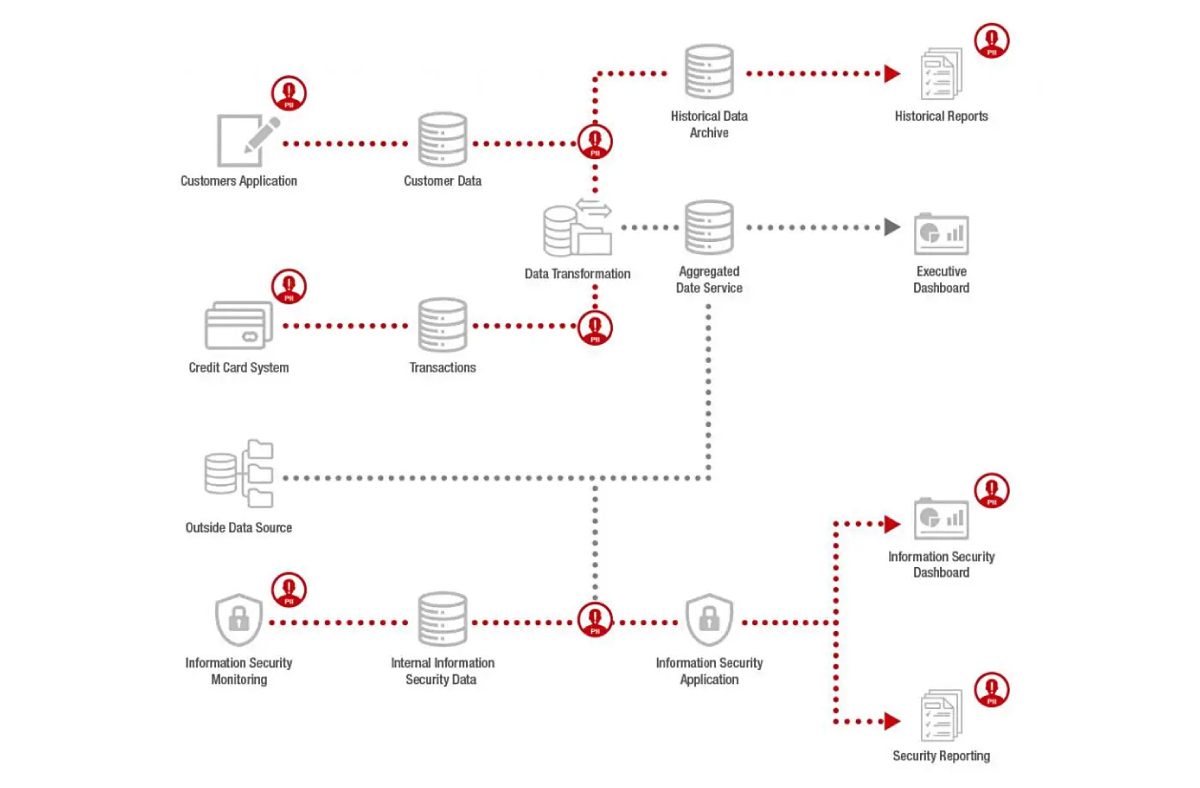
Image source: https://www.graphable.ai/blog/graph-data-lineage-graph-database/
Let’s now translate this into simple graph terms: nodes and relationships. Each data entity corresponds to a node, and one-way relationships connect them: in the top part of the graphic, the Customer Data and Transactions nodes lead to the Historical Data Archive node:
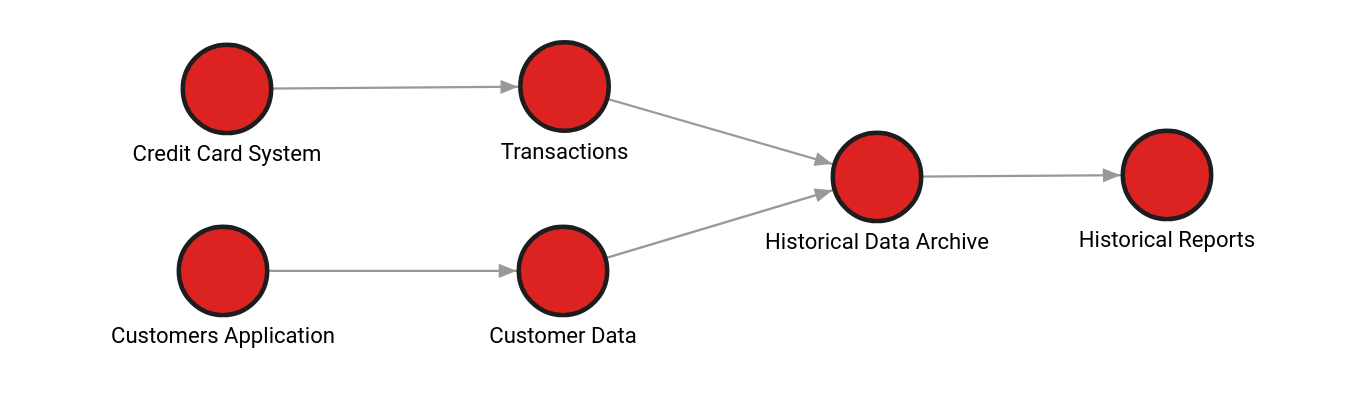
In the same manner, one can straightforwardly build the graph modeling of any data landscape.
The above approach allows you to unleash the power of graph technology on data lineage problems. However, why are graph DBs faster on data lineage problems?
Speed up runtime and development
The quintessential data lineage application is impact analysis. If you’re making changes to a data source, lineage lets you examine the data flow and find out which downstream data consumers will be affected.
Let’s compare the workflow of graph DBs with that of relational DBs in the following example.
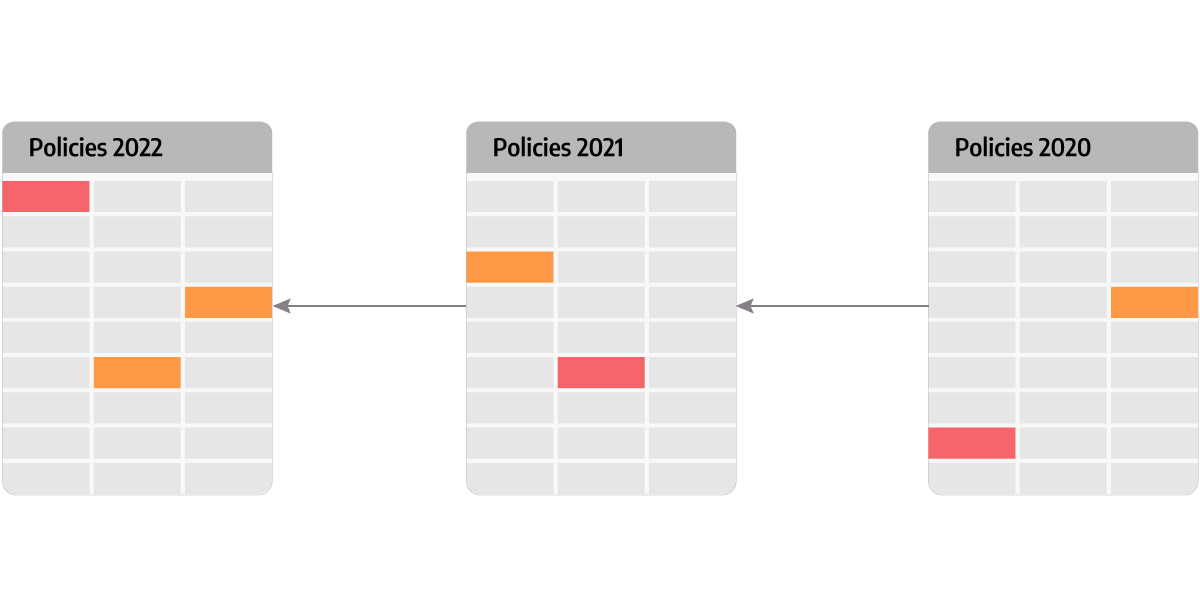
An insurance company keeps records of effective insurance policies by year. As policy periods may extend across the span of several years, a 24-month insurance policy issued at the beginning of 2020 will also need to be represented in the 2021 record, and each of these records can have further downstream dependencies.
Relational DBs organize data in tables comprised of rows and columns. Each record is represented by a row in the table below:
| ID | parent_ID | year | type |
|---|---|---|---|
| 0 | NULL | 2020 | effective_policies |
| 1 | 0 | 2021 | effective_policies |
| 2 | 1 | 2022 | effective_policies |
| ... |
Alternatively, graph DBs represent the lineage as a graph that closely matches the scheme we’ve got above:
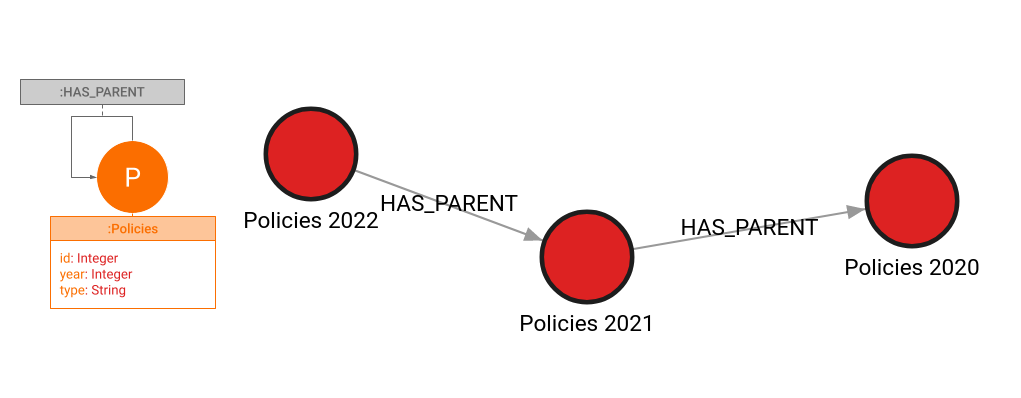
Let’s now compare the queries that compute which records might be affected by changes to the 2022 record:
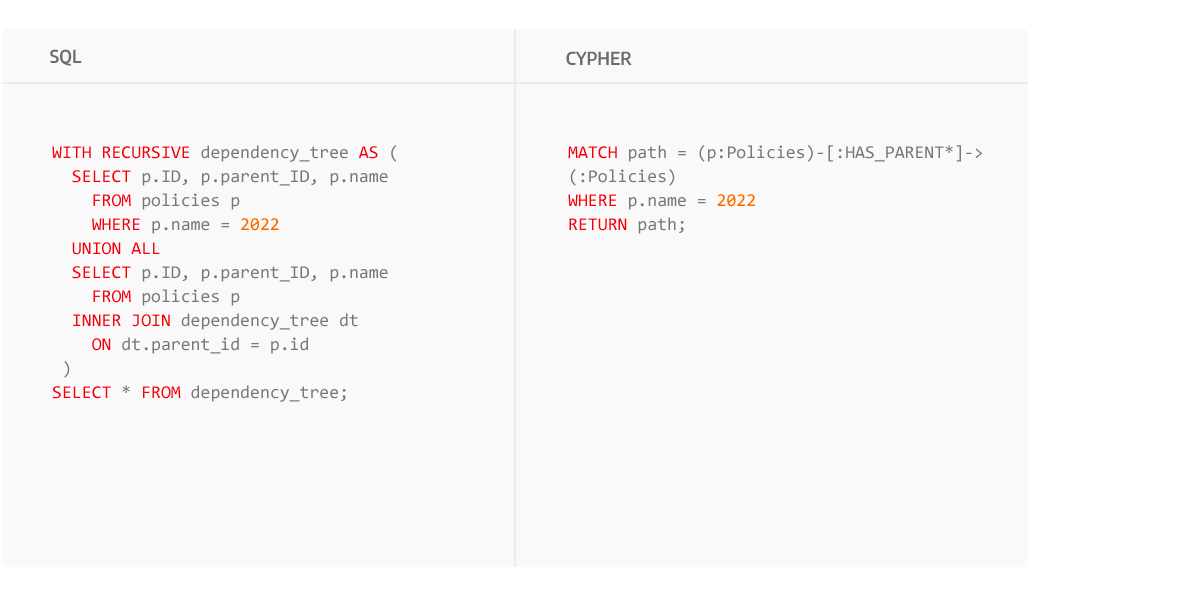
The SQL query is join-intensive – the number of JOIN operations is equal to the length of the dependency chain. What’s more, real-world data landscapes often have very long-range dependencies and thus each join’s O(log Nrows) complexity becomes prohibitive.
In graph DBs, data connections are first-class citizens and so they don’t have to be uncovered with joins. The complexity of traversing a connection is just O(1), making graph DBs the faster choice.
Besides being faster, graph DB queries are easier to understand and take less time to write and maintain. Queries are written in graph query languages (GQLs) whose syntax and semantics are similar to SQL’s, facilitating language-switching.
In a nutshell, systems can handle more data because database operations are faster with graph DBs than with relational DBs. Conversely, code complexity is lower, and teams can do more with what’s available.
A picture graph is worth a thousand words
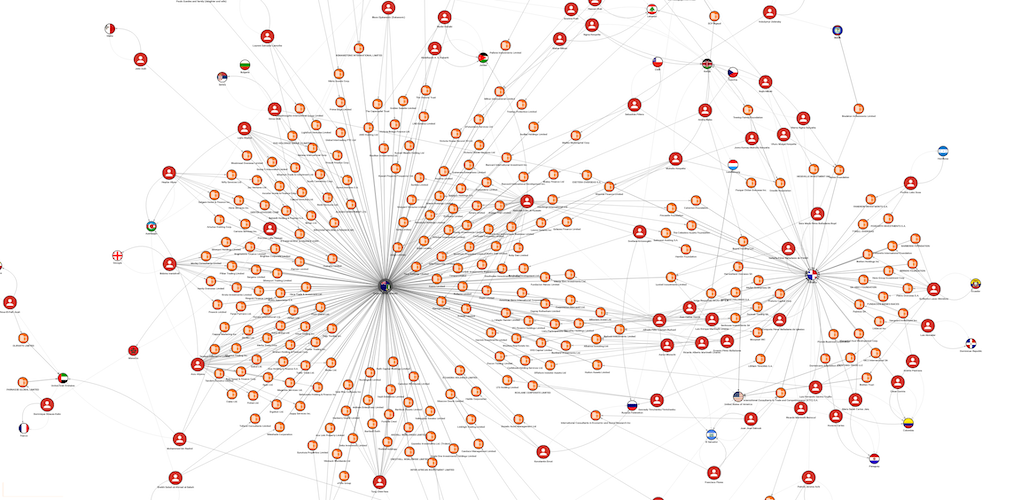
Data landscapes of large companies often have data stored in thousands of interdependent tables strewn across dozens of data systems in use by various organizations. The construction of the data lineage there is only a part of the puzzle, and the hard task is getting insights from such tangled lineages.
The adage “A picture is worth a thousand words” applies here – comprehending large amounts of information is easier when you have it displayed graphically. Furthermore, one doesn’t need to be experienced with the nuts and bolts of data tech to understand data lineages and extract actionable insights from them.
If the data lineage is modeled with graph DBs, it can be easily visualized. Graph analytics and theory are inherently visual endeavors and thus, there exists a wealth of tools for this task.
Memgraph developed the Orb graph visualization library on top of D3.js. Orb lets you visualize graphs in the browser with just a few lines of code, as you can see in this blog post. Alternatively, see it in action in Memgraph Playground which presents the feel of Memgraph with no need for installations, or download and install Memgraph Platform, then boot up Memgraph’s visual interface Memgraph Lab and run a few queries.
Why graph tech?
Data lineage is all about connections between data entities and thus it naturally lends itself to graph technology. Choosing graph databases for data lineage projects will speed DB operation up and drive code complexity down, and you will be able to easily get insights from data with graph visualization tools.
Graph databases are the solution for data lineage projects because of the above facts and their advantages outweighing the cost of adopting new technology. If you want to find out more about data lineage is represented in a graph database and how Manta uses graph database features for fast and efficient data processing check out the Track Data Lineage With a Graph Database webinar.
Using Memgraph for your data lineage project? We’re happy to talk about your use cases and requirements. Feel free to reach out to us on Discord!