
Twitch Streaming Graph Analysis - Part 2
Introduction
This blog is divided into three parts, depending on the part of the application we are building:
- Part 1: data source and backend implementation
- Part 2: frontend implementation
- Part 3: streaming data from Kafka cluster
If you still haven't, you can read the previously published Part 1 and then continue reading this post. Otherwise, you can use the already implemented backend. In this part, you are going to create React application and visualize general statistics and some interesting insights from the Twitch dataset. All implementation that will be mentioned in this part of the blog you can find in the frontend folder of the project.
Create a React App
Let's figure out how to visualize all the collected data. First, you have to create React app which, will work with our
Flask application. Install Node.js which
enables you to use npx command for creating a React app. Place yourself in
the project root folder and run:
npm install -g create-react-app@3.4.1
npm init react-app frontend --use-npm
cd frontend
npm start
Now at http://localhost:3000 you can see a simple React app. You need to configure
the React app to work well with the Flask server. In package.json from the
frontend folder, add a line at the end of the file: "proxy": "http://localhost:5000" This will tell React app to redirect any requests it
receives on its port 3000 to port 5000, where the backend is implemented. We
will use Semantic UI to build the webpage, so you have to do a few more
things before dockerizing the React app. Run the following commands:
npm uninstall semantic-ui semantic-ui-css
npm install @craco/craco @semantic-ui-react/craco-less semantic-ui-less --save-dev
After that, update your package.json with:
{
  "scripts": {
    "start": "craco start",
    "build": "craco build",
    "test": "craco test",
    "eject": "craco eject"
  }
}
Create craco.config.js in the frontend folder and paste the following content
in it:
module.exports = {
  plugins: [{ plugin: require('@semantic-ui-react/craco-less') }],
}
Create a semantic-ui/site folder in the src folder and then copy the entire
node_modules/semantic-ui-less/_site folder content to src/semantic-ui/site.
Also, create a theme.config file in the src/semantic-ui/ folder and then
copy the file node_modules/semantic-ui-less/theme.config.example to
src/semantic-ui/theme.config.
Update the theme.config file to:
/*******************************
            Folders
*******************************/

@themesFolder : 'themes';
@siteFolder  : '../../src/semantic-ui/site';

@import (multiple) "~semantic-ui-less/theme.less";
@fontPath : '../../../themes/@{theme}/assets/fonts';
If it's not already installed, run: npm install semantic-ui-react --save-dev
Now you can use Semantic UI components, such as Button (don’t forget to paste
all the imports):
import logo from "./logo.svg";
import "./App.css";
import "semantic-ui-less/semantic.less";
import { Button } from "semantic-ui-react";

function App() {
  return (
    <div className="App">
      <header className="App-header">
        <img src={logo} className="App-logo" alt="logo" />
        <p>
          Edit <code>src/App.js</code> and save to reload.
        </p>
        <Button>Click me</Button>
      </header>
    </div>
  );
}

export default App;
How to Dockerize a React App?
You need to add a few new lines in our previously created project's
docker-compose.yml
file. At the end of the file, add:
react-app:
    build: ./frontend
    volumes:
      - ./frontend:/app
      - /app/node_modules
    ports:
      - "3000:3000"
    depends_on:
      - twitch-app
    networks:
      - app-tier
You should also create a Dockerfile in the frontend folder like this:
# pull official base image
FROM node:14.17.5-alpine

# set working directory
WORKDIR /app

# add `/app/node_modules/.bin` to $PATH
ENV PATH /app/node_modules/.bin:$PATH

# install app dependencies
COPY package.json ./
COPY package-lock.json ./
RUN npm install --silent
RUN npm install react-scripts@3.4.1 -g --silent

# add app
COPY . ./

# start app
CMD ["npm", "start"]
You have to copy package.json into the container. The best way
to have all dependencies installed is to copy package.json file from
frontend folder.
All node modules will then be correctly installed in the container and npm start will run your React app. Node modules volume was added so that all
packages don't have to be installed each time you build your project.
All that is left to do is to create a .dockerignore file in the frontend
directory:
node_modules
build
.dockerignore
Dockerfile
Also, make a little change in package.json for the proxy settings:
"proxy": "http://twitch-app:5000"
The backend as a Docker service on
port 5000 called twitch-app (this is defined in the docker-compose.yml
file) and that's why you have to make that change. The project structure now looks like this:
|   docker-compose.yml
|
+---backend
|   |   app.py
|   |   models.py
|   |   twitch_data.py
|   |   requirements.txt
|   |   Dockerfile
|   +---import-data
|   |       chatters.csv
|   |       moderators.csv
|   |       streamers.csv
|   |       teams.csv
|   |       vips.csv
|
+---frontend
|   |   .dockerignore
|   |   craco.config.js
|   |   Dockerfile
|   |   package.json
|   |   package-lock.json
|   +---node_modules
|   +---public
|   +---src
|
+---memgraph
|   |   Dockerfile
|   +---query_modules
|   |       twitch.py
|   +---mg_log
|   +---mg_lib
Now you can hit docker-compose build from your root project folder and
docker-compose up after that. First memgraph-mage will run and then
twitch-app. After that react-app will be run. Now you can make requests from
your frontend.
Frontend Implementation with React and D3.js
Create folder components in your src file. Here you will make your components
which you’ll use as puzzles for your web application. Let's make a little part
of the puzzle, and add node and edge counters to the webpage by making fetch requests in
Counter.js.
You have to make a request depending on the props forwarded from the parent component, like in the code below.
fetch() {
fetch("/" + this.props.count)
.then((res) => res.json())
.then(
(result) => {
this.setState({
isLoaded: true,
counter: result[this.props.count],
});
},
(error) => {
this.setState({
isLoaded: true,
error,
});
}
);
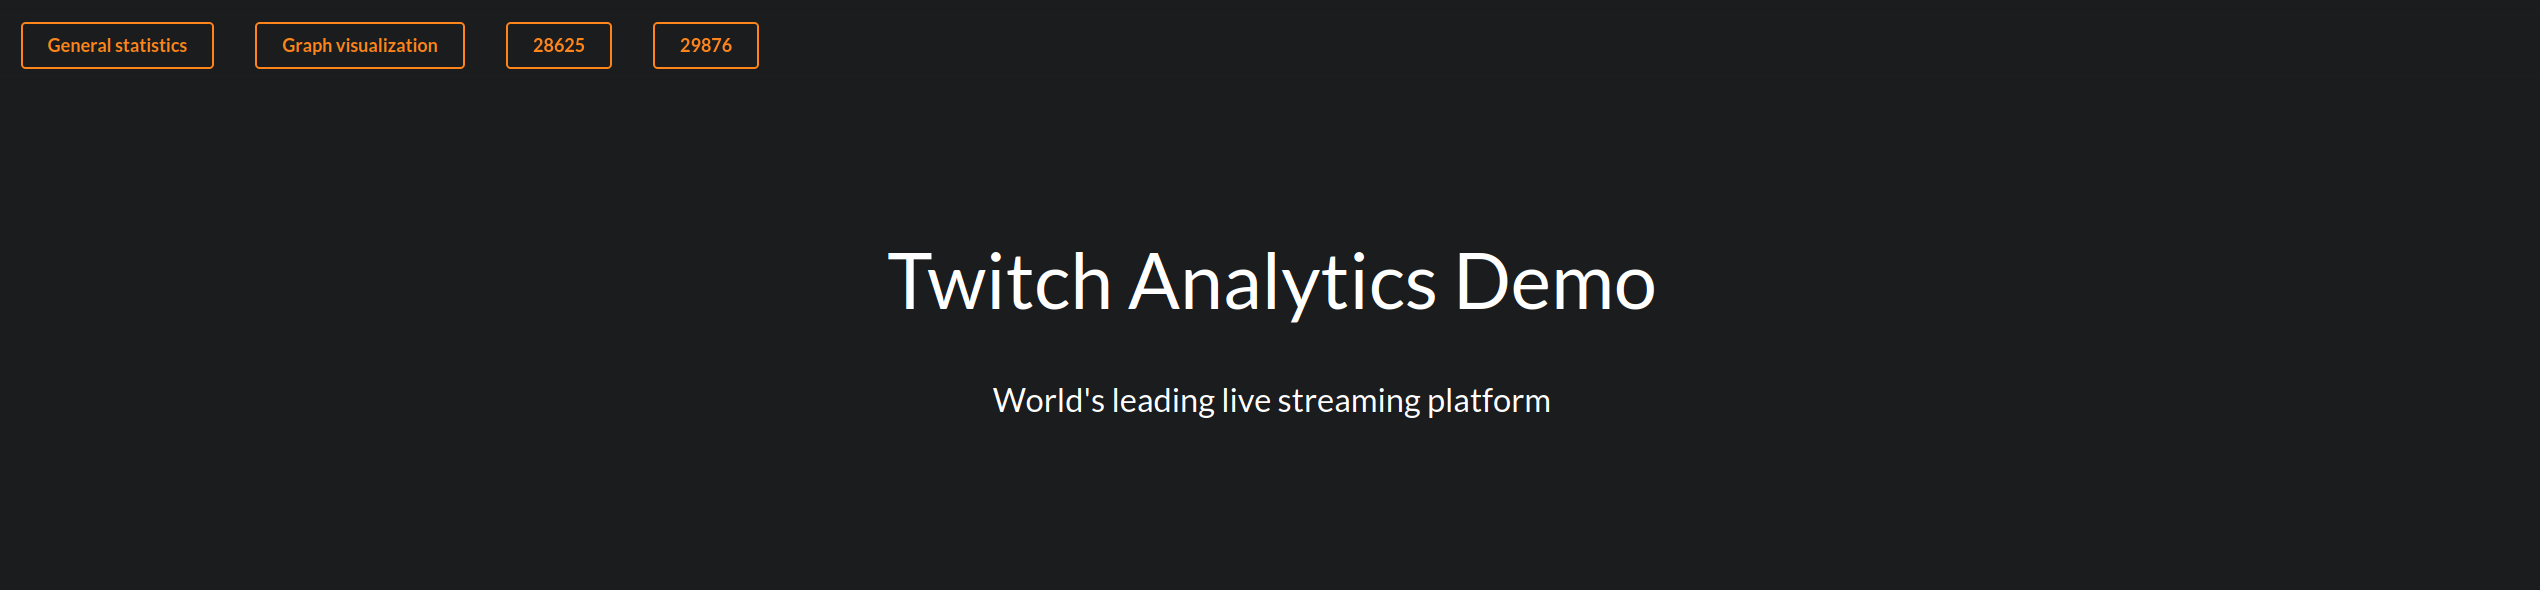
}On the left side, you can see the number of nodes, and on the right the number of edges in your database.
For game statistics, you have to fetch top games from the backend server:
fetchData(number) {
fetch("/top-games/" + number)
.then((res) => res.json())
.then(
(result) => {
this.setState({
isLoaded: true,
games: result.games,
players: result.players,
});
},
(error) => {
this.setState({
isLoaded: true,
error,
});
}
);
this.setState({
numOfGames: number,
header: "Top " + number + " games",
});
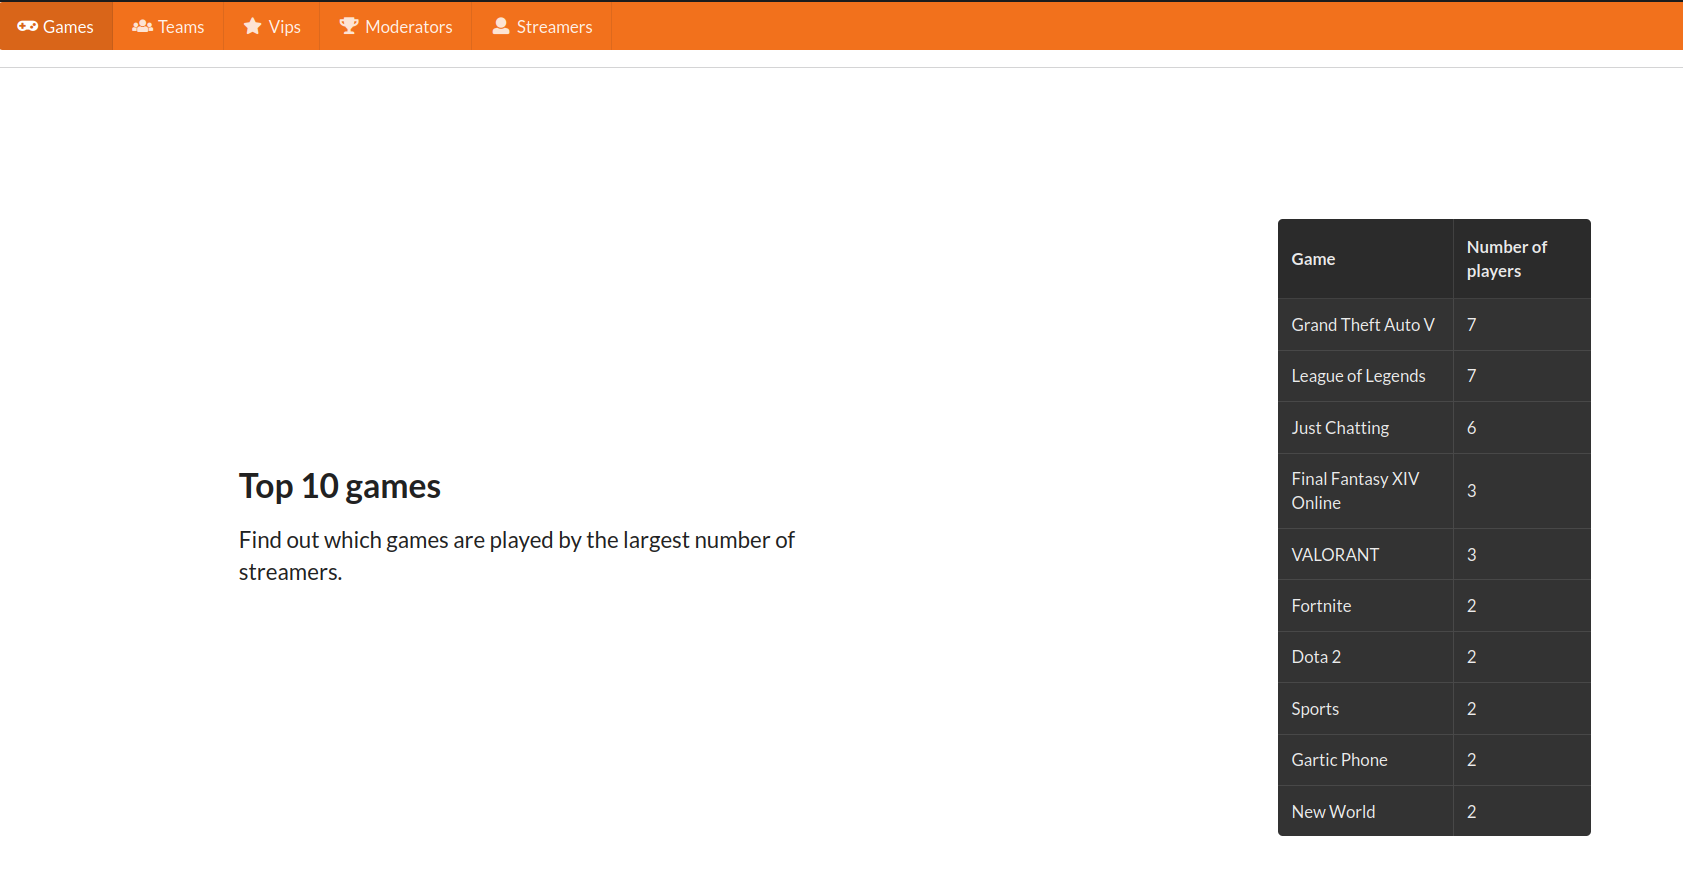
}On the right side, you can see the table showing you the names of the games and the number of players that are playing that game (in the dataset).
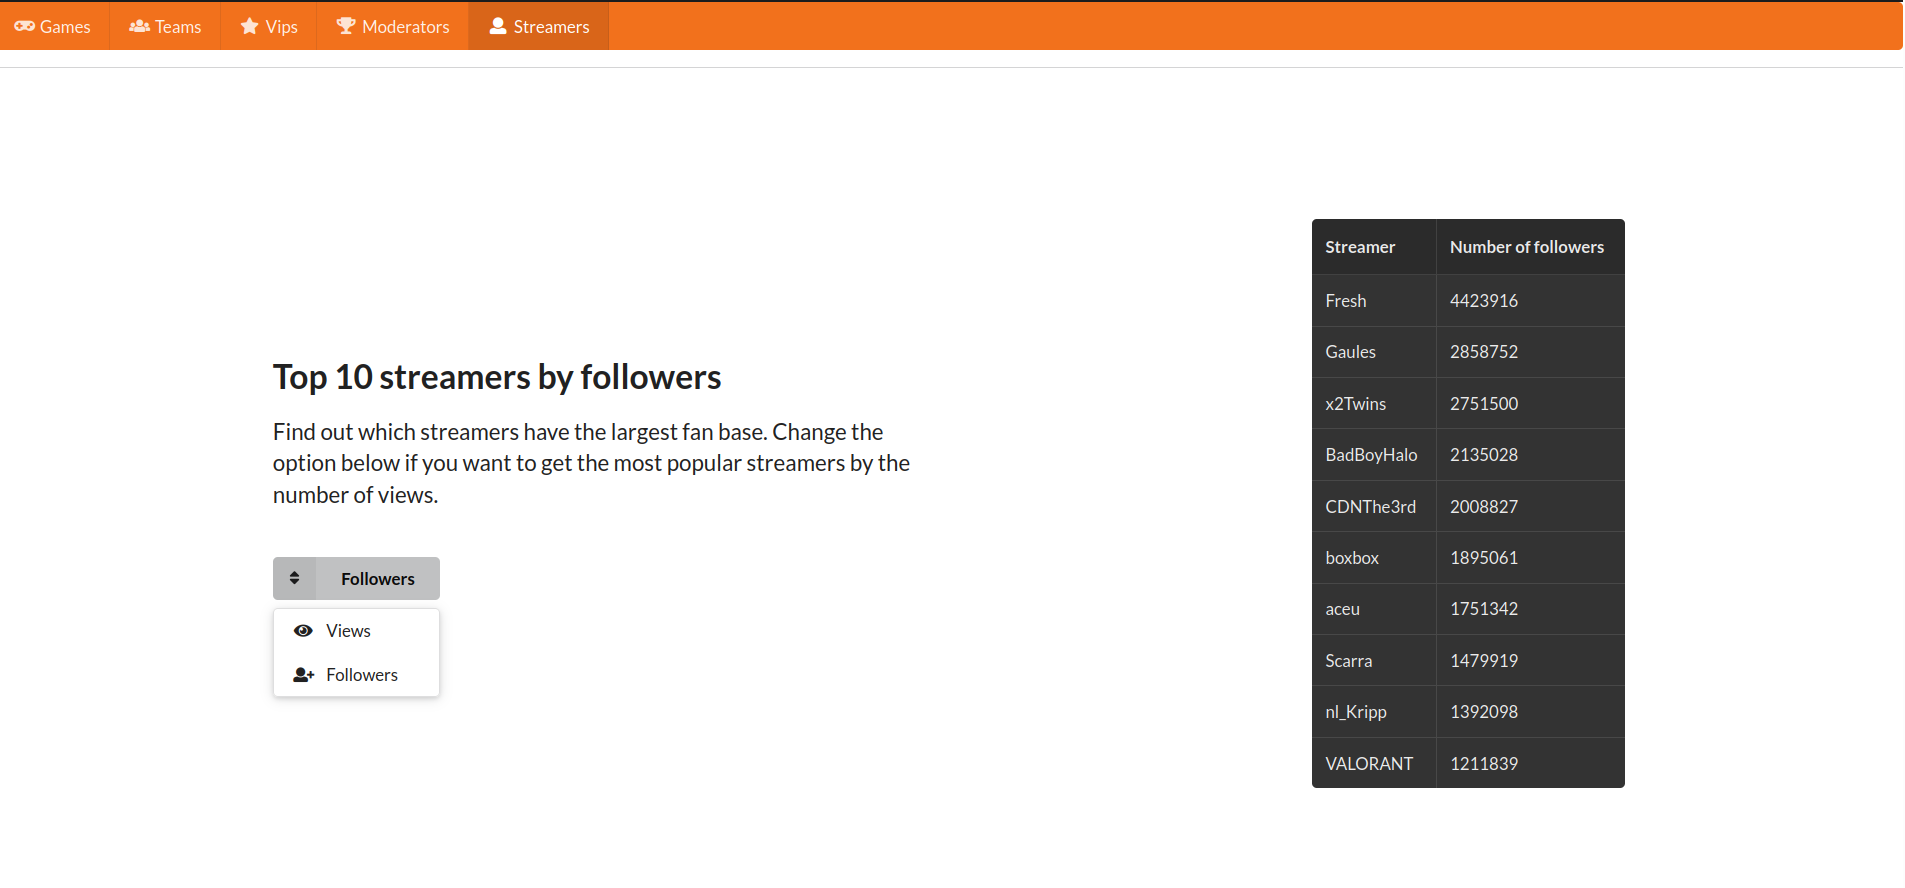
You can fetch top teams, VIPs, and moderators in a similar way. For streamers, you can rank them by the number of followers or number of views. Because of that, you create a dropdown menu from where you can choose the way of ranking.
Let’s talk about graph visualization a bit more. Here, you can use
D3.js, a JavaScript library for manipulating documents based on data. You need to set everything
up so that you can draw the graphs using D3.js. Create a folder hooks in
src folder and create useD3.js file (hooks are usually named with prefix
"use").
import React from "react";

import * as d3 from "d3";

export const useD3 = (renderGraph) => {
  const ref = React.useRef();

  React.useEffect(() => {
    renderGraph(d3.select(ref.current));

    return () => {};
  });

  return ref;
};
This will be your custom hook to allow D3.js to interact directly with the
DOM. You can take advantage of the useRef and useEffect hook to link D3.js
with the svg element that has been created, and specifies when your D3.js
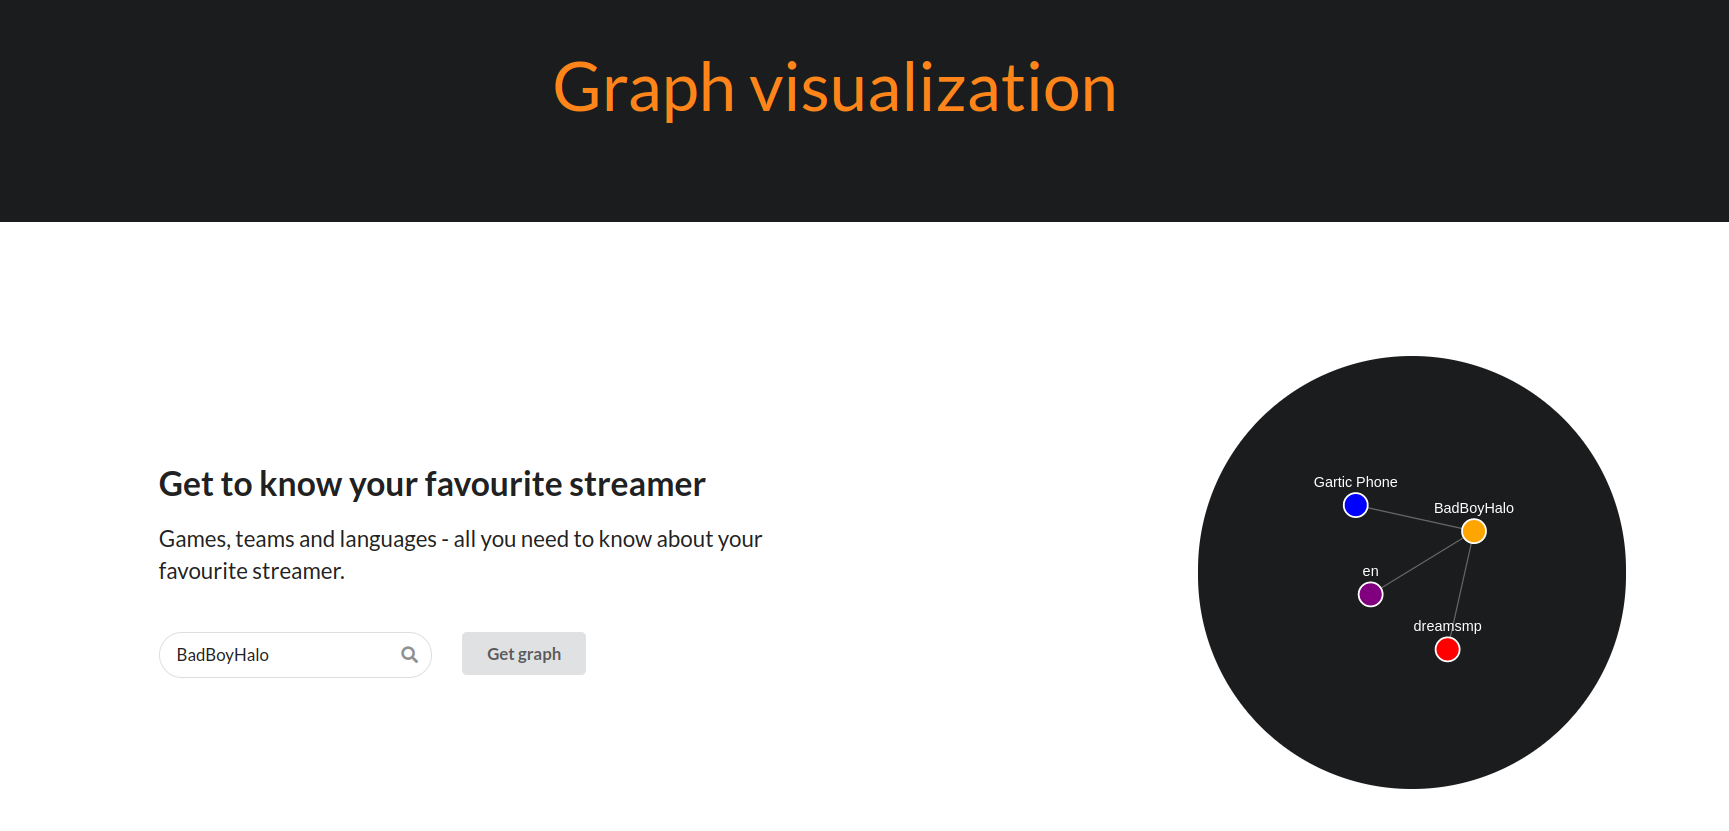
function should be executed. Don’t forget to import d3. Now you can render the
graph using a custom hook useD3.js. Check the
Graph.js
component to see how the graph can be drawn. Using that component you can get
information about your favorite streamer - its teams, games, and languages, like
in the image below.
It is also possible to search all streamers who are playing some game in a
certain language. Using the same Graph.js component, you get:
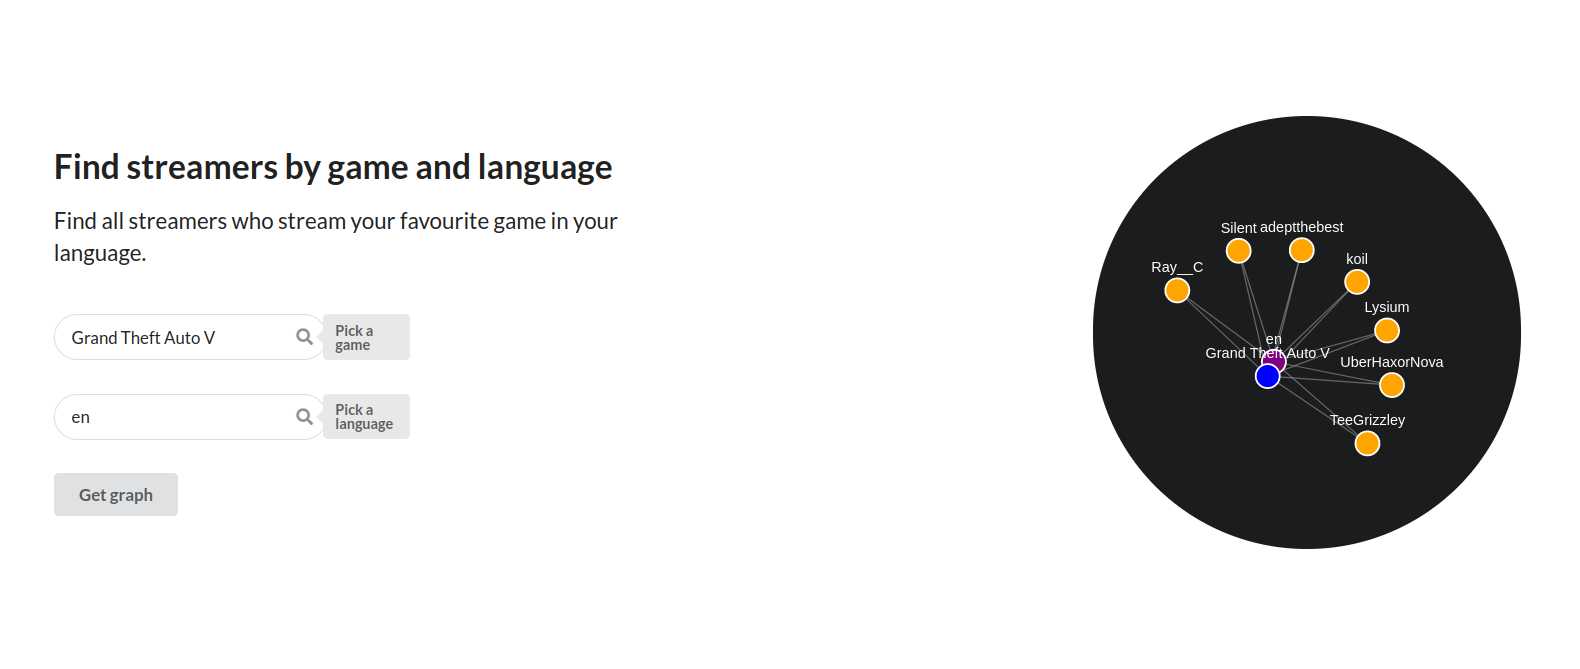
Feel free to play with nodes and their forces by dragging them around. In the
end, check out the powerful MAGE query modules -
PageRank and Betweenness Centrality and visualize
your data in a pretty cool way with D3.js. For calculating PageRank, there is an API GET
request in the
backend
server and in the frontend, that data is being fetched from the
PageRank.js
component.
  fetchData(){
    fetch("/page-rank")
      .then((res) => res.json())
      .then(
        (result) => {
          this.setState({
            isLoaded: true,
            nodes: result.page_rank,
          });
        },
        (error) => {
          this.setState({
            isLoaded: true,
            error,
          });
        }
      );
  }
While PageRank results are being calculated, you will see your results loading.
After the results are loaded, they are drawn with the graph component
GraphPR.js,
which uses D3.js. Next to the graph, you can see the results table with the
names of the streamers and their calculated rank.
![]()
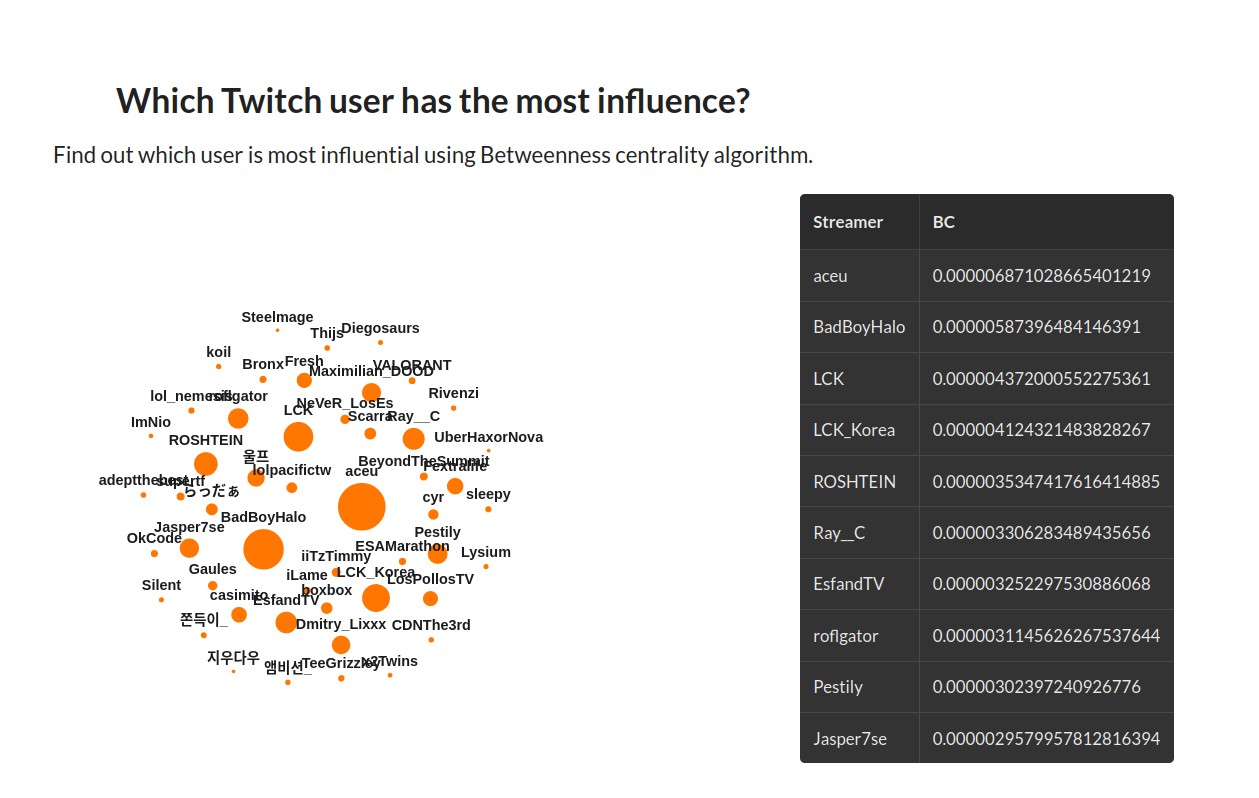
You can see the refresh button above the visualized graph. It will be used later on in Part 3 of the tutorial, when you'll learn how to stream the data using Kafka. You will stream new chatters of the user BadBoyHalo and see how his rank improves with a larger number of chatters in his network. Besides PageRank, you can calculate the betweenness centrality and visualize it as on the image below.
Conclusion
And that's it for now! I hope you got everything right, but if you have any questions or want to give some feedback, feel free to join our Discord Community Server. Make sure to follow up on the last part of this blog, where you can learn how to tackle your streaming data with Kafka and analyze it with Memgraph in real-time.