
Improve Load CSV
LOAD CSV is a Cypher clause used for importing data from comma-separated values or CSV format. The clause reads row by row from a CSV file, binds the contents of the parsed row to the variable you specified, and populates the database if it is empty or appends new data to an existing dataset. Memgraph supports the Excel CSV dialect, as it's the most common one.
LOAD CSV clause is especially useful when you need to import a lot of data from systems that support export to CSV files, for example, when switching from antiquated identity and access management systems.
Hat-trick of problems with LOAD CSV
As mentioned above, LOAD CSV works by loading rows one by one and binding content to the variable specified in the query.
There are a few things to keep in mind when the LOAD CSV Cypher query is executed, as they directly influence the occurrence and resolution of memory consumption and performance issues during the import with this query.
Delta objects
From Memgraph 2.7, the default storage mode is called IN_MEMORY_TRANSACTIONAL. Transactional mode is fully ACID compliant and built upon a research paper called Fast Serializable Multi-Version Concurrency Control for Main-Memory Database Systems. In short, in the transactional storage mode, Memgraph creates in-place modification of the object, i.e., vertex. For each corresponding change, one delta object is created. Delta objects can be used to restore the database to an older state. Each transaction stores all the changes which happened during its lifetime. Transactions can’t see changes made by other transactions, and they operate in isolation. Delta objects also ensure atomicity, consistency, and durability.
What’s important to note is that for each change inside the transaction, an additional object is created, the size of which is 104B.
One transaction
When the data is imported using the LOAD CSV clause, importing one file is done as one transaction. This means that Memgraph will hold a lot of memory inside this one transaction for the whole system to work properly and for Memgraph to support multi-version concurrency control by creating deltas.
A lot of data
Usually, when importing data to move from other systems, a CSV file can contain a lot of rows, up to a few million, and each file can contain up to a few GBs of data. A lot of data means a lot of changes happening from Memgraph’s point of view.
Bigger picture
As you might have guessed by now, a combination of the above points can make Memgraph “stressed” under such conditions.
Another important factor is that importing large amounts of data usually happens at the start-up of the database. During that time, it’s highly unlikely that any analytical transaction will take place as there is no data inside Memgraph. This would mean that ACID compliance is not really necessary for data import, and that is why Memgraph 2.7 enables you to import data without experiencing memory issues and performance degradations by switching off the creation of unnecessary delta objects before starting the data import. This new storage mode is called analytical mode, which is a solution to the above problems.
A lot of data can be imported with the LOAD CSV clause, which means a lot of delta objects are created during one transaction. But Memgraph still consumed more than the appropriate amount of memory, and the performance was poor. Memory consumption would skyrocket even when importing small files of 100MBs, and performance would degrade when importing CSV files with many columns. And in some cases, those two worlds collided.
Many users reported these problems, and we started tackling them one by one. The problems could be split into two categories - those considering memory and others considering performance.
Profiling memory
We have dealt with performance issues, memory consumption, and weird bugs before. Some of those issues we solved using profilers. By profiling queries, we found out that one performance degradation was caused by switching to different libraries. And considering the weird bugs we dealt with, one of the more notorious ones was in the form of an overflowing timeout error caused by integer and stack overflow made by stronger assumptions on hardware.
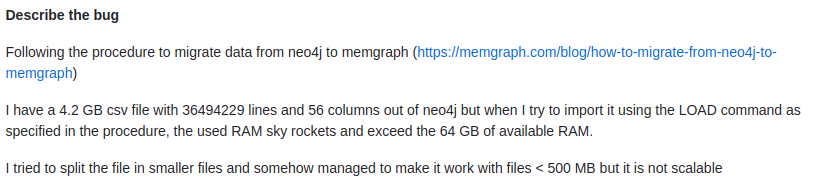
Describe the bug
Working on improving import with the LOAD CSV clause started with one user reporting an issue on the GitHub repository, as seen in the picture below. The issue was that importing data from a CSV file consisting of a lot of properties and a lot of rows made the memory consumption skyrocket.
The debugging journey begins
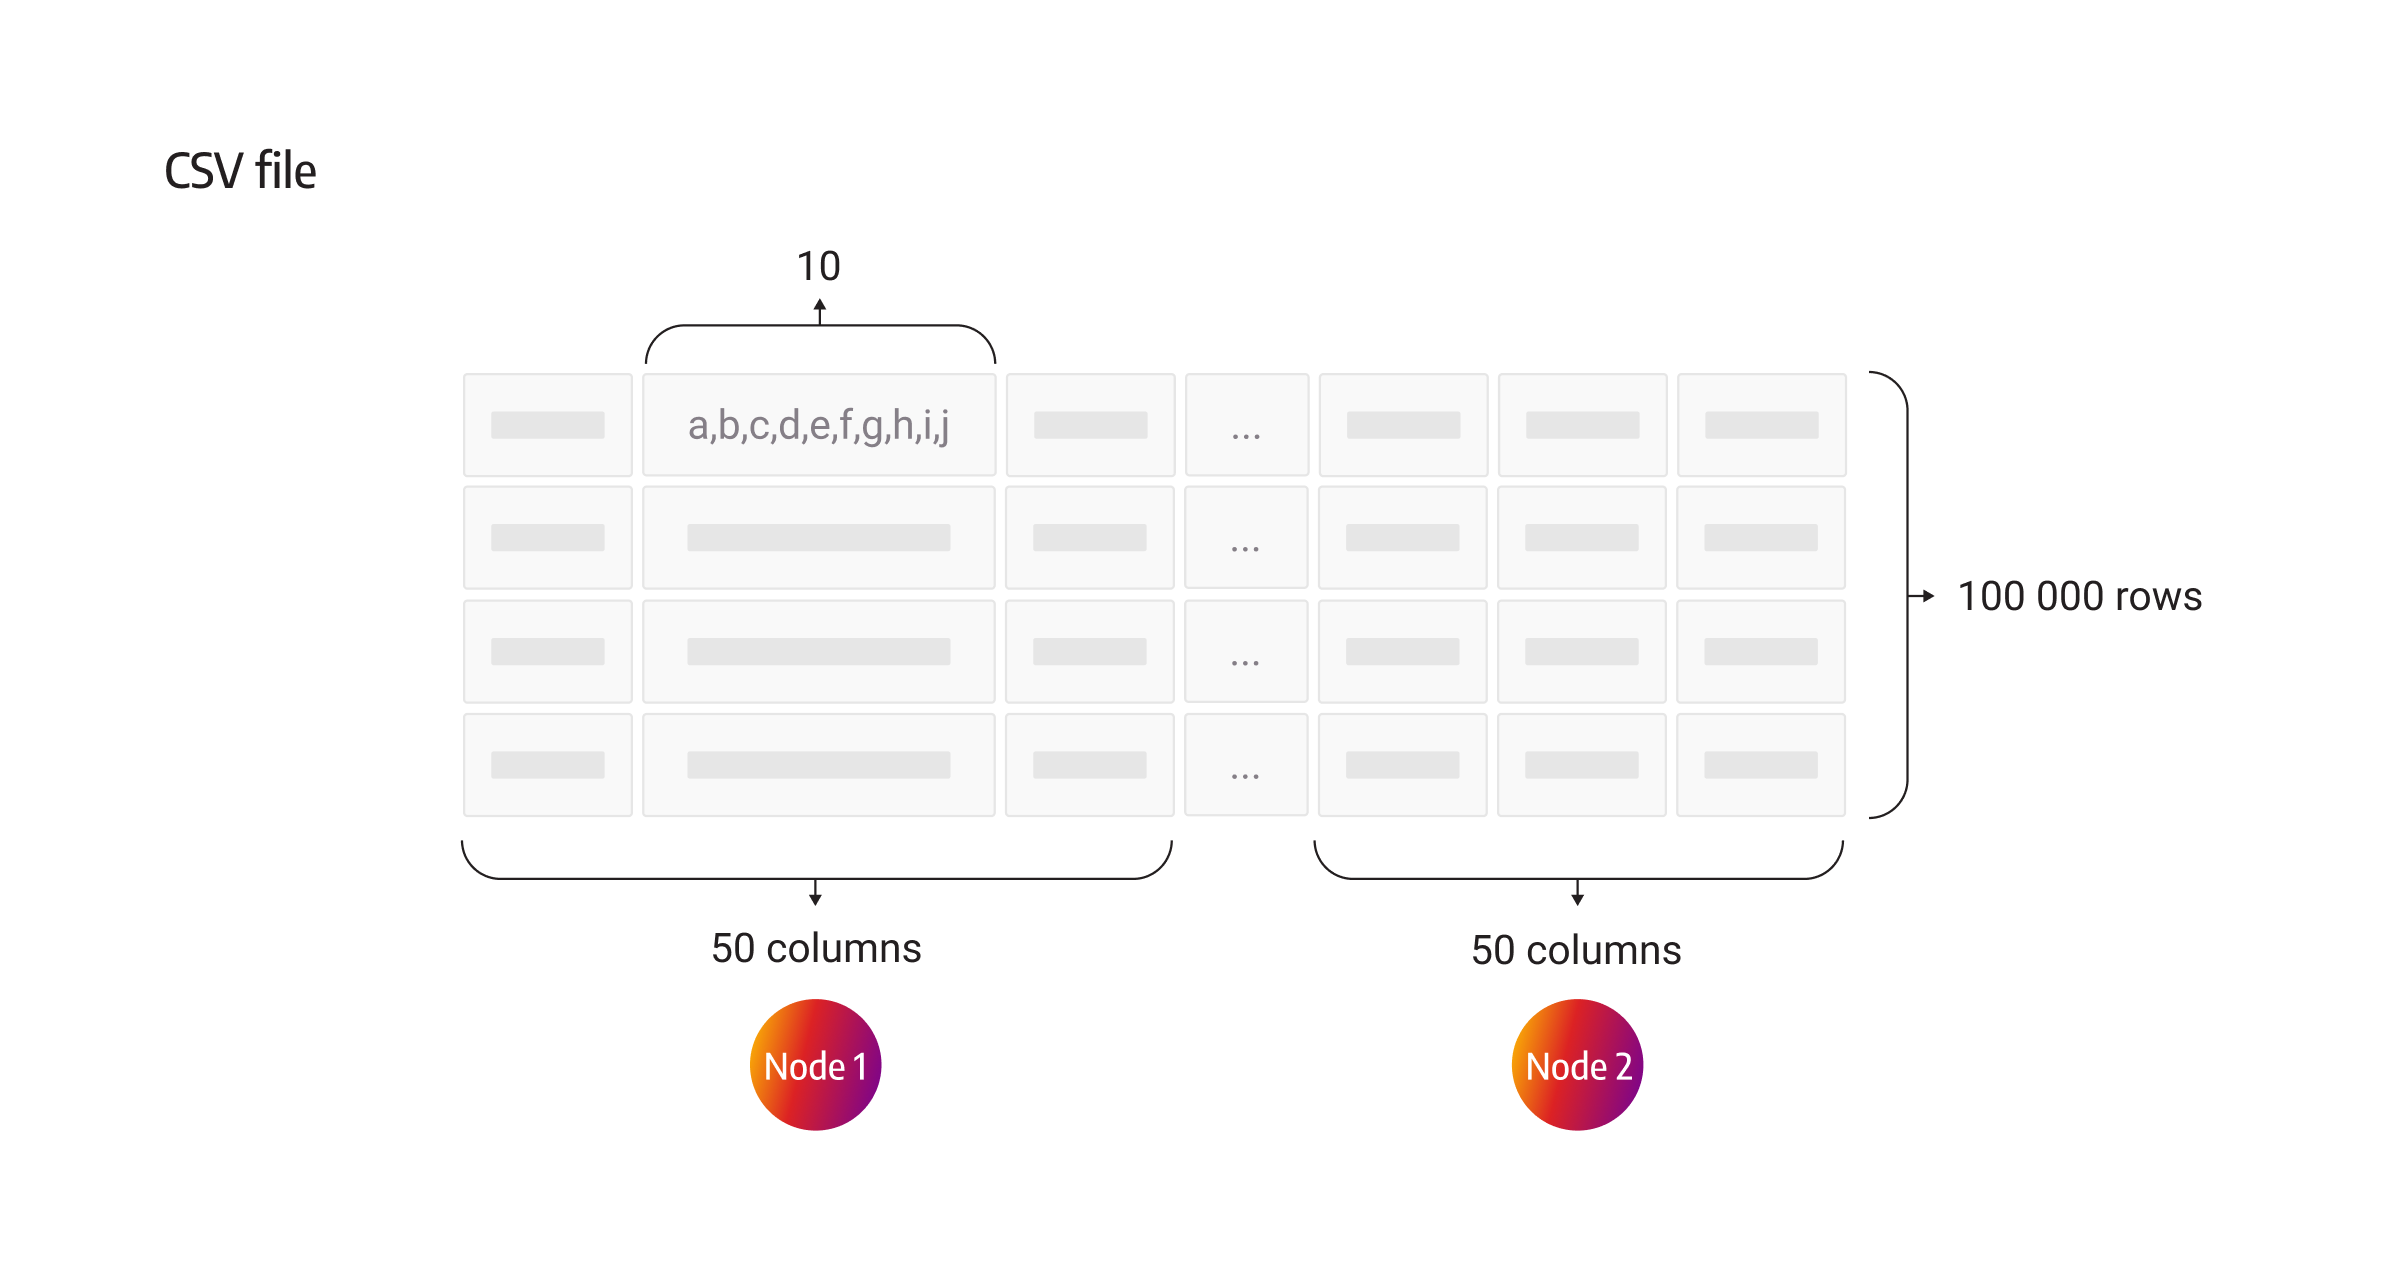
Without thinking about how Memgraph works under the hood, how do you start debugging an issue like this? I started by recreating the issue and by trying to import a dataset similar to the user’s. The number of node or relationship properties doesn’t need to be identical; the datasets just need to be “fat” across node and edge dimensions (a lot of properties for both nodes and relationships). The first test dataset consisted of 100 columns; each column had 10 random characters. It was “fat” only across the node dimension. I was lucky to catch a bug on the first try. The first 50 columns in the row represented the properties of the first node, second 50 columns represented the properties of the second node.
By running the following query (truncated to avoid repetition), Memgraph crashed my laptop with 16GB of RAM:
LOAD CSV FROM ".../generated_file.csv" NO HEADER DELIMITER "," as row

CREATE (a:Node1 {arg0:row[0], arg1:row[1], … ,arg49:row[49]}),

(b:Node1 {arg50:row[50], arg51:row[51],...,arg99:row[99]});
Profiling with massif
A massif heap profiler is a tool from the Valgrind suite of tools designed to help debug and profile programs. Massif is specifically designed to help understand the memory usage of a program, monitoring the program's memory consumption by intercepting calls to the memory allocation and deallocation functions (such as malloc, free, and realloc).
As the program runs, massif keeps track of how much memory is being allocated and released and what parts of the program are responsible for those allocations. Massif is able to intercept calls to memory allocation and deallocation functions by using a feature of the operating system called dynamic binary instrumentation (DBI). DBI allows Valgrind to insert its own instructions into the running program at runtime without modifying the original program's code. Valgrind uses this feature to replace the standard memory allocation and deallocation functions (such as malloc, free, and realloc) with its own versions.
In the end, massif generates a detailed text report that shows the memory usage for each function in the program. In theory, it can help to pinpoint where exactly memory is being used.
By using massif, I successfully created this beautiful image which was of no help at all. All this image shows is that memory is being allocated for importing 100 000 rows with 100 columns and it really skyrockets. But the first part about detecting bugs is being able to replicate them, and this helped a lot.
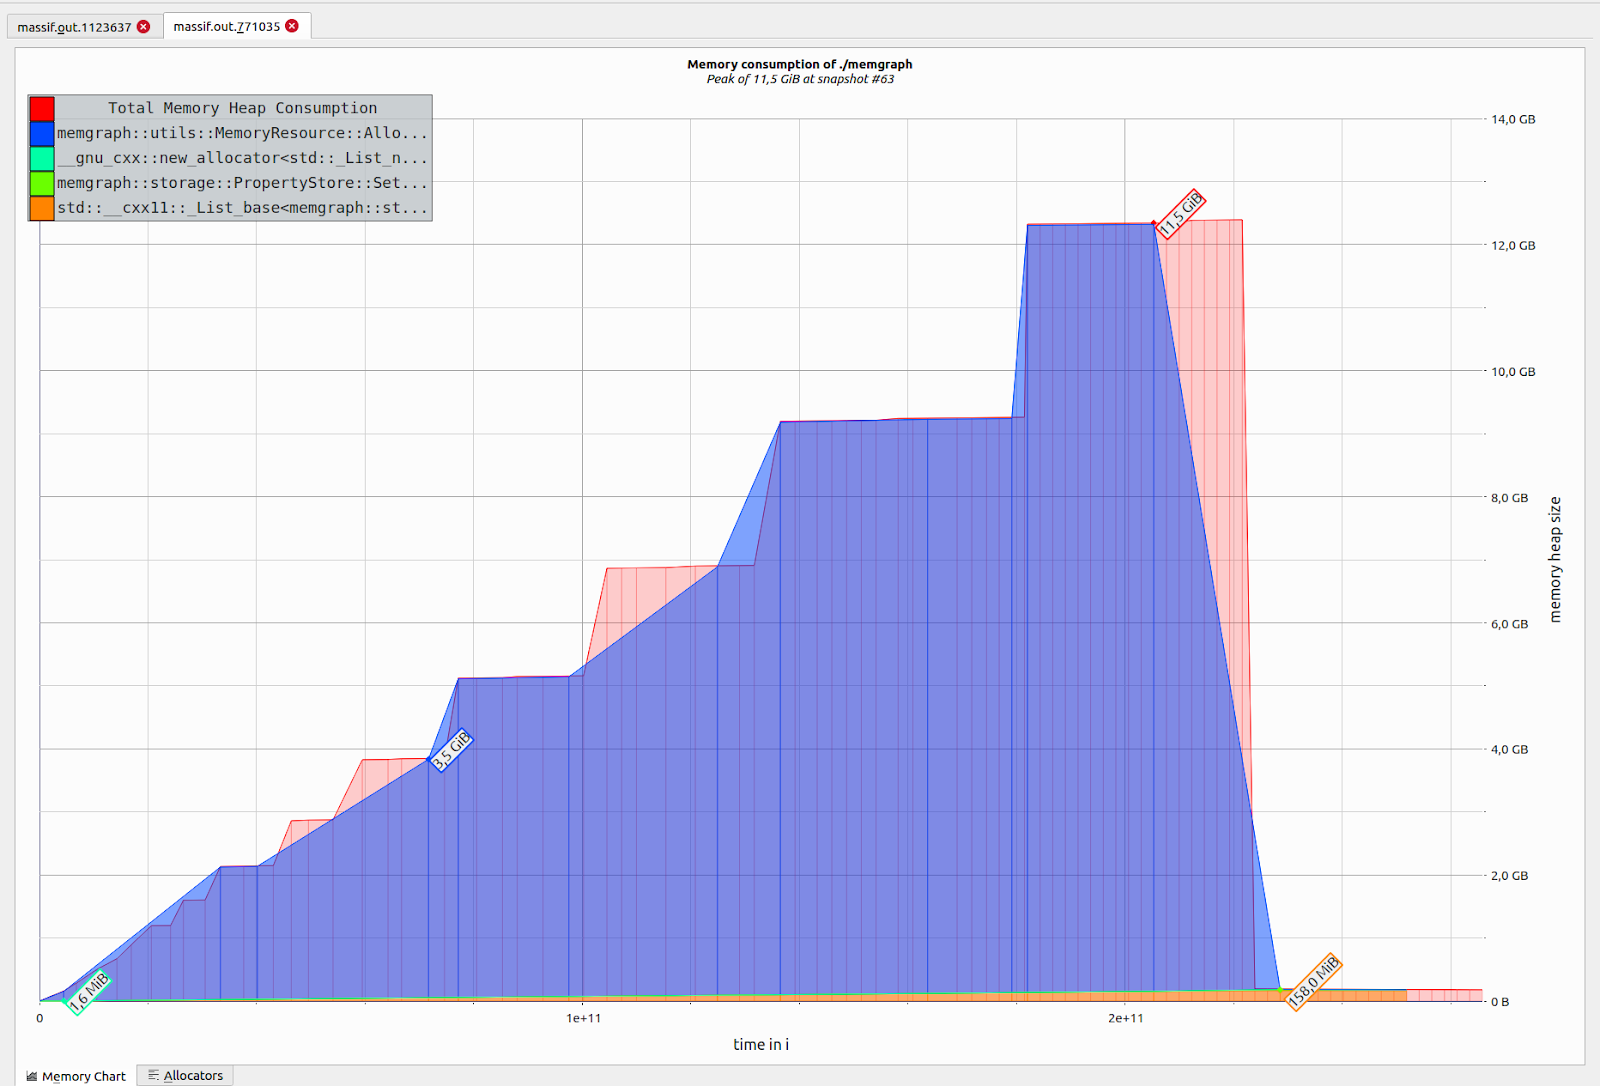
The image shows that 11.5GB of RAM was used until I had to kill Memgraph and that the CSV file was not completely imported. After going through massif’s logs (which were massive), I was able to find a line that used most of the memory.
TypedValue Visit(Identifier &ident) override { return TypedValue(frame_->at( symbol_table_->at(ident)), ctx_->memory); }
This ctx_->memory is MemoryResource (memory allocator) we are using in Memgraph.
But why does this problem occur, specifically with that line mentioned above? And what does the line actually do? To understand this, we need to know how memory allocations work in Memgraph.
The story of 2 resource allocation methods
Memgraph has its own allocators implemented - MonotonicBufferResource and PoolResource.
Simply put, MonotonicBufferResource is meant to be used for fast allocations in situations when memory is used to build objects which are then released all at once at the end of the MonotonicBufferResource’s lifetime. The thing is, the end of its lifetime is at the end of the query, so you have to be careful when to use this resource. Furthermore, in the beginning, MonotonicBufferResource uses std::pmr::new_delete_resource() from the standard library to allocate the initial block of memory, and it also uses it later on for the extension of its memory. Whenever MonotonicBufferResource gets a call to allocate new memory, it doesn’t check if there is freed memory in previously allocated blocks. It only checks whether there is unused memory in the current block. It’s important to remember that memory is not reused. We will touch upon this later.
Another allocator is PoolResource. PoolResource consists of smaller Pool objects and manages them. Pool objects consist of Chunks, and each Chunk of even smaller parts, Blocks.
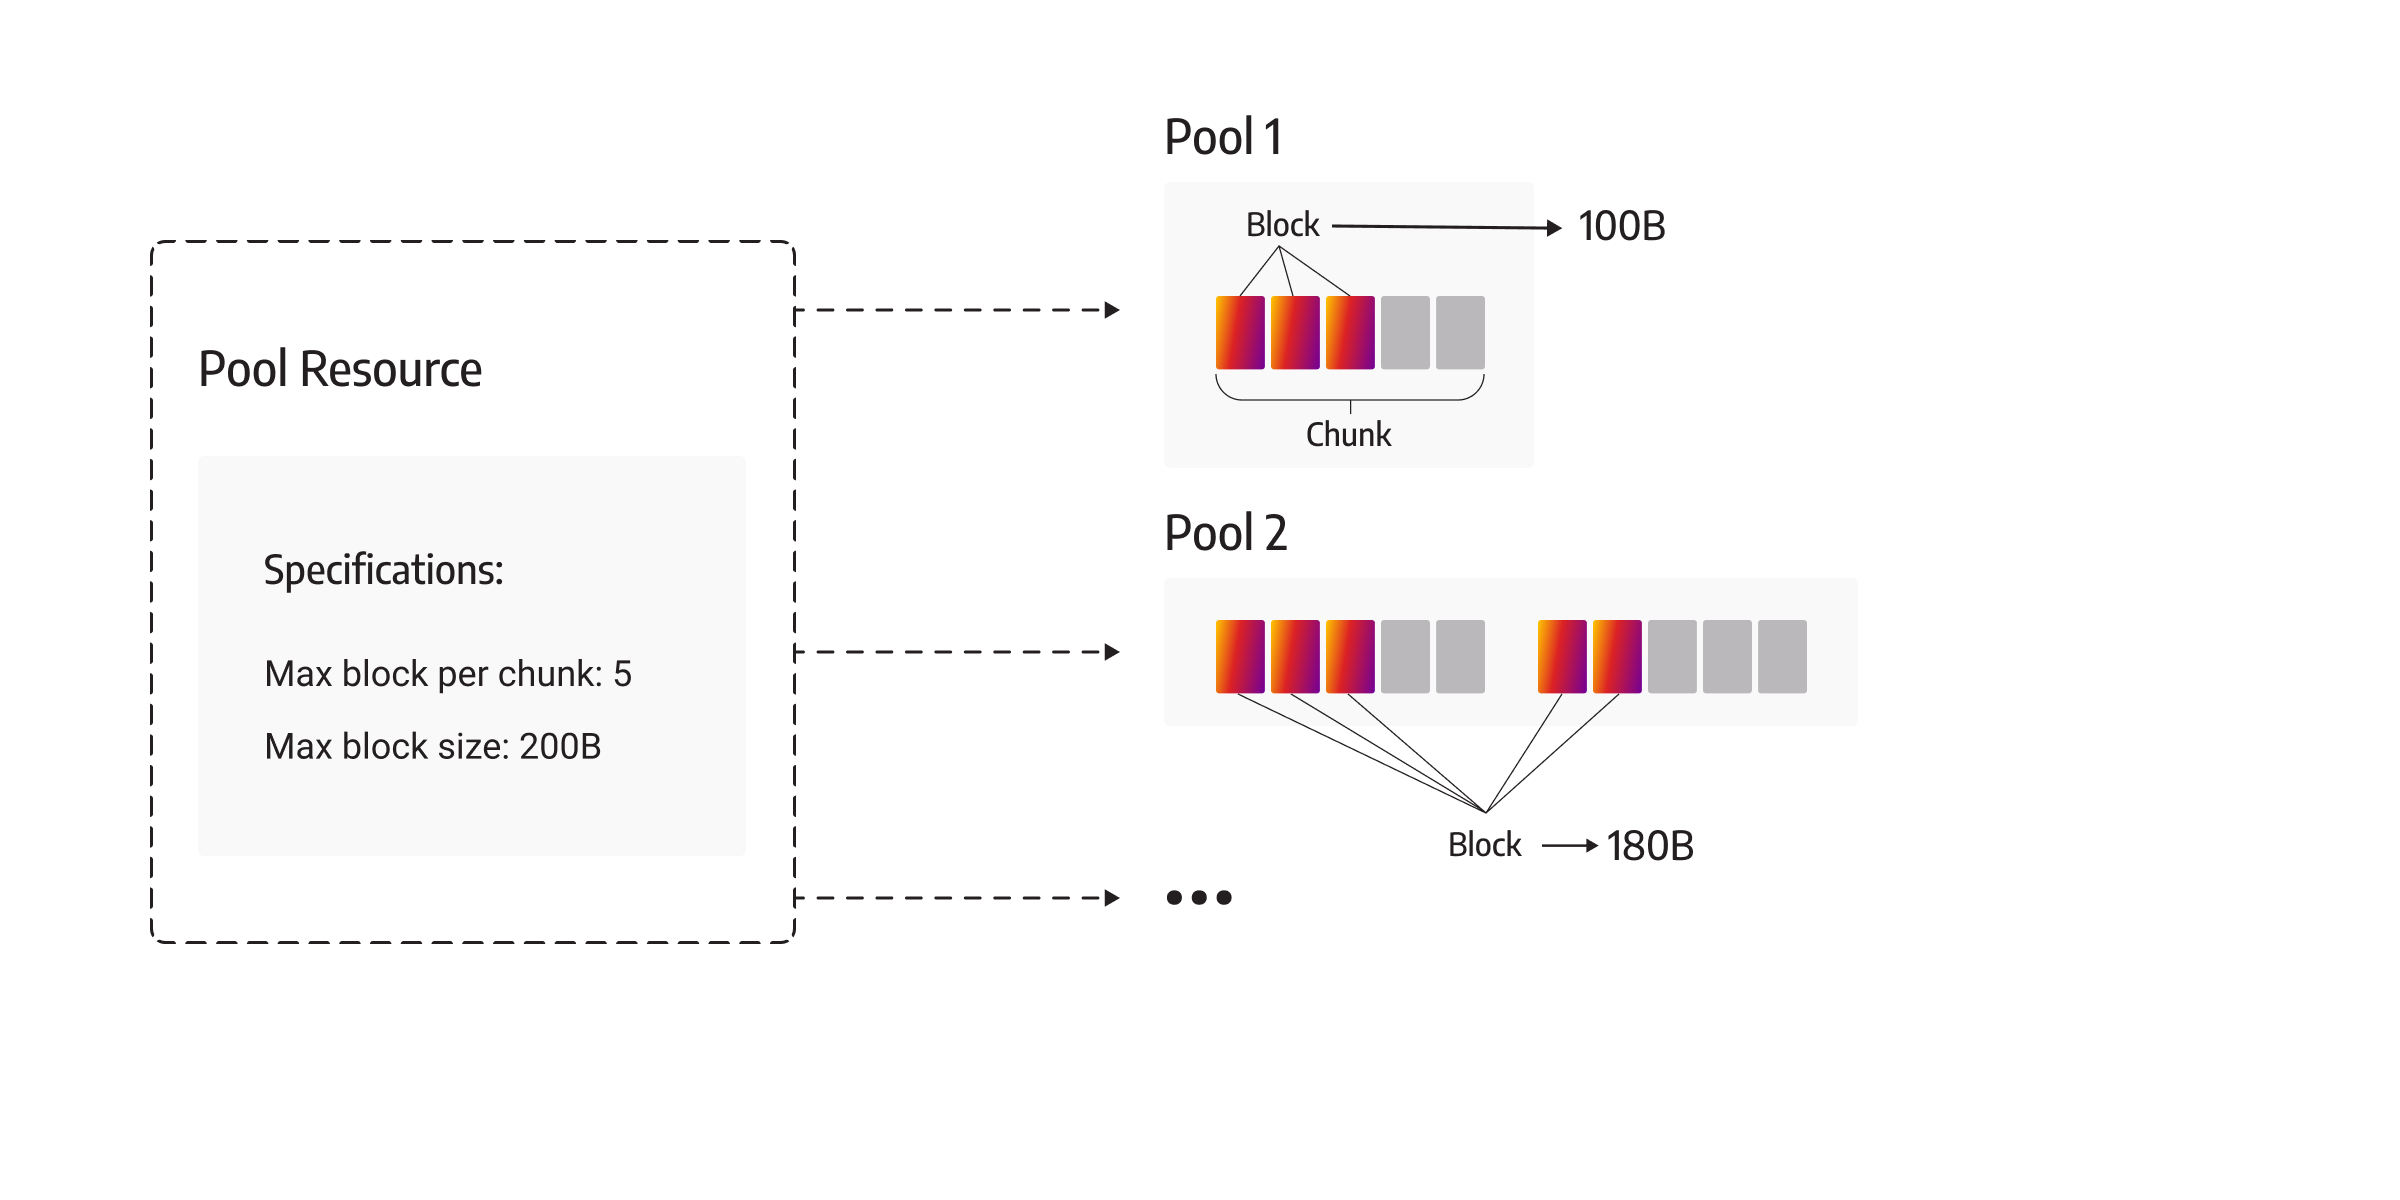
The basic concept behind the PoolResource allocator is to reuse the unused memory allocated for each Pool. PoolResource acts here as a coordinator delegating memory allocation to Pool and possibly reusing Pool objects for memory allocation if there is space inside that Pool, or allocating a new Pool if there is no free space inside any Pool under his coordination. Each Pool consists of Chunks consisting of Blocks. Memory allocation for each Chunk is done via MonotonicBufferResource or Chunk can allocate memory more directly via std::pmr::new_delete_resource(). There is a subtle but huge difference.
As we mentioned before, anything using MonotonicBufferResource doesn’t reuse memory but only allocates new memory because MonotonicBufferResource doesn’t check if there is free memory, so Chunk can’t reuse and memory is not freed until the destruction of the Chunk. And Chunks are not destroyed until PoolResource is not destroyed.
If a Pool uses std::pmr::new_delete_resource() directly, then memory will be reused because memory allocated for a certain object via std::pmr::new_delete_resource() is freed upon object destruction and by design can be reused. In other words, there is no need to allocate a new Pool if there is enough free memory inside one of the Pool objects each time Memgraph needs to allocate memory for an object. By using std::pmr::new_delete_resource() memory is brought back to be reused later on if needed.
So the MonotonicBufferResource doesn’t actually check if it has free memory. By using std::pmr::new_delete_resource() each Pool knows when memory is freed and in which Chunk upon some object destruction, so Pool knows if it has free memory and whether it can reuse free memory.
For objects that require roughly more than 1kB of memory, Memgraph doesn’t use Pools but allocates memory directly with MonotonicMemoryResource. This kind of allocated memory is called unpooled memory because Pool objects are not coordinating with such memory, but rather MonotonicMemoryResource is handling it directly.
Back to this code line which showed to be the issue.
TypedValue Visit(Identifier &ident) override { return TypedValue(frame_->at( symbol_table_->at(ident)), ctx_->memory); }
This ctx_->memory is MemoryResource, which was allocated in the following way:
pool_memory.emplace(128, 1024, &monotonic_memory);
The same monotonic_memory was being used for allocating memory for both Pool and unpooled_memory inside PoolResource, meaning that no memory is reused.
First, that line would make a copy of the row each time this method is called. By my rough approximation, this method was called as many times as there are columns multiplied by the number of rows. In our case, that would be 100 * 100 000 = 10 000 000 times, which equals 10 000 000 copies.
And as you know, CSV files are usually more than 1kB (100 strings with 10 characters is around 8000B), and thus for each row, Memgraph needs to allocate a new memory block that wouldn’t be reused every time this method is called. These issues could be solved by making two changes.
First, we introduced different memory resources specifically for unpooled_memory, and secondly, we set std::pmr::new_delete_resource for allocating unpooled_memory to be able to reuse memory. Memory usage was reduced to 2GBs. Since the partial import was at least 12GB, memory usage has been improved by at least 6x.
As there were delta objects allocated during the process and memory was brought back to 1.5GB after running the FREE MEMORY; query, we decided that the issue was resolved.
Trust your heaptrack
Although we thought the issue was resolved, the user reported back that the issue persists on his side. It was somewhat better, but by rough approximation, the user had a 40 times bigger dataset, and the Memgraph instance needed to use 40*2GB = 80GB, which still didn’t fit inside the available 64GB of RAM.
After going through the codebase once again, and even using directly std::pmr::new_delete_resource for Pool objects inside PoolResource, the problem was still persistent. At that point, you start doubting your theory, although it should be sound.
What I missed is a different allocator inside the codebase used for storing objects on a Frame. The Frame is a resource used to communicate between operators inside the codebase. Operators execute queries. The following query will have two operators:
MATCH (n)

CREATE (:NewNode {id=n.id});
One operator for MATCH, called ScanAllOperator, and the other for CREATE, called CreateNodeOperator. These two operators communicate (one reads data from the other) via a Frame object.
It was time to use another memory profiler, and I used heaptrack. Heaptrack collects data about individual memory allocations, including the size of the allocation, the location in the code where the allocation occurred, and the call stack leading up to the allocation. It showed me that most allocations were still done with MonotonicMemoryResource, which I was sure I changed in the codebase to std::pmr::new_delete_resource.
After checking the codebase, I found that the part called QueryExecution, specifically Frame, is using a different allocator. Again, why was this an issue? For these two operators to communicate with each other, the whole row needed to be stored on Frame. And for that, again, memory was not being reused.
With this change, Memgraph was reusing memory completely, and import with the LOAD CSV clause was optimized from the memory consumption side.

What really helped with debugging was turning off the creation of delta objects mentioned in the beginning. Having a clear picture of what is happening without any other allocations was useful as I could roughly approximate how much memory is needed.
Memgraph doesn’t immediately deallocate delta objects once the query is finished, so debugging with delta creation enabled makes it difficult to understand whether deltas impact the memory or the issue lies with improper deallocation.
During debugging, we got the idea to create a new storage mode which we also implemented. Memgraph 2.7 can now work in two different storage modes, IN_MEMORY_ANALYTICAL mode, which doesn’t use delta objects and the other IN_MEMORY_TRANSACTIONAL. Even though the optimizations on the LOAD CSV clause improved the importing speed, the import can be even faster in the analytical mode because Memgraph doesn't create delta objects. And there is no need to check the initial state of the object each time inside the transaction, which is done in IN_MEMORY_TRANSACTIONAL mode.
Performance profiling
Memory allocations were only a part of the issue. Several users reported performance degradation issues as well. If you have a few hours to spare, you can check the detailed report LOAD CSV optimization on this Memgraph’s GitHub pull request.
Users reported poor performance when importing datasets with a lot of properties and with a high ratio of edges to nodes, meaning that the graph is denser. To optimize performance, I mostly used gperftools.
Gperftools is a sampling profiler that has a small hit on the performance in terms of less accurate results. It takes samples of the current call stack at regular intervals and tries to measure the times spent in the functions call based on these samples. The results are less accurate, but after finding the right sampling frequency, the profiling should be smooth sailing.
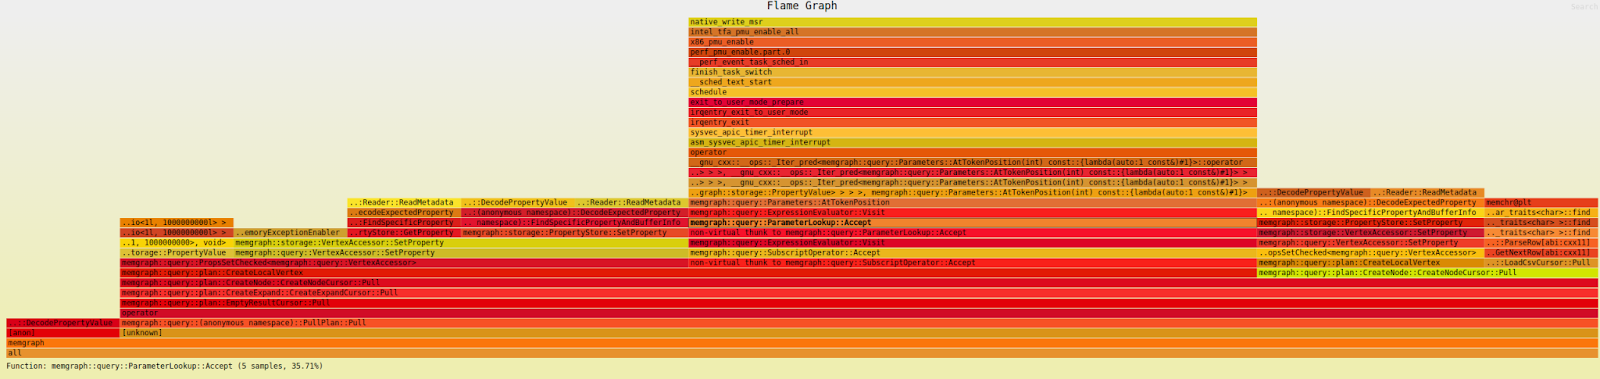
Flamegraph aims to do the same thing as gperftools but with less friction. It uses perf (on Linux) to sample the stacks of a running program. And it can be run on production systems without worrying about destroying production performance. Perf / dtrace will output stack data that can be explored in several different ways, but the flamegraph tool generates an interactive flamegraph: SVG file that can be viewed in a web browser.
You can think of a flamegraph as a measurement of the time that a program spends in certain functions. Starting function will be at the very bottom. As it goes up, the width of each next level is proportional to the amount of time that your program is spending at that sub-call.
Again as for the profiling of memory issues, I used the same dataset of 100 000 rows with 100 columns and started profiling.
Profiling with gperftools
Here is the first profiling output I got with gperftools. You can find more detailed versions here.
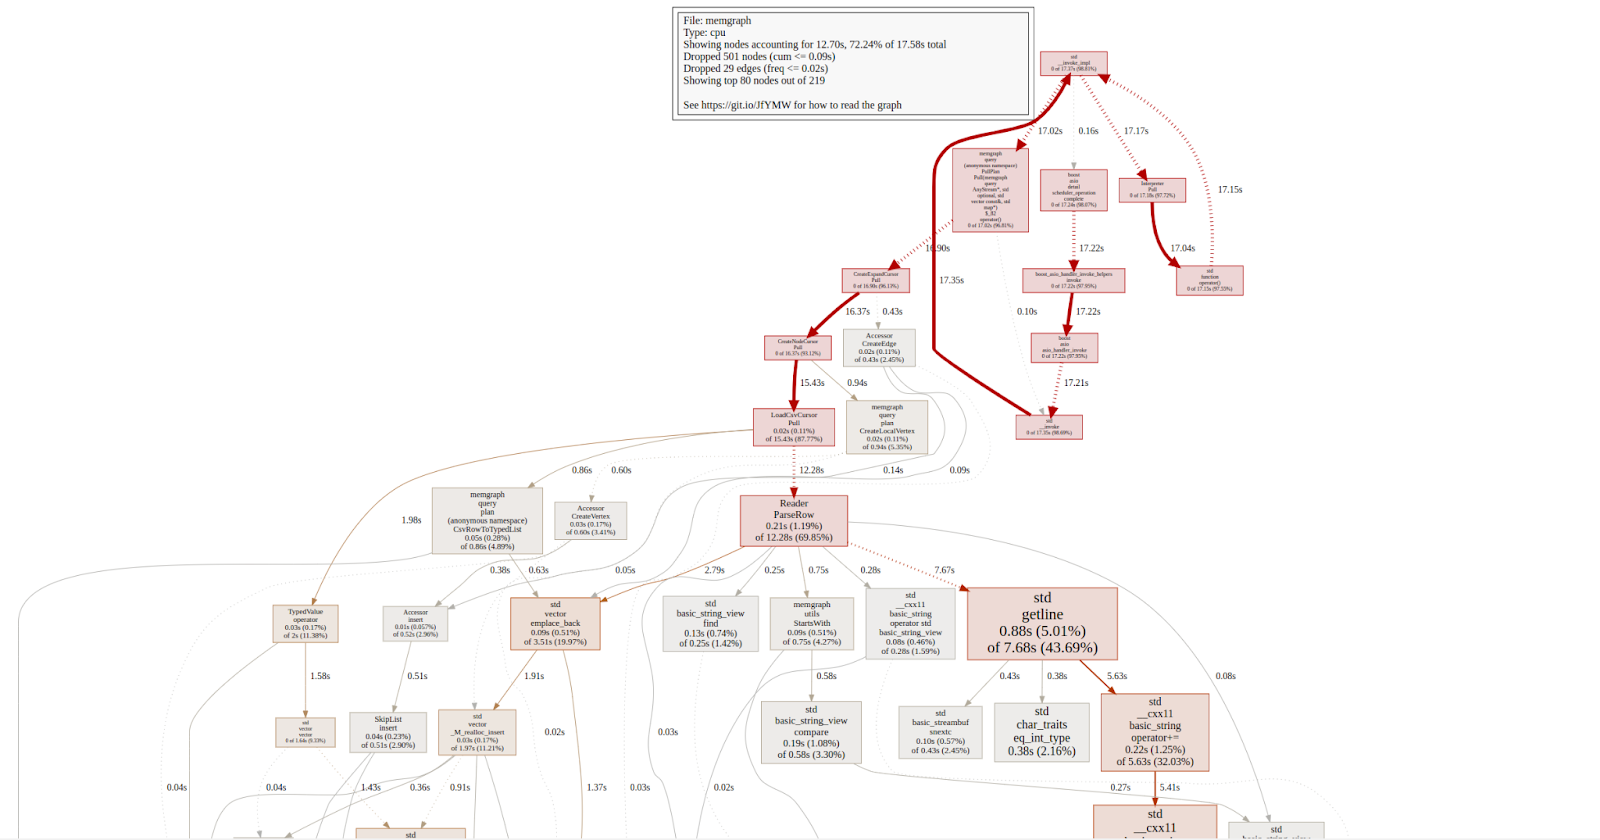
Gperftools outputs a graph, because that’s the best way to represent such information, of course. In this graph, each node represents a procedure. The directed edges indicate caller-to-callee relations. Each node is formatted as follows:
Class Name
Method Name
local (percentage)
of cumulative (percentage)
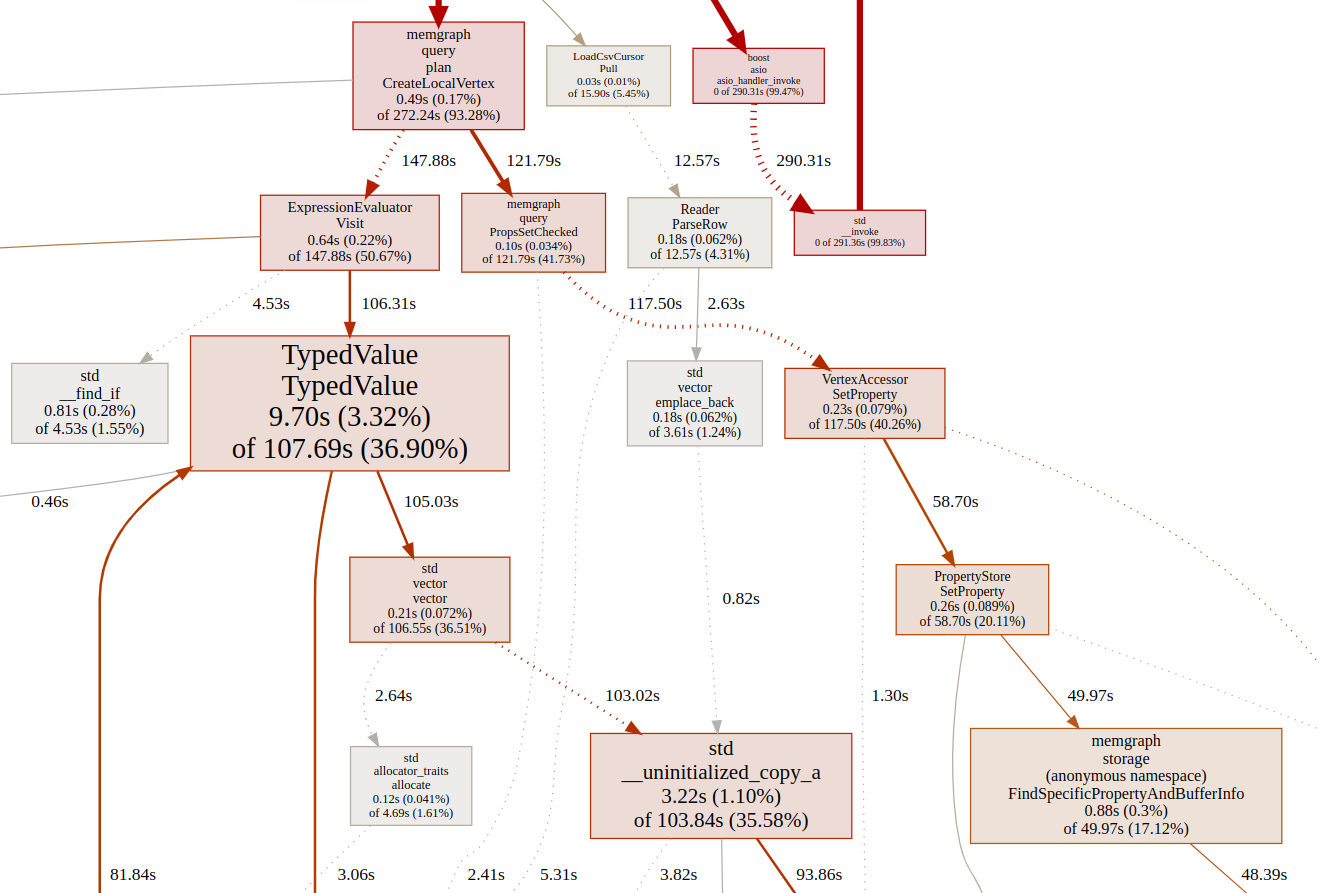
The analysis shows that the most time expensive method is called CreateLocalVertex, especially the Visit method of ExpressionEvaluator class and the SetProperty method of VertexAccessor class.
Looking at the graph and following outedges of the Visit method from ExpressionEvaluator, there is a rectangle TypedValue::TypedValue from which we can’t be sure which part exactly takes a lot of time. That is because there are a lot of Visit methods inside ExpressionEvaluator and lots of TypedValue constructors inside TypedValue class.
But before I started coding, fixing issues, and explaining what the issue actually was, there is one method for profiling that also works: That is setting timers around methods and specific parts of code and measuring how much time is spent inside functions. Before I started using flamegraph, I wanted to be sure I was correct about the issue on SetProperty, and also get a better understanding of what is happening inside the Visit method and which Visit method inside ExpressionEvalutor is the problem.
Now might be a good time to introduce ExpressionEvaluator and what it exactly does. Some Cypher queries use expressions that need to be evaluated, i.e., referencing values inside a list or map, etc. The LOAD CSV query that creates a node from each row from a CSV file looks like this:
LOAD CSV from ./nodes.csv WITH NO HEADER as row

CREATE (:Person {id:row[0], name:row[1], …})
The ExpressionEvaluator evaluates what will be the value of row[0], row[1], etc. If you want, you can look at the code before merging to master Pull Requests, which resolves the issue. One function you can focus on is the Visit method on SubscriptOperator.
Now if you remember, Frame stores values that need to be used or evaluated at a certain point. Before merging to master Pull Requests, which resolved the issue. TypedValue can represent any type, from boolean to vector, and in this case, each row represents a vector of strings, which are stored as TypedValues of string type inside TypedValue of vector type.
Through time measurements, I finally found the issue.
auto lhs = listindexing.expression1->Accept(*this);
This method call ended up in this function:
TypedValue Visit(Identifier &ident) override {

    return TypedValue(frame_->at(symbol_table_->at(ident)), ctx_->memory);

 }
The method creates a copy of each row (100 strings) each time you want to get a certain value from this list (i.e., row[0]). This part also caused some memory issues back in memory profiling. You can find a detailed solution in Improve Visit performance PR. Basically, we introduced ReferenceBasedEvaluator, which only returns a pointer to the object in certain cases like this one, as it makes no sense to do a deep copy and then discard the whole copy just for the sake of one value.
After taking a good look at the graph, following outedges, and examining the code, I had a good guess on what could be a problem with the SetProperty method. But I still wanted to do a profile with flamegraph to check if Memgraph got any better with ReferenceBasedEvaluator and also to check what flamegraph had to say about the SetProperty method.
Detailed profiling with flamegraph
After introducing ReferenceBasedEvaluator and profiling with flamegraph, it was confirmed that the problem is with the SetProperty method. Properties on vertices and edges inside Memgraph are stored inside PropertyStore.
Without going into a lot of details, due to memory optimizations, PropertyStore consumes less memory because each property is serialized as a series of bytes in the case of string, double, int, and temporal types as uint. When storing property on vertex or edge, each property has a key and value, i.e., name: Tom. name represents the key which is mapped inside Memgraph to a certain ID, called property ID. Properties are stored inside the buffer, ordered by property ID ascendingly. When each new property is stored inside the property store, it is saved in a way that the buffer is extended if needed, and bytes are copied from the old buffer to the new buffer. What happens further is that bytes are copied so that the new property gets inserted in ascending order in the buffer.
Due to this fact, every time a vertex gets created and you want to store properties, there are a lot of reallocations of memory and copying from one buffer to another. This process can be optimized by allocating the buffer in the beginning, and properties are written one by one afterward.
You can check how we implemented that on this Pull Request Enhance performance of Property Store on node|edge creation.
Memory consumption and performance were finally optimized, and importing CSV files using the LOAD CSV clause was practically reborn.
Conclusion
Profiling for optimizing performance and memory usage was quite challenging as you never know if you can trust your profiler and if it’s sampling correctly. A few times, I was led in the wrong direction, but finally, by diving into the codebase, understanding the whole picture, and then using profilers as guidance, it was possible to find issues and fix them.
LOAD CSV could import data even faster and use even less memory if it weren't for the creation of delta objects. If you require that extra speed, use the analytical storage mode. But in that case, you can import data without worrying about memory skyrocketing. Your only worry will be if you can drink your coffee faster than Memgraph can import data, that is, before you need to start your analytical work.