How We Integrated Custom CSS-Like Language to Style Graphs
In-browser Javascript library Orb provides a simple and fast way to visualize graphs. An essential part of every visualization is the look and feel of it. With Orb, you can style graphs with JSON definitions for nodes and edges, but we wanted to take it one step further and provide a CSS-like language as well.
Styling graphs with Orb
Let's start with a simple graph. In the following example, we have six nodes (featured cast of the TV show House of the Dragon) and nine edges (relationships between the characters). In order to visualize and style the graph, we will use the Orb library. The complete example can be found on the following GitHub GIST.
With Orb, graph data is defined with a list of nodes and edges, but the style of each node and edge is defined with a few callback functions: getNodeStyle and getEdgeStyle. As you can see in the example below, both functions have a code that prepares an object containing style properties for nodes and edges: color, size, width, label (text shown on the node/edge), border color, etc.
const container = document.getElementById("graph");

const nodes = [
  { id: 1, name: "House of the Dragon", type: "Show" },
  { id: 2, name: "Rhaenyra Targaryen", type: "Person", family: "Targaryen" },
  { id: 3, name: "Daemon Targaryen", type: "Person", family: "Targaryen" },
  { id: 4, name: "Viserys Targaryen", type: "Person", family: "Targaryen" },
  { id: 5, name: "Otto Hightower", type: "Person", family: "Hightower" },
  { id: 6, name: "Alicent Hightower", type: "Person", family: "Hightower" },
];
const edges = [
  { id: 1, start: 2, end: 1 },
  { id: 2, start: 3, end: 1 },
  { id: 3, start: 4, end: 1 },
  { id: 4, start: 5, end: 1 },
  { id: 5, start: 6, end: 1 },
  { id: 6, start: 3, end: 4, label: "brother of" },
  { id: 7, start: 4, end: 3, label: "brother of" },
  { id: 8, start: 2, end: 4, label: "child of" },
  { id: 9, start: 6, end: 5, label: "child of" },
];

const orb = new Orb.Orb(container);

const imageUrlByNodeId = {
  1: "https://static.hbo.com/2022-06/house-of-the-dragon-ka-1920.jpg",
  2: "https://static.hbo.com/2022-05/house-of-the-dragon-character-rhaenyra-512x512_0.jpg?w=512",
  3: "https://static.hbo.com/2022-05/house-of-the-dragon-character-daemon-512x512.jpg?w=512",
  4: "https://static.hbo.com/2022-05/house-of-the-dragon-character-viserys-512x512_0.jpg?w=512",
  5: "https://static.hbo.com/2022-05/house-of-the-dragon-character-otto-512x512.jpg?w=512",
  6: "https://static.hbo.com/2022-05/house-of-the-dragon-character-alicent-512x512_2.jpg?w=512",
};
const colorByFamily = {
  Targaryen: "#c51c1c",
  Hightower: "#1ead2a",
};

// Set default style for new nodes and new edges
orb.data.setDefaultStyle({
  getNodeStyle(node) {
    const imageUrl = imageUrlByNodeId[node.id];
    // Shared style properties for all the nodes
    const commonProperties = {
      size: 10,
      fontSize: 3,
      imageUrl,
      label: node.data.name,
    };

    // Specific style properties for nodes where ".type = 'Person'"
    if (node.data.type === "Person") {
      return {
        ...commonProperties,
        // Border color will be the color of the family
        borderColor: colorByFamily[node.data.family],
        borderWidth: 0.9,
        size: 6,
      };
    }

    return commonProperties;
  },
  getEdgeStyle(edge) {
    // Using Orb.Color to easily generate darker colors below
    const familyColor = new Orb.Color(
      colorByFamily[edge.endNode.data.family] ?? "#999999"
    );
    return {
      color: familyColor,
      colorHover: familyColor.getDarkerColor(),
      colorSelected: familyColor.getDarkerColor(),
      fontSize: 3,
      fontColor: familyColor.getDarkerColor(),
      // Edges will "label" property will have 3x larger width
      width: edge.data.label ? 0.3 : 0.1,
      widthHover: 0.9,
      widthSelected: 0.9,
      label: edge.data.label,
    };
  },
});

// Initialize nodes and edges
orb.data.setup({ nodes, edges });

// Render and recenter the view
orb.view.render(() => {
  orb.view.recenter();
});
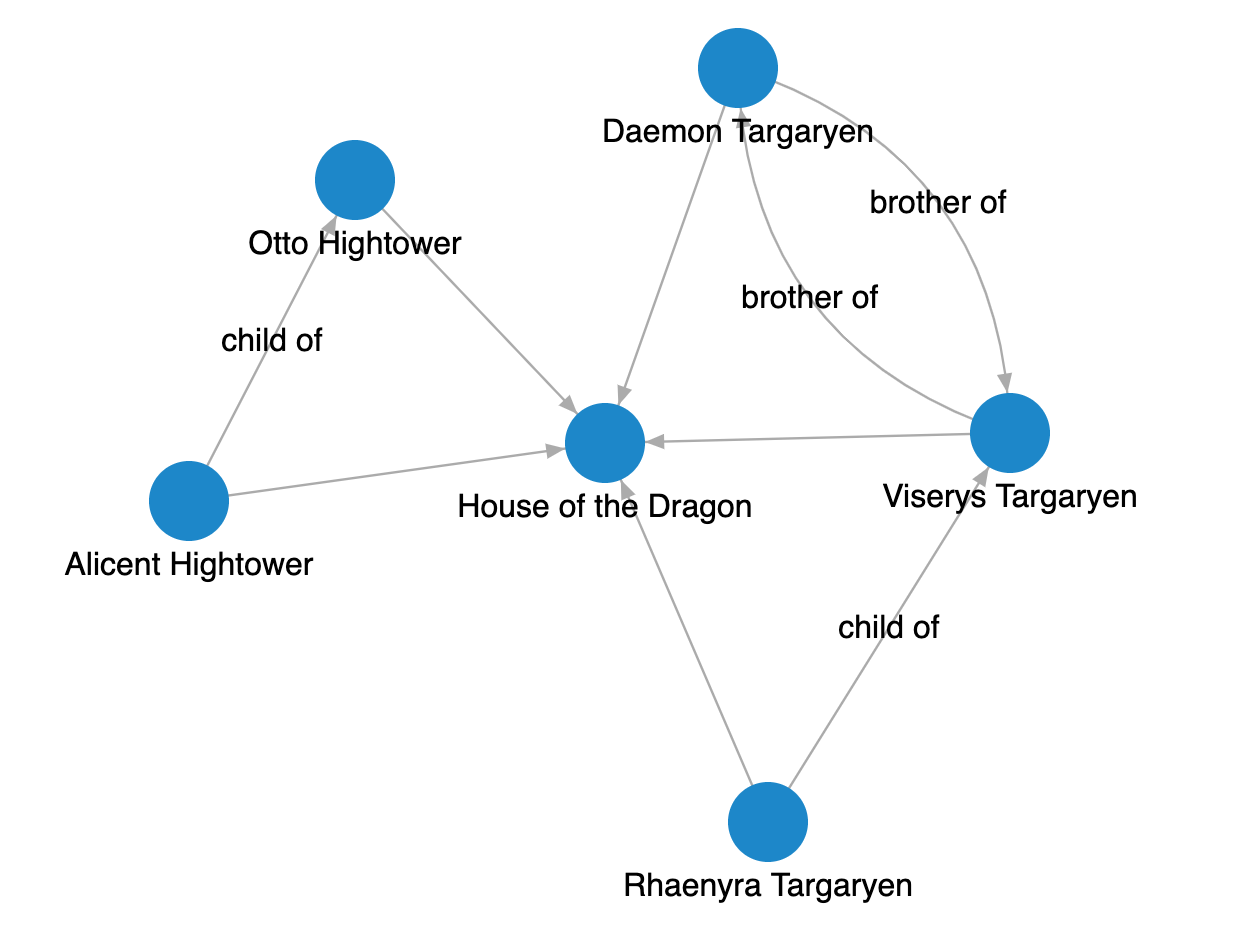
The example code without the Orb style callbacks would generate a graph that looks like this:
But, the same code with style callbacks would generate a graph that looks way better and is easier to understand. Each character node has an image of the character, house families are colored in different node borders along with edges connecting them.
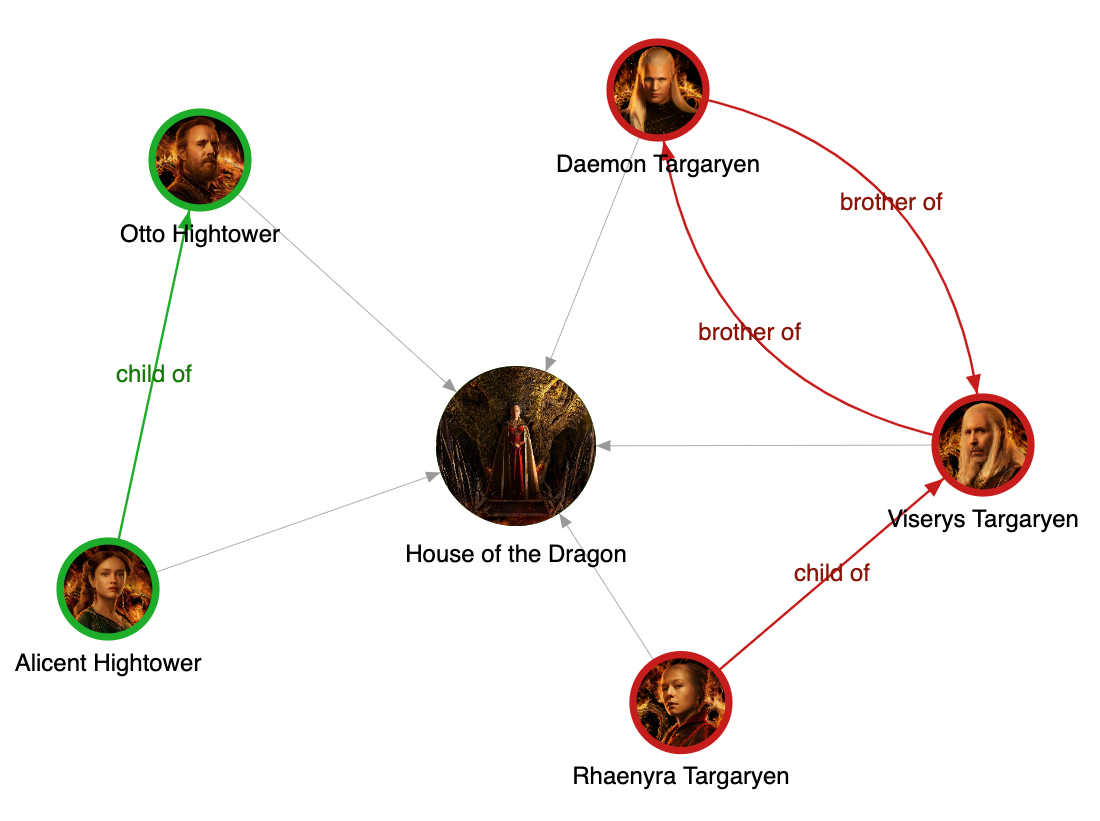
I am sure you can see the importance of styling a graph to understand the data more efficiently.
The need for a custom CSS-like language
In Memgraph, we use Orb to visualize graphs in two of our products: Memgraph Playground and Memgraph Lab. The graph data model comes from Memgraph DB upon running a Cypher query. But how do we enable graph styling for end users who would like to render any graph model?
At the time, there were two solutions to the problem:
- Create a complete interface with various UI elements to select color, width, size, background image, etc. for each node and edge
- Expose the Javascript code for style callbacks the Orb expects, so the user can type in the Javascript code to style the graph, just like when using Orb
The problem with the first solution is its scope and limitations. Currently, there are 26 different style properties for nodes/edges, so we would need to implement 26 different UI elements (color pickers, image selectors, property selectors for node/edge text labels, etc.). We are sure users would use it, but it wouldn’t offer everything baseline Orb styling can. For example, it would be impossible to “Color a node in red only if any of its adjacent nodes have a property name that contains the text ‘High priority”.
The second solution uses the baseline Orb styling at its fullest. Still, it introduces a whole variety of problems by exposing the Javascript ecosystem to the end user, who might not even know how to write Javascript code or use Orb style callbacks.
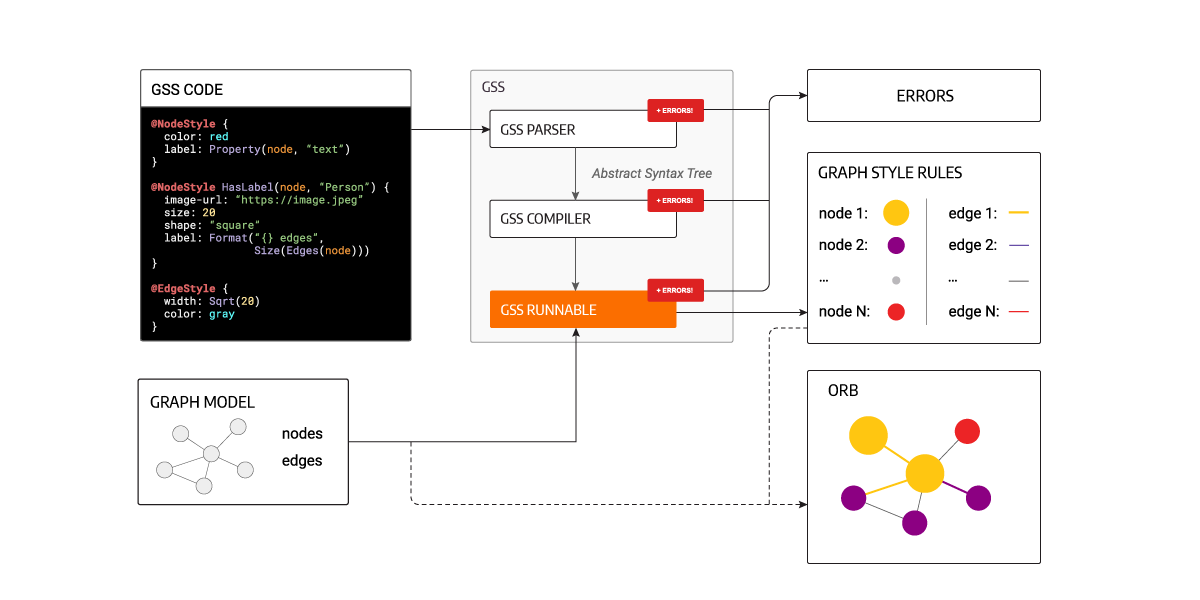
The following image explains the issue and the motivation the best. Orb will handle the rendering of the graph, but it needs a graph model and graph style rules. A graph model can be anything, depending on what kind of Cypher query the user runs on top of the data stored in Memgraph DB.
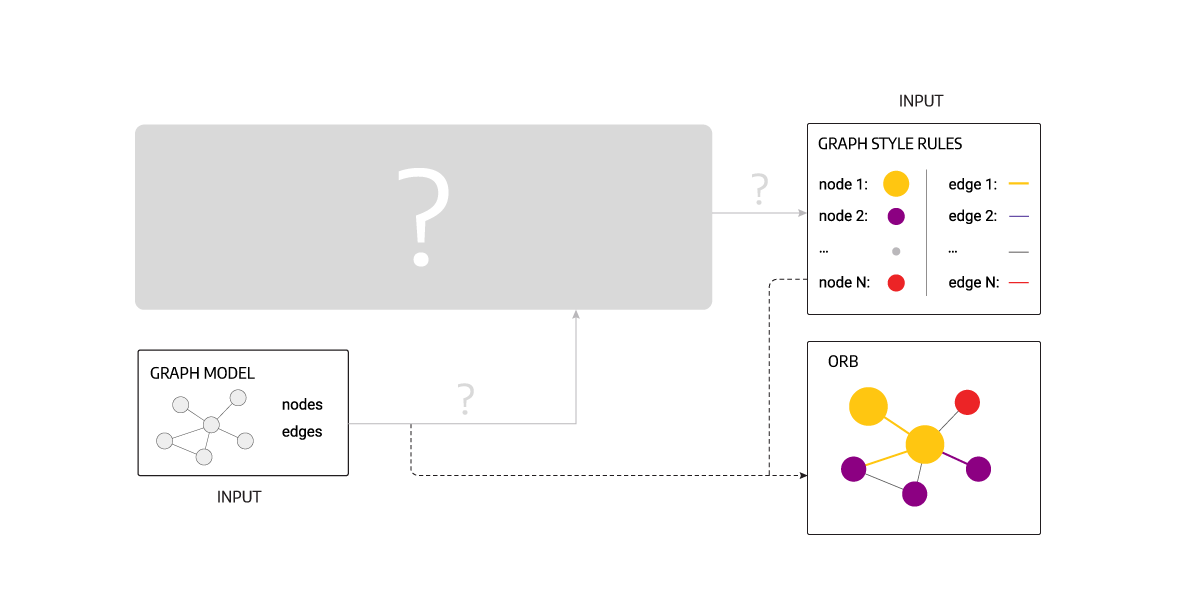
So, in conclusion, we needed a solution that:
- Receives any kind of graph model that consists of nodes and edges.
- Creates a graph style for each node and edge of the input graph model (colors, images, sizes, widths, etc.).
- Gives end users an easy, dev-oriented, exciting, and unlimited way to style the shit out of the graph model.
Thus, the need for a “new” language has been born.

Hello GSS, Graph Style Script
The new language was started by Antun Magdic as part of the internship project at Memgraph. The initial idea was to use and extend CSS parsers and compilers, but it wasn’t an easy job, so we decided to create the parser and the compiler ourselves. Due to its similarity with CSS, we also wanted to name it similarly, so we came up with GSS, which stands for Graph Style Script.
In the image below, you can see how GSS fits in the workflow of generating graph styles for any graph data model upon the defined GSS source code provided by the end user:
GSS Parser
GSS Parser does two things: Lexical and Syntax analysis. It is a process that takes something that is easy for humans to write to generate something that is easy for programs to handle.
You can clearly see both steps in the image below. Lexical analysis reads a source code, character by character, and creates a list of tokens. A list of tokens is then processed by the syntax analysis that structures them into an AST (Abstract Syntax Tree) with the help of defined language rules or a language grammar. A grammar is a set of rules used to describe the language structure (e.g., grammar in Backus–Naur form).
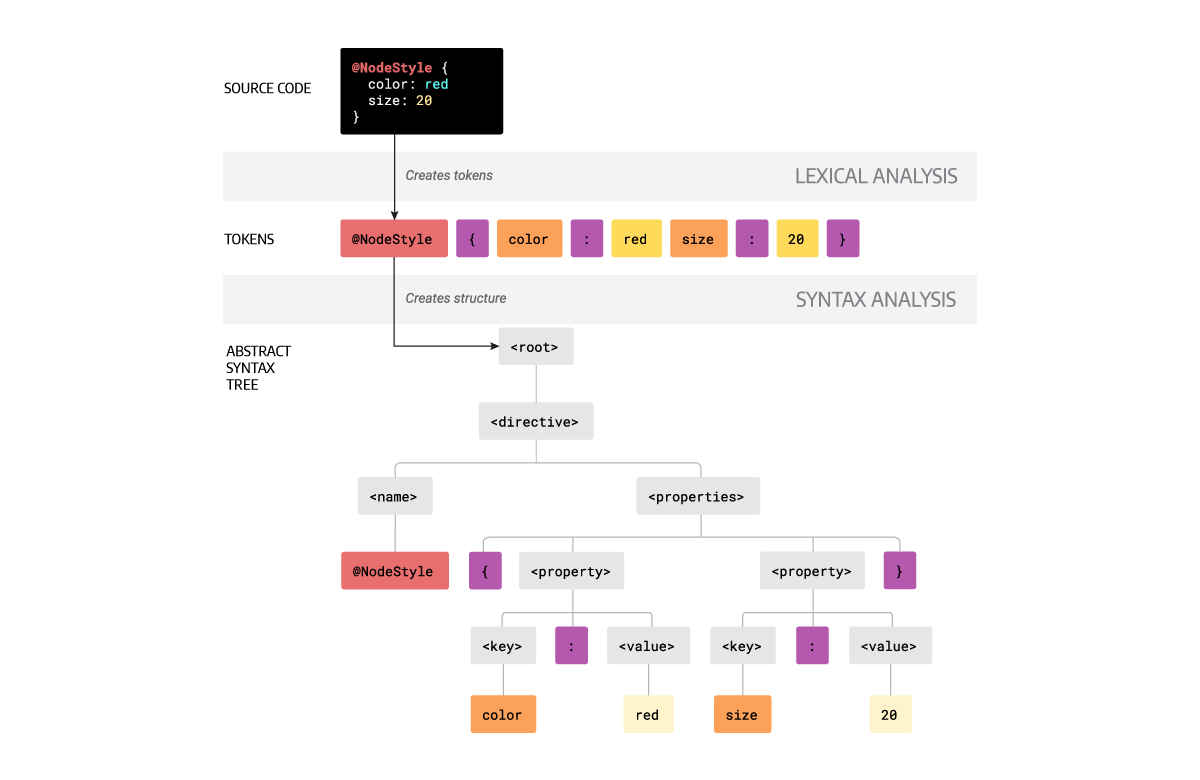
During the parsing process, errors can happen because of wrongly spelled tokens, invalid characters, missing parenthesis, etc. Parsing error will be shown to the user with an explanatory error message and how to recover from it.
GSS Compiler
GSS Compiler also does two things: Semantic analysis and the actual compilation. The input to the semantic analysis is the AST along with the built-in GSS definitions:
- Colors:
red,aquamarine, etc. - Functions:
Format,Property,Equals, etc. - Variables:
node,edge,graph
Semantic analysis checks if the code is semantically consistent: matching types, valid function arguments, valid function names, declared variables, etc. Once the semantic analysis is completed, the compiler creates a runnable Javascript function that takes any graph model as an input and creates a set of styling rules for each node and edge.
Like in the parsing process, compile errors can happen due to invalid semantic analysis, e.g., calling a function MyFunction that doesn’t exist or is not defined.
One additional error type can be thrown while using the runnable GSS Javascript function: Runtime error. Runtime errors happen when the graph model is being processed and the final style is being created. An example of such an error could be a null pointer exception when an action (e.g., Div to divide numbers) is done on a node property that doesn’t exist.
Styling graphs with GSS
Enough theorizing, let’s be practical. In the previous example the graph was styled with Javascript code using orb.data.setDefaultStyle. The same styling can be accomplished with the following GSS code:
Define(ImageById, AsArray(
  "",
  "2022-06/house-of-the-dragon-ka-1920.jpg",
  "2022-05/house-of-the-dragon-character-rhaenyra-512x512_0.jpg?w=512",
  "2022-05/house-of-the-dragon-character-daemon-512x512.jpg?w=512",
  "2022-05/house-of-the-dragon-character-viserys-512x512_0.jpg?w=512",
  "2022-05/house-of-the-dragon-character-otto-512x512.jpg?w=512",
  "2022-05/house-of-the-dragon-character-alicent-512x512_2.jpg?w=512"
))

Define(TARGARYEN_COLOR, #c51c1c)
Define(HIGHTOWER_COLOR, #1ead2a)
Define(DEFAULT_COLOR, #999999)

Define(GetFamilyColor,
  Function(family,
    If(
      Equals(family, "Targaryen"),
      TARGARYEN_COLOR,
      If(
        Equals(family, "Hightower"),
        HIGHTOWER_COLOR,
        DEFAULT_COLOR
      )
    )
  )
)
Define(GetNodeFamilyColor,
  Function(node,
    GetFamilyColor(Property(node, "family"))
  )
)
Define(GetEdgeFamilyColor,
  Function(edge,
    GetNodeFamilyColor(EndNode(edge))
  )
)

@NodeStyle {
  size: 10
  font-size: 3
  label: AsText(Property(node, "name"))
  image-url: Format(
    "https://static.hbo.com/{}", Get(ImageById, Property(node, "id"))
  )
}

@NodeStyle Equals(Property(node, "type"), "Person") {
  size: 6
  border-width: 0.9
  border-color: GetNodeFamilyColor(node)
}

@EdgeStyle {
  color: GetEdgeFamilyColor(edge)
  color-hover: Darker(GetEdgeFamilyColor(edge))
  color-selected: Darker(GetEdgeFamilyColor(edge))
  font-size: 3
  font-color: Darker(GetEdgeFamilyColor(edge))
  width: If(Type(edge), 0.3, 0.1)
  width-hover: 0.9
  width-selected: 0.9
  label: Type(edge)
}
GSS allows you to define new functions or constants, which is super handy, as the example above shows.
- Family colors are defined as constant variables (
TARGARYEN_COLOR,HIGHTOWER_COLOR,DEFAULT_COLOR), making it super easy to change the color without changing the rest of the GSS code. - New functions were created such as:
GetFamilyColor- receives inputfamilyand returns an appropriate color by checking iffamily == "Targaryen"orfamily == "Hightower".GetNodeFamilyColor- receives an inputnode, gets a property.familyfrom a node and usesGetFamilyColor.GetEdgeFamilyColor- receives an inputedge, gets target node of the edge withEndNodebuilt-in function and uses already definedGetNodeFamilyColor.
- Image URLs are defined within a single array
ImageByIdwhere we can use node propertyidto get to the correct image URL.
Below the GSS definitions come the actual style rules for nodes and edges. General rules (applied to all nodes and all edges) do not have a filter function after @NodeStyle or @EdgeStyle. In example above, there are two general rules and one specific rule @NodeStyle Equals(Property(node, "type"), "Person"), which is applied only to those nodes where the node property .type is equal to the string value "Person". We want to apply a certain border color to these character nodes.
There is one piece of the definition that needs an additional explanation. As seen below, the image-url style will be equal to the value made by joining two strings: "https://static.hbo.com/" and a value from the ImageById array. The problem with this solution is that it is not future-proof, meaning that if we add 100 more new nodes to the graph model, we would need to update the GSS array with 100 new images, and that’s not all. We would also need to be careful and connect the proper node id to the correct image position in the array.
@NodeStyle {
  ...
  image-url: Format(
    "https://static.hbo.com/{}", Get(ImageById, Property(node, "id"))
  )
}
To overcome this problem and make it future-proof (the same applies to the first example with the Javascript style definition), the node should contain the information about the profile image URL. Let’s say that each node has a property .profile_url:
const nodes = [
  {
    id: 2,
    name: 'Rhaenyra Targaryen',
    type: 'Person',
    family: 'Targaryen',
    profile_url: 'https://static.hbo.com/2022-05/house-of-the-dragon-character-rhaenyra-512x512_0.jpg?w=512'
  },
  ...
];
Then we can have the following rule in GSS without any ImageById definition:
@NodeStyle {
  ...
  image-url: Property(node, "profile_url")
}
Feel free to check the Javascript way of adding styles to the Orb from the first example and the GSS way to do the same, especially the part about@NodeStyle and @EdgeStyle definitions. If you want to read more about what GSS can offer, check out the GSS documentation.
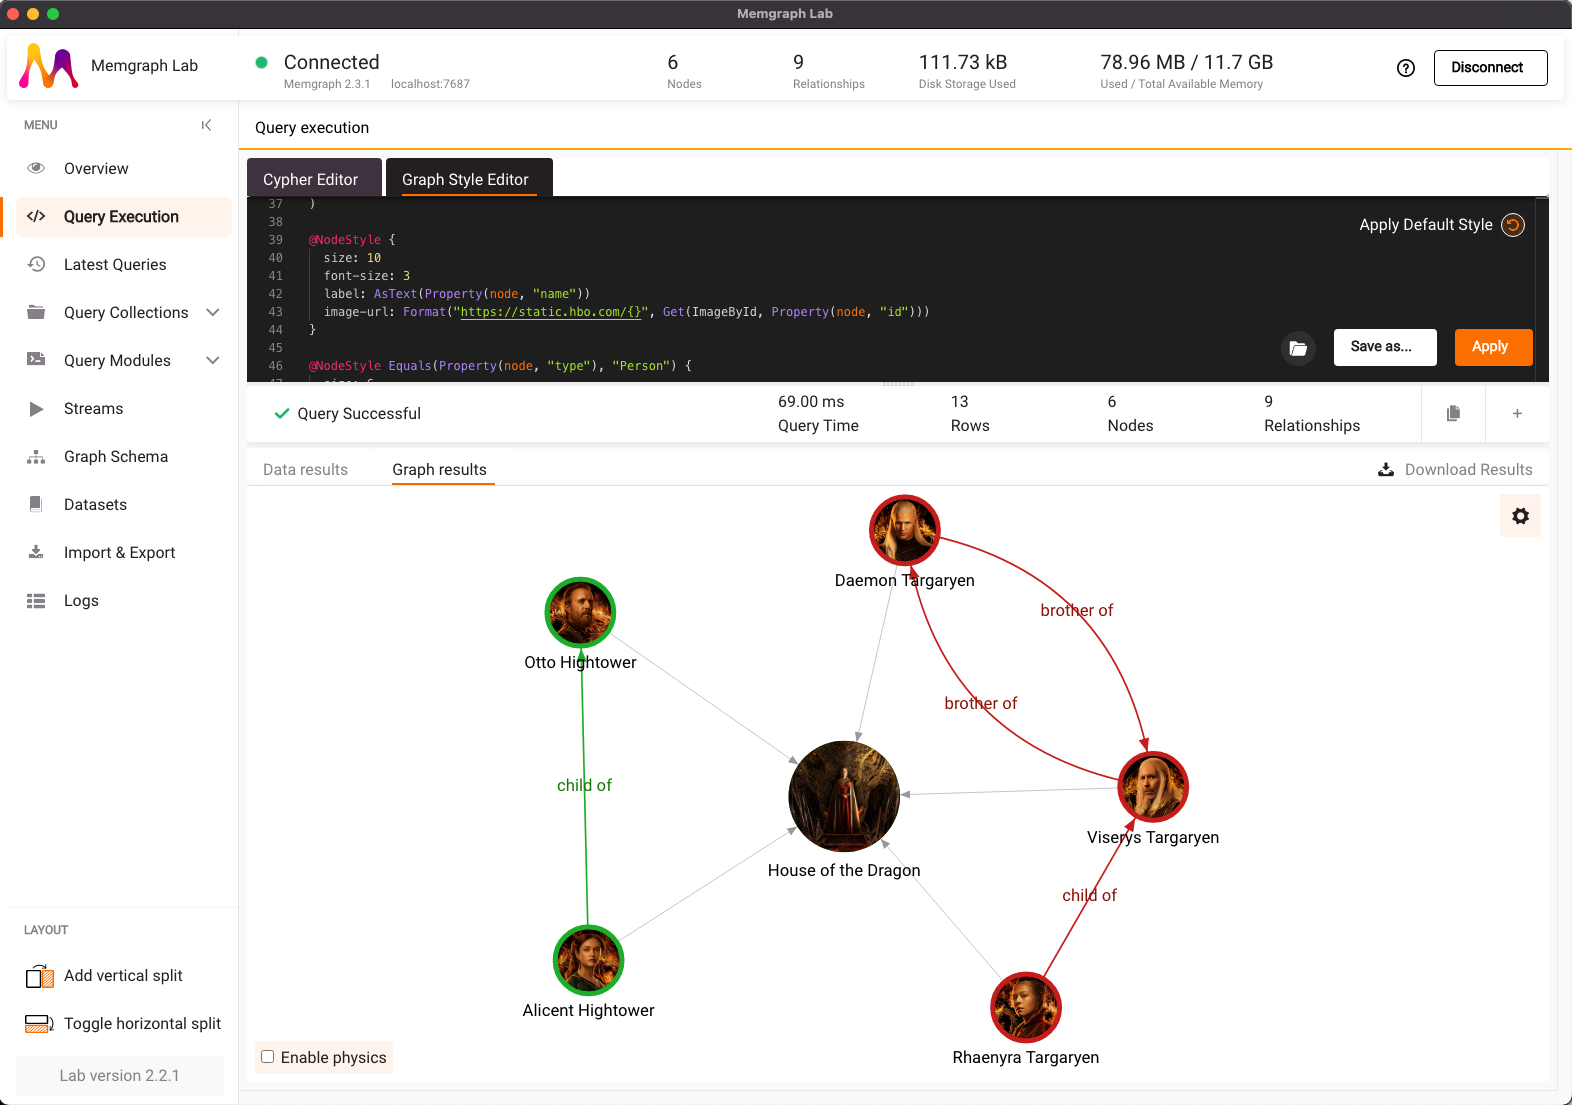
Back to the GSS example, here is the screenshot of applying the above GSS code to the same graph model from Memgraph Lab:
Try it yourself
GSS is not open source, but you can still try it out in Memgraph Lab and get the same results. Or even better-looking results if you have a hidden talent for using GSS. To try it out, you will need Memgraph DB and Memgraph Lab. You can use Memgraph Platform which has everything you need in a single Docker image.
Step 1: Download Memgraph Platform or join Memgraph Cloud (new users get two weeks of free trial) to start your Memgraph instance.
Step 2: Connect to your Memgraph DB with Memgraph Lab standalone application or in-browser app.
Step 3: Create an example graph model with the following Cypher queries in the “Query execution” section of the Lab. Copy the content below, and click “Run”. The queries will create the same graph model as seen in the first example:
// Delete all the nodes and edges
MATCH (n) DETACH DELETE n;

// Create the example graph
CREATE
(n1:Show   { id: 1, name: 'House of the Dragon', type: 'Show' }),
(n2:Person { id: 2, name: 'Rhaenyra Targaryen', type: 'Person', family: 'Targaryen' }),
(n3:Person { id: 3, name: 'Daemon Targaryen', type: 'Person', family: 'Targaryen' }),
(n4:Person { id: 4, name: 'Viserys Targaryen', type: 'Person', family: 'Targaryen' }),
(n5:Person { id: 5, name: 'Otto Hightower', type: 'Person', family: 'Hightower' }),
(n6:Person { id: 6, name: 'Alicent Hightower', type: 'Person', family: 'Hightower' }),
(n2)-[:``]->(n1),
(n3)-[:``]->(n1),
(n4)-[:``]->(n1),
(n5)-[:``]->(n1),
(n6)-[:``]->(n1),
(n3)-[:`brother of`]->(n4),
(n4)-[:`brother of`]->(n3),
(n2)-[:`child of`]->(n4),
(n6)-[:`child of`]->(n5);

// Return all the created nodes and edges
MATCH (n)-[e]-(m) RETURN n, e, m;
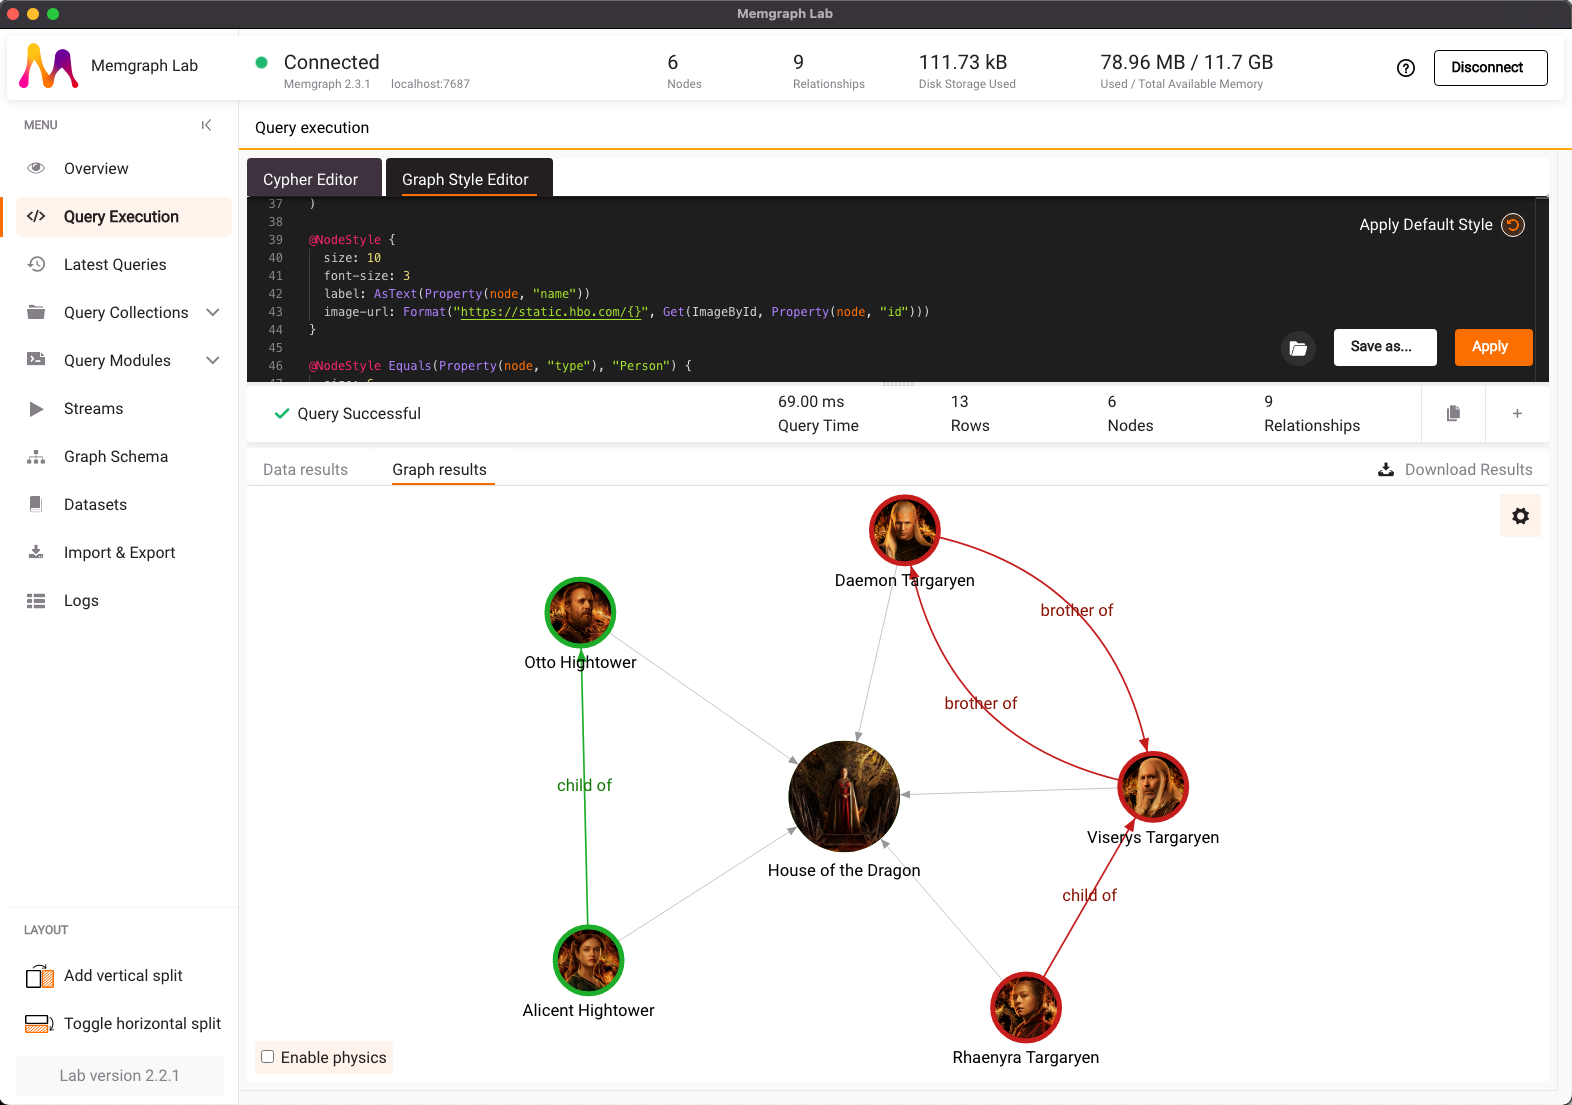
Step 4: Click on the “Graph Style Editor”, copy the GSS from above and click “Apply”. Voila, your graph should be styled the same as the graph shown below:
Feel free to play around with GSS and add new style rules we haven’t thought of. The GSS editor in Memgraph Lab has code suggestions and inline code documentation tools to help you out while writing GSS rules and functions. If you want to try GSS on other graph models, Memgraph Lab offers an easy way to load up prepared datasets (e.g. Game of Thrones, Pandora Papers, etc.) as well as import your custom ones.