
How to Analyze and Explore the World of Real-Time NFTS?
Art Blocks is a digital platform for creative coding which involves computer and algorithmic generated art that can be in the form of images, gifs, 3D models, etc. The platform is based on blockchain, to be more precise, on Ethereum-based NFTs for integration of creation and ownership of generated art. As with any blockchain project, the exchange process is based on the block of transactions. Transactions on the blockchain happen in real-time and change constantly, but if you download and take a static dataset, there is no change or events in the dataset you can react to. So, we at Memgraph decided to have some fun building real-time analytics on streaming data, and to get datasets in motion, we created Awesome Data Stream, a data streams website, to make things dynamic and real-time. There, you can also find all the details about the Art Blocks dataset used in this blog post.
Data coming from these streams can be run through Memgraph, which you can set up using the new Memgraph Cloud or by running a local instance of Memgraph DB. The latest version of Memgraph Lab, an application you can use to query and visualize data, has a new feature that guides you through the process of connecting to streams. All the information necessary to connect to a stream is available on the Awesome Data Stream website. If these tools spark your interest, feel free to browse through the Cloud documentation or check out the guide on how to connect to streams using Memgraph Lab. If you are a true fan of visual arts, watch the video tutorial that goes through both of these processes.
This blog will explore the Art Blocks streaming dataset to get some insides into account transactions, popular projects, and communities insights the dataset.
Checking the setup
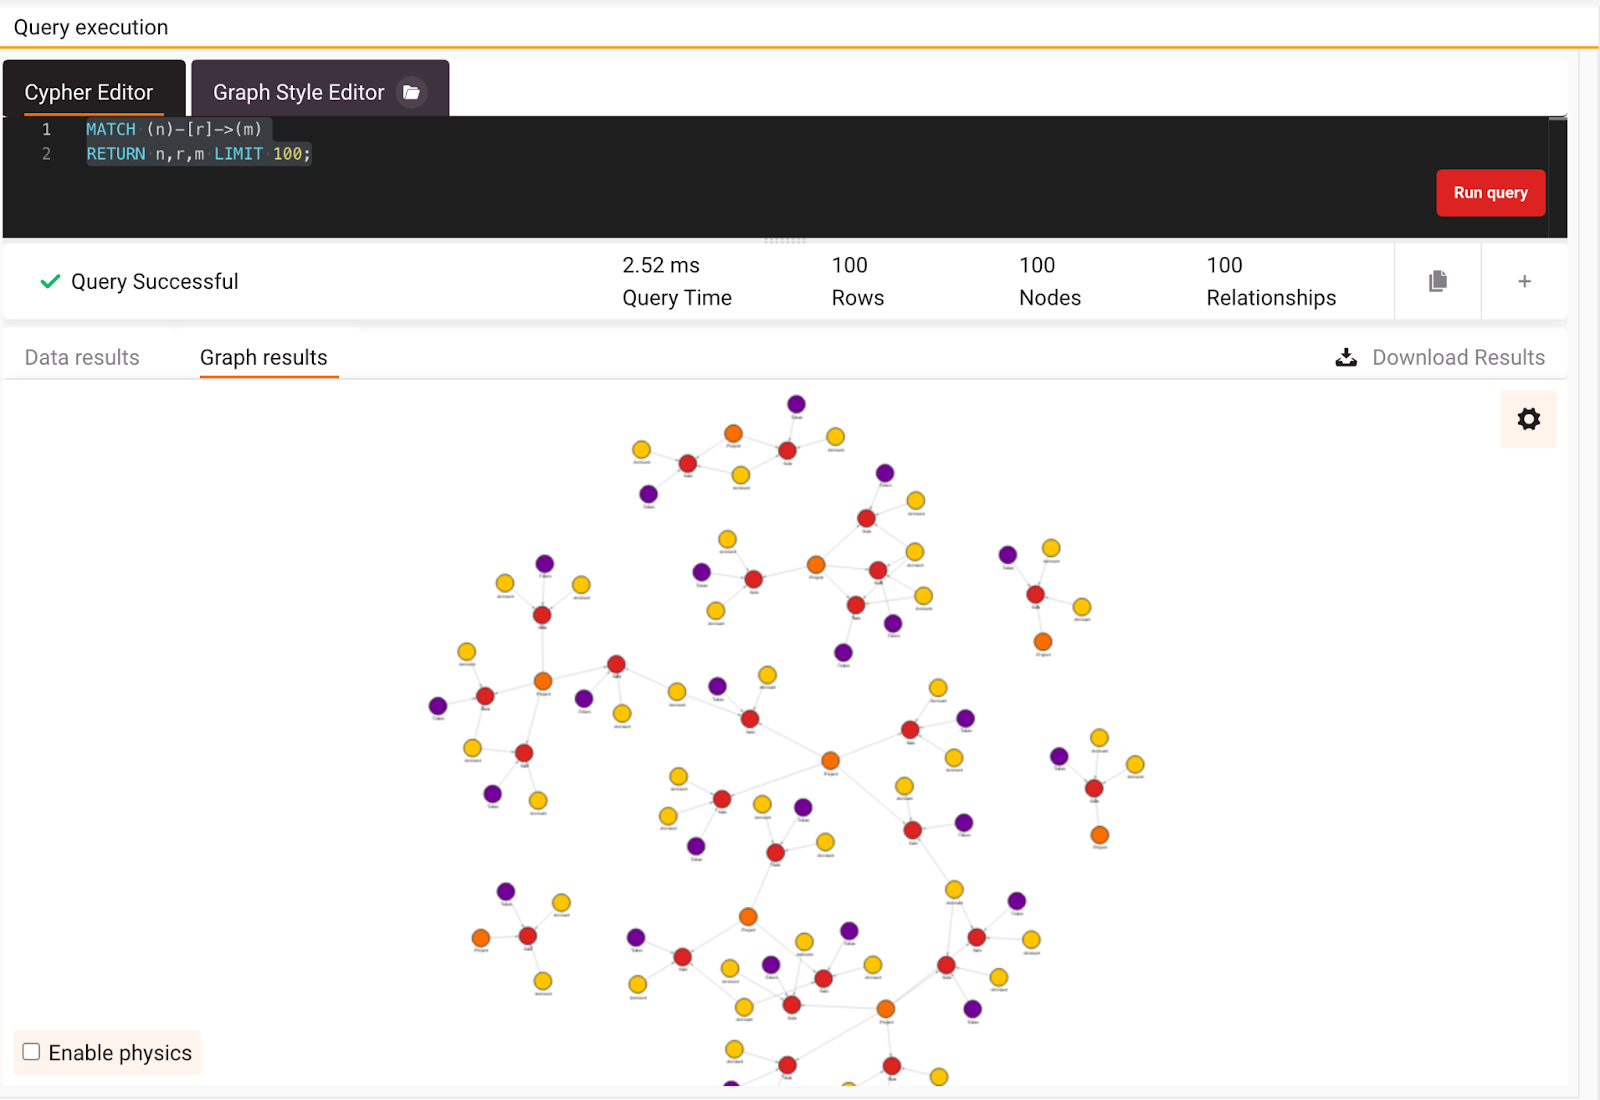
Assuming you are successfully running your Memgraph instance, you’ve connected to it with Memgraph Lab or mgconsole, and the database is ingesting the Art Blocks data stream, run the following Cypher query to be sure everything is connected and running smoothly (in Memgraph Lab, switch to Query Execution):
MATCH (n)-[r]->(m)
RETURN n,r,m LIMIT 100;
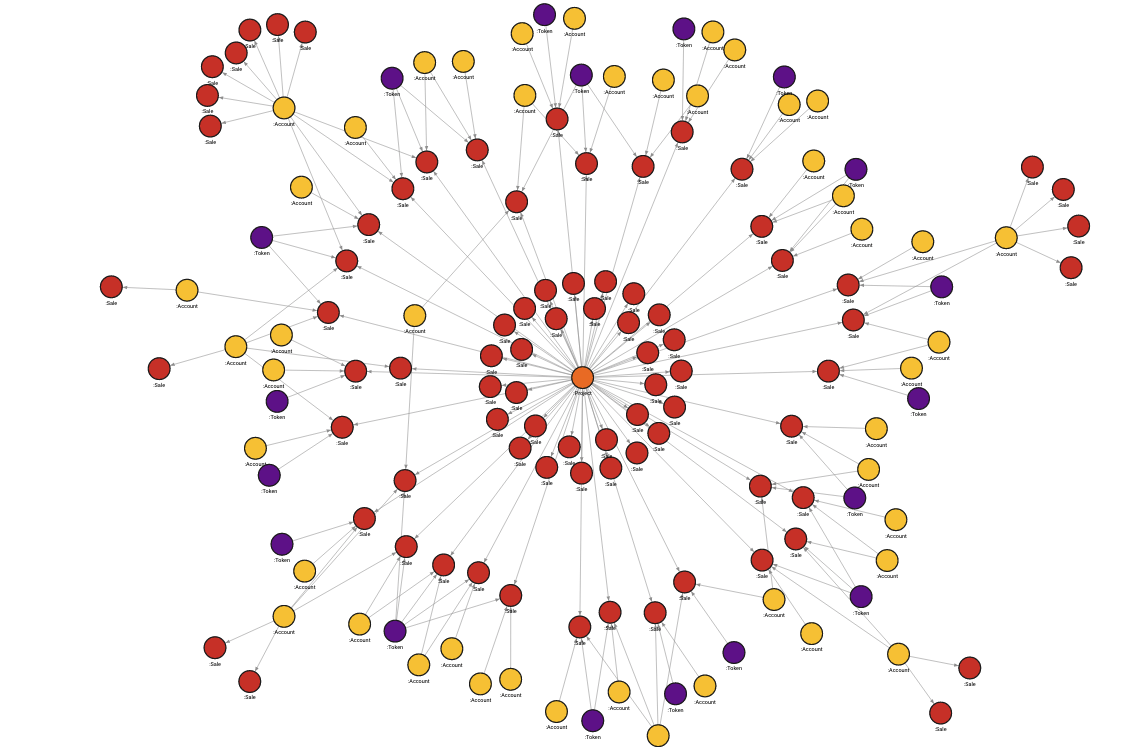
If everything is set up correctly, you should see nodes representing Accounts, Sales, Projects, and Tokens and the relationships between them. For more information on how the dataset is structured, look at the Awesome Data Stream website. In Lab, you can switch between graph results and data results returned by the query, and the graph should look similar to the image below.
Now that everything is set let’s find some cool insides in the dataset.
Exploring the dataset
Before diving into some algorithms, let’s execute some queries to get the feeling for the dataset. A great start is to look at accounts that made sales transactions. Isn’t it interesting to know who the best seller or buyer of NFTs is? You can get the information on the best sellers by running the following query:
MATCH (a:Account)-[r:IS_SELLING]->(s:Sale)
WITH a, count(s) AS num_of_sales
WHERE num_of_sales > 1
RETURN a.account_id, num_of_sales
ORDER BY num_of_sales DESC
LIMIT 10;
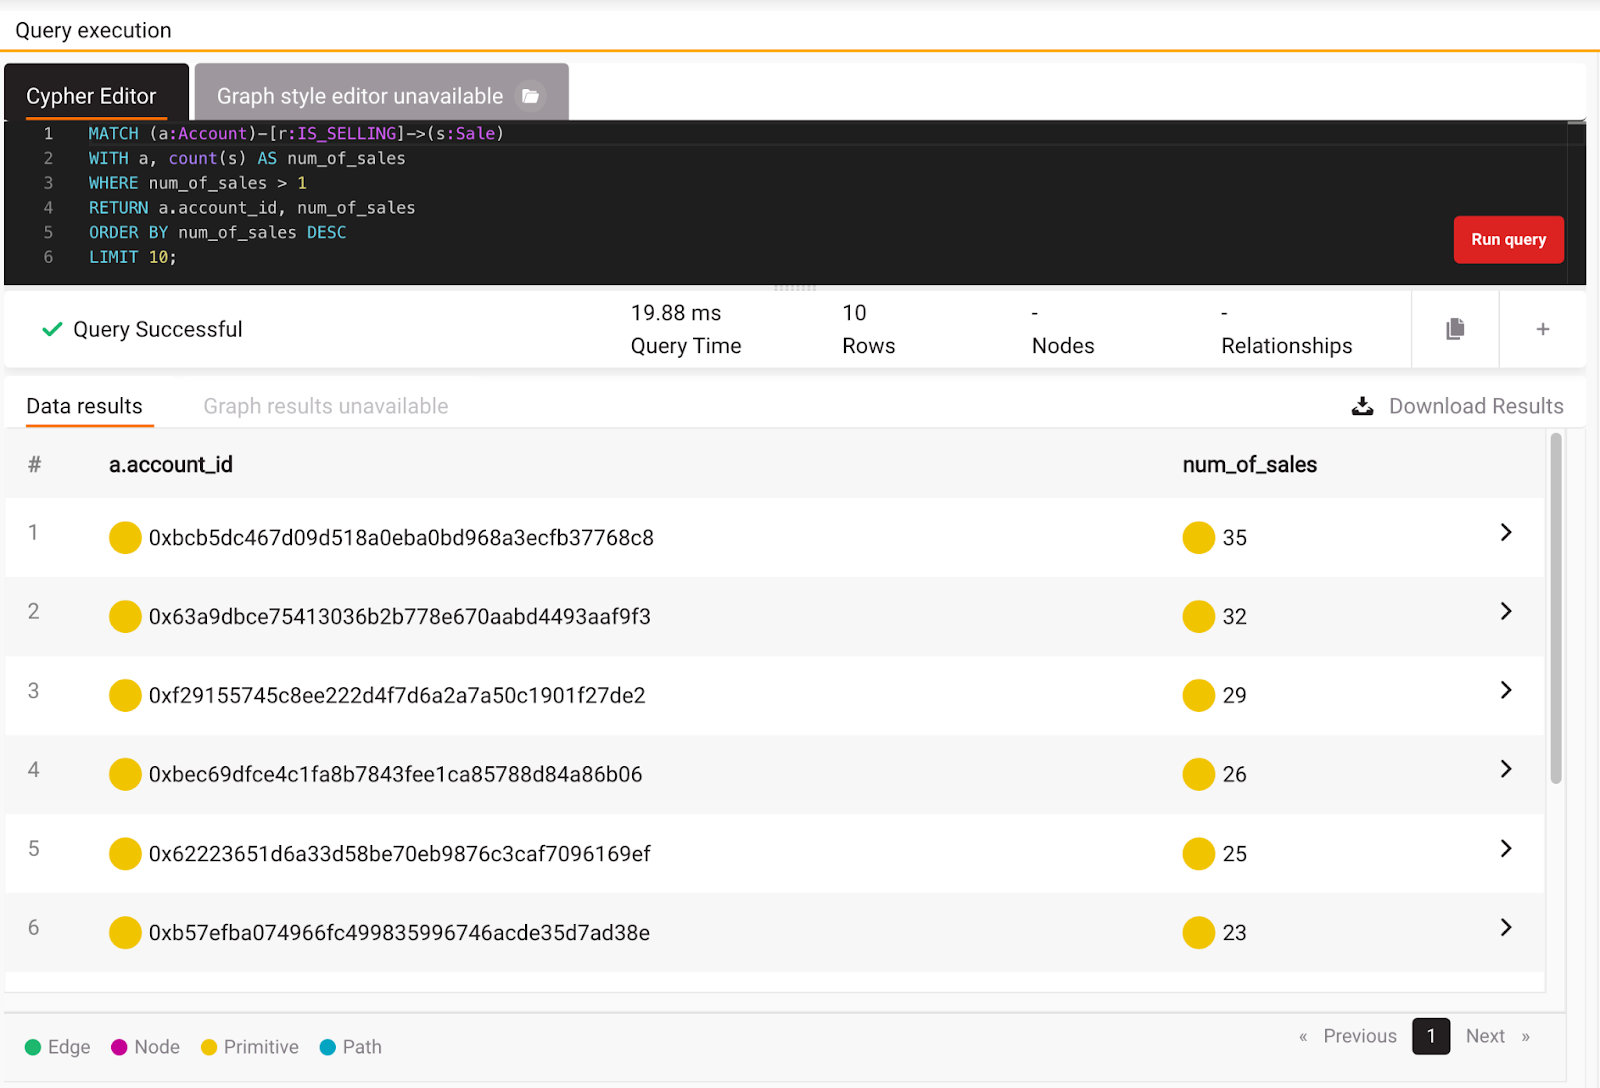
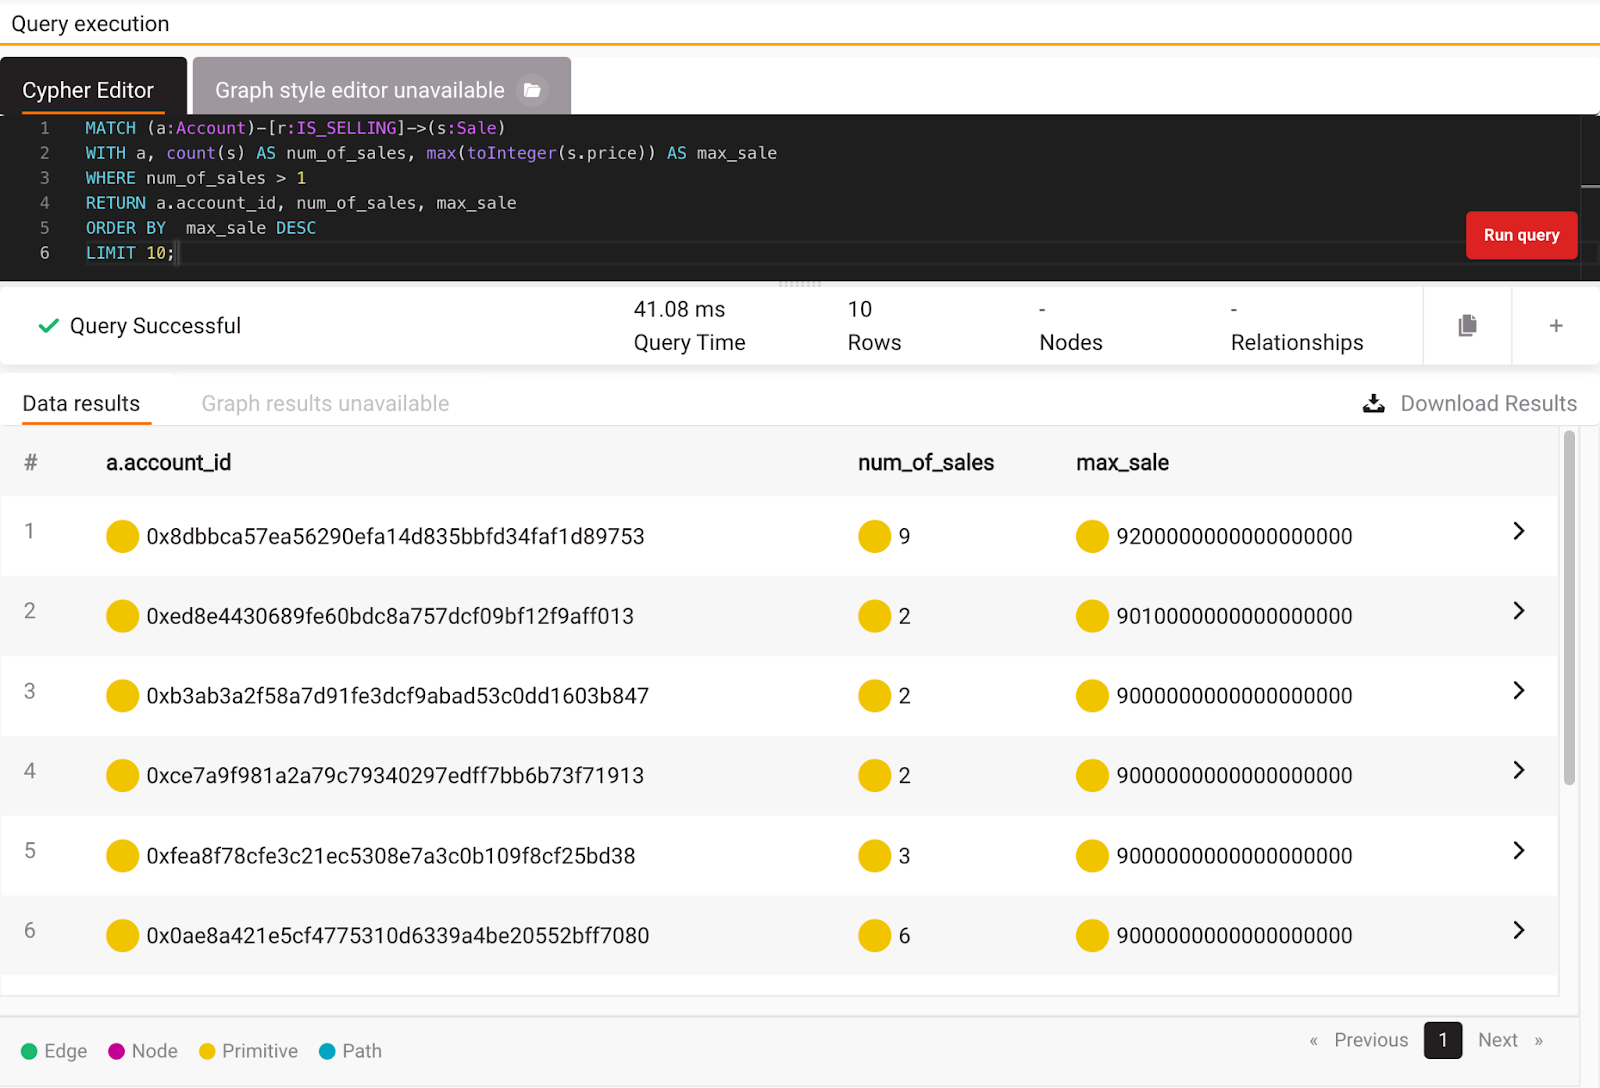
Looks like the best seller has 35 sales at the moment, but this doesn’t mean he has the largest sales numbers. After all, the price defines them. In order to clear the doubt, let’s see who has the largest sales price for NFT and how many sales that account has. You can get this information by running the following query:
MATCH (a:Account)-[r:IS_SELLING]->(s:Sale)
WITH a, count(s) AS num_of_sales, max(toInteger(s.price)) AS max_sale
WHERE num_of_sales > 1
RETURN a.account_id, num_of_sales, max_sale
ORDER BY  max_sale DESC
LIMIT 10;
As you can see in the picture below, the seller with the most sales doesn’t necessarily have the most significant sales price. An account with 9 sales has the largest sales price in the whole dataset. Of course, you could sum up all the sales numbers and easily pick the winner, but feel free to write that query yourself.
Let’s see what was the largest sales price for that seller with 35 sales:
MATCH (a:Account{account_id:"0xbcb5dc467d09d518a0eba0bd968a3ecfb37768c8"})-[r:IS_SELLING]->(s:Sale)
RETURN a.account_id, s.price
ORDER BY s.price DESC
LIMIT 10;
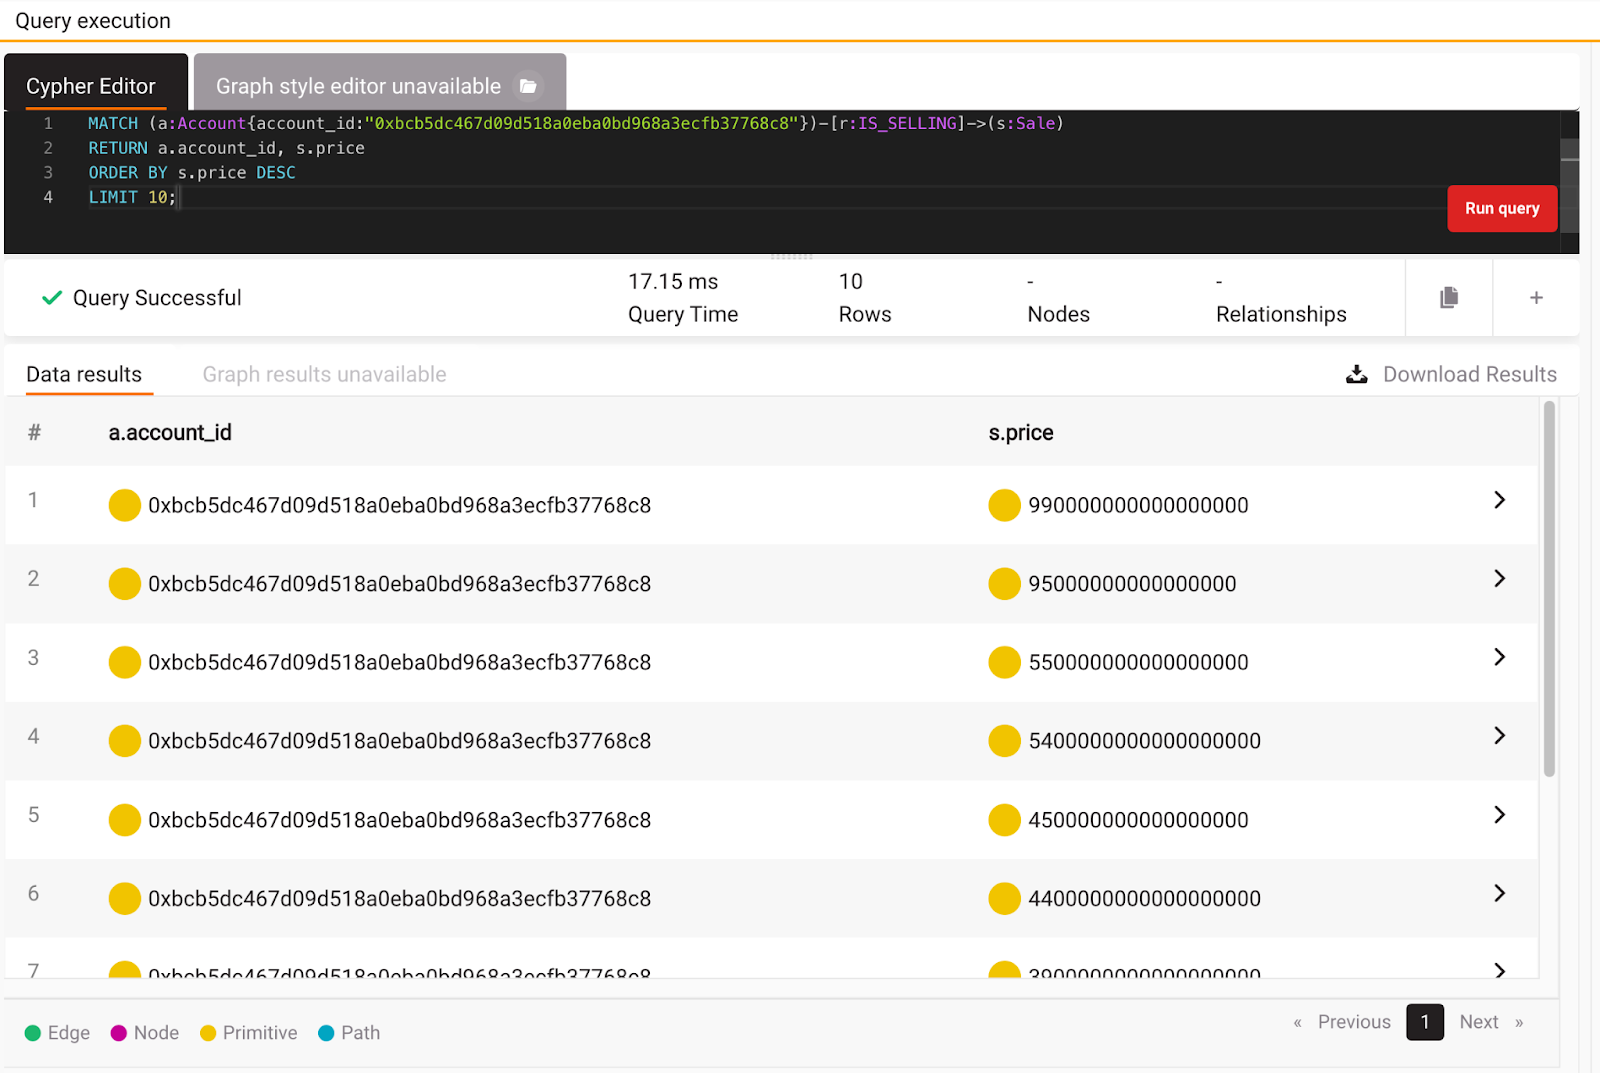
As you can see, he is missing a few zeros to have the largest sales price. After executing a few queries, let’s try to use a different approach to finding some interesting insights into the data.
Finding popular projects, accounts, sales and tokens
There are various ways to explore the data inside Memgraph and get cool insights, but one of the easiest ways is by using graph algorithms inside an open-source repository, MAGE. Let’s use PageRank first. If you are new to graphs, PageRank is an algorithm used by Google Search to rank web pages in their search engine results, and in this dataset, it can be used to find the most popular nodes, in this case, sales, projects, users, and tokens. If you are using Memgraph Cloud or Memgraph Platform, MAGE is already locked and loaded, and you don’t have to read or write a single line of code.
To calculate the most popular node, run the following query:
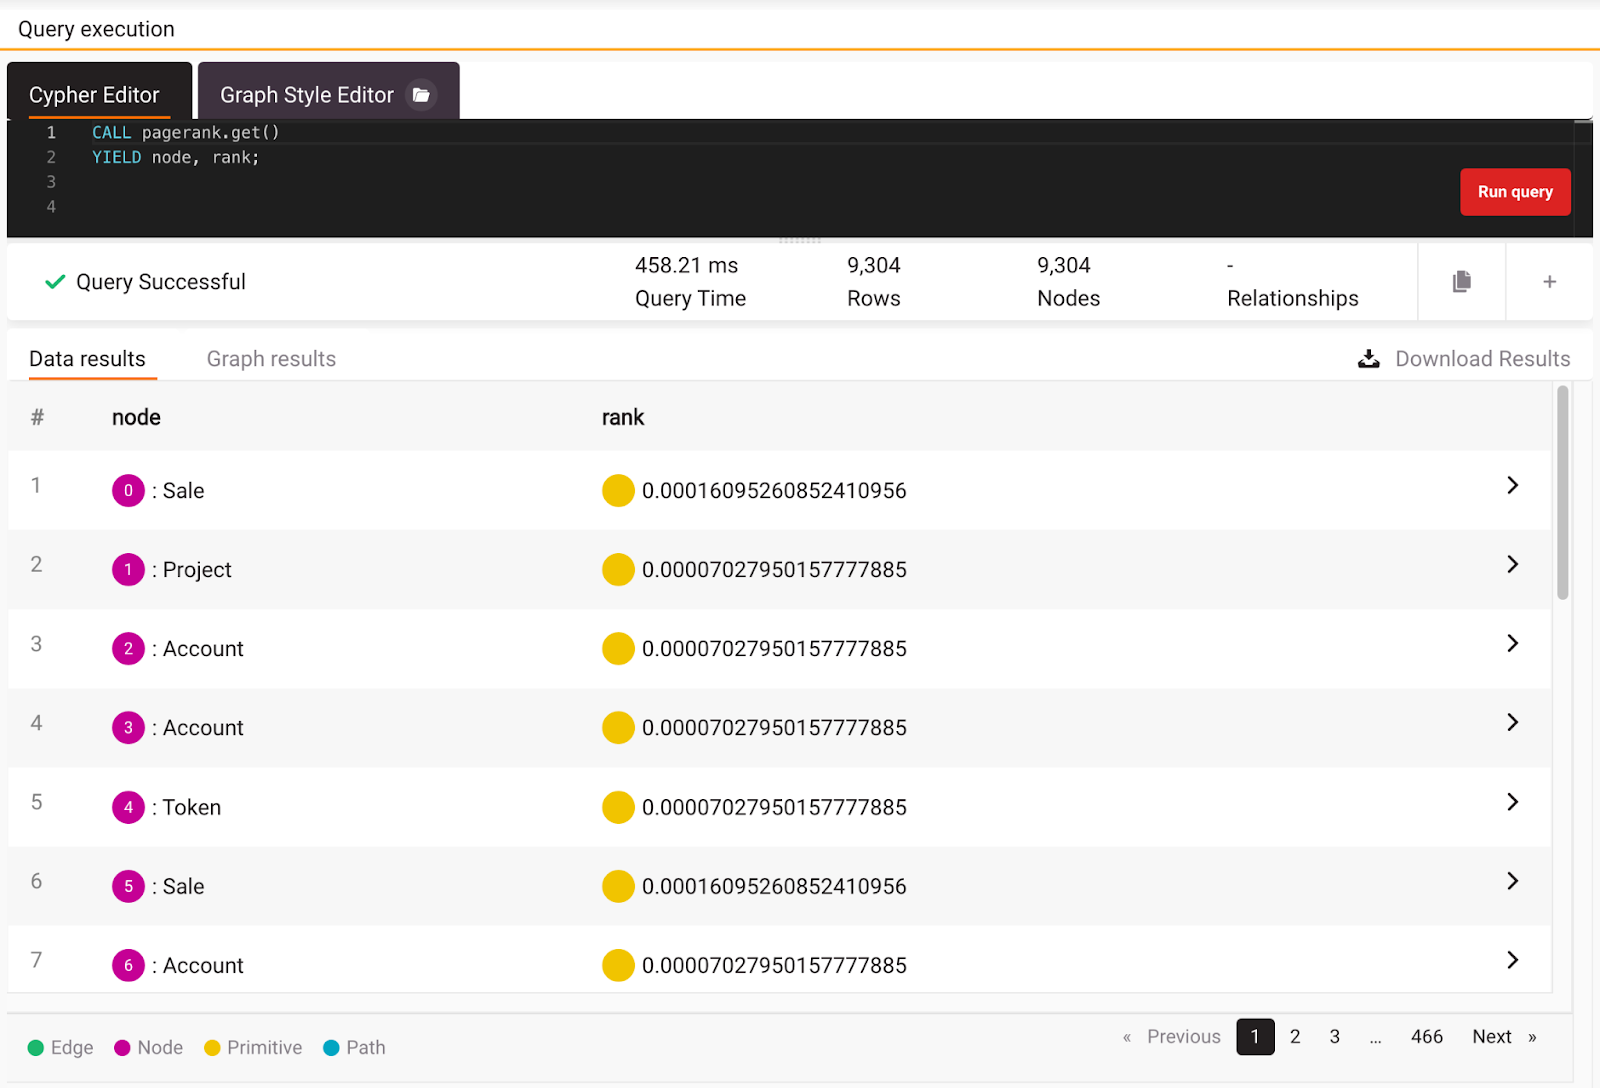
CALL pagerank.get()
YIELD node, rank;
This query will call the PageRank implementation. The function yields the node with a calculated rank that represents the probability that a random surfer will finish at a certain node by a random walk on the graph. The query returns the most popular projects, accounts, sales, and tokens.
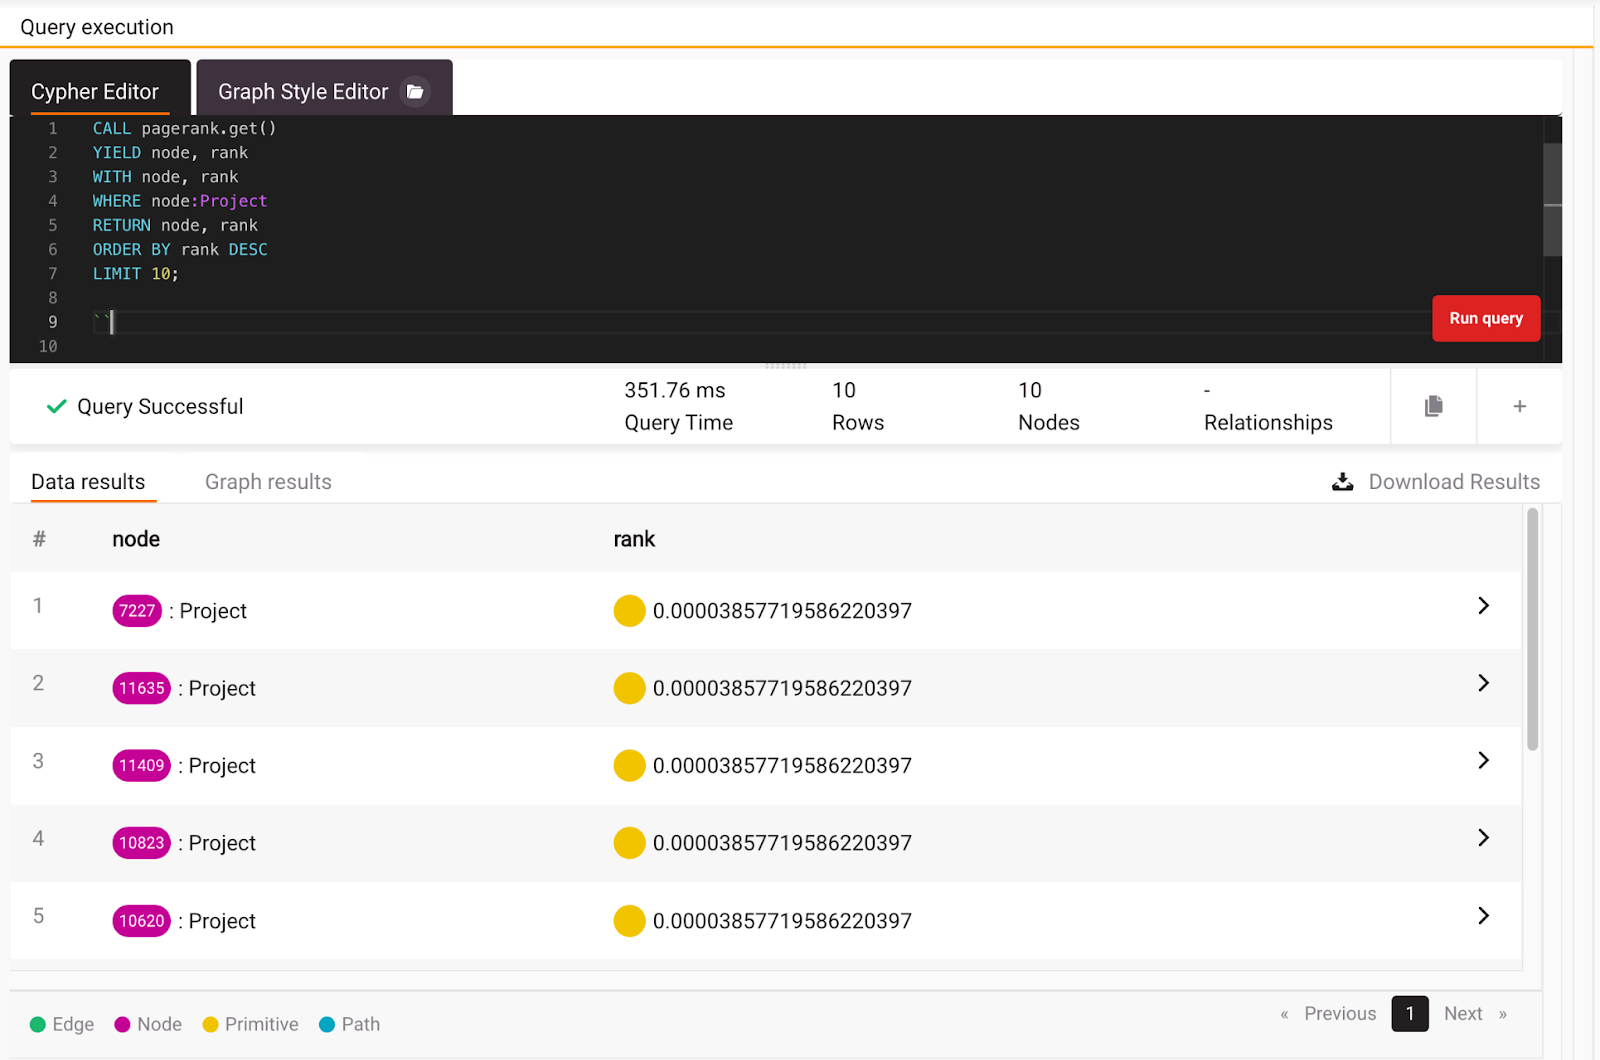
Now that you are clear on how PageRank works, you can check what are the most popular projects by filtering all the nodes with the Project label and returning the top 10 ordered by rank. Here is that exact query:
CALL pagerank.get()
YIELD node, rank
WITH node, rank
WHERE node:Project
RETURN node, rank
ORDER BY rank DESC
LIMIT 10;
As you can see from the image below, almost all of the top 10 projects have similar ranks.
In order to dive deeper and validate previous results, check how many sales the project has.To get the number of sales per project, execute the query below:
MATCH (p:Project)-[:HAS]-(s:Sale)
WITH p, count(s) as num_of_sales
RETURN  p, num_of_sales
ORDER BY num_of_sales DESC;
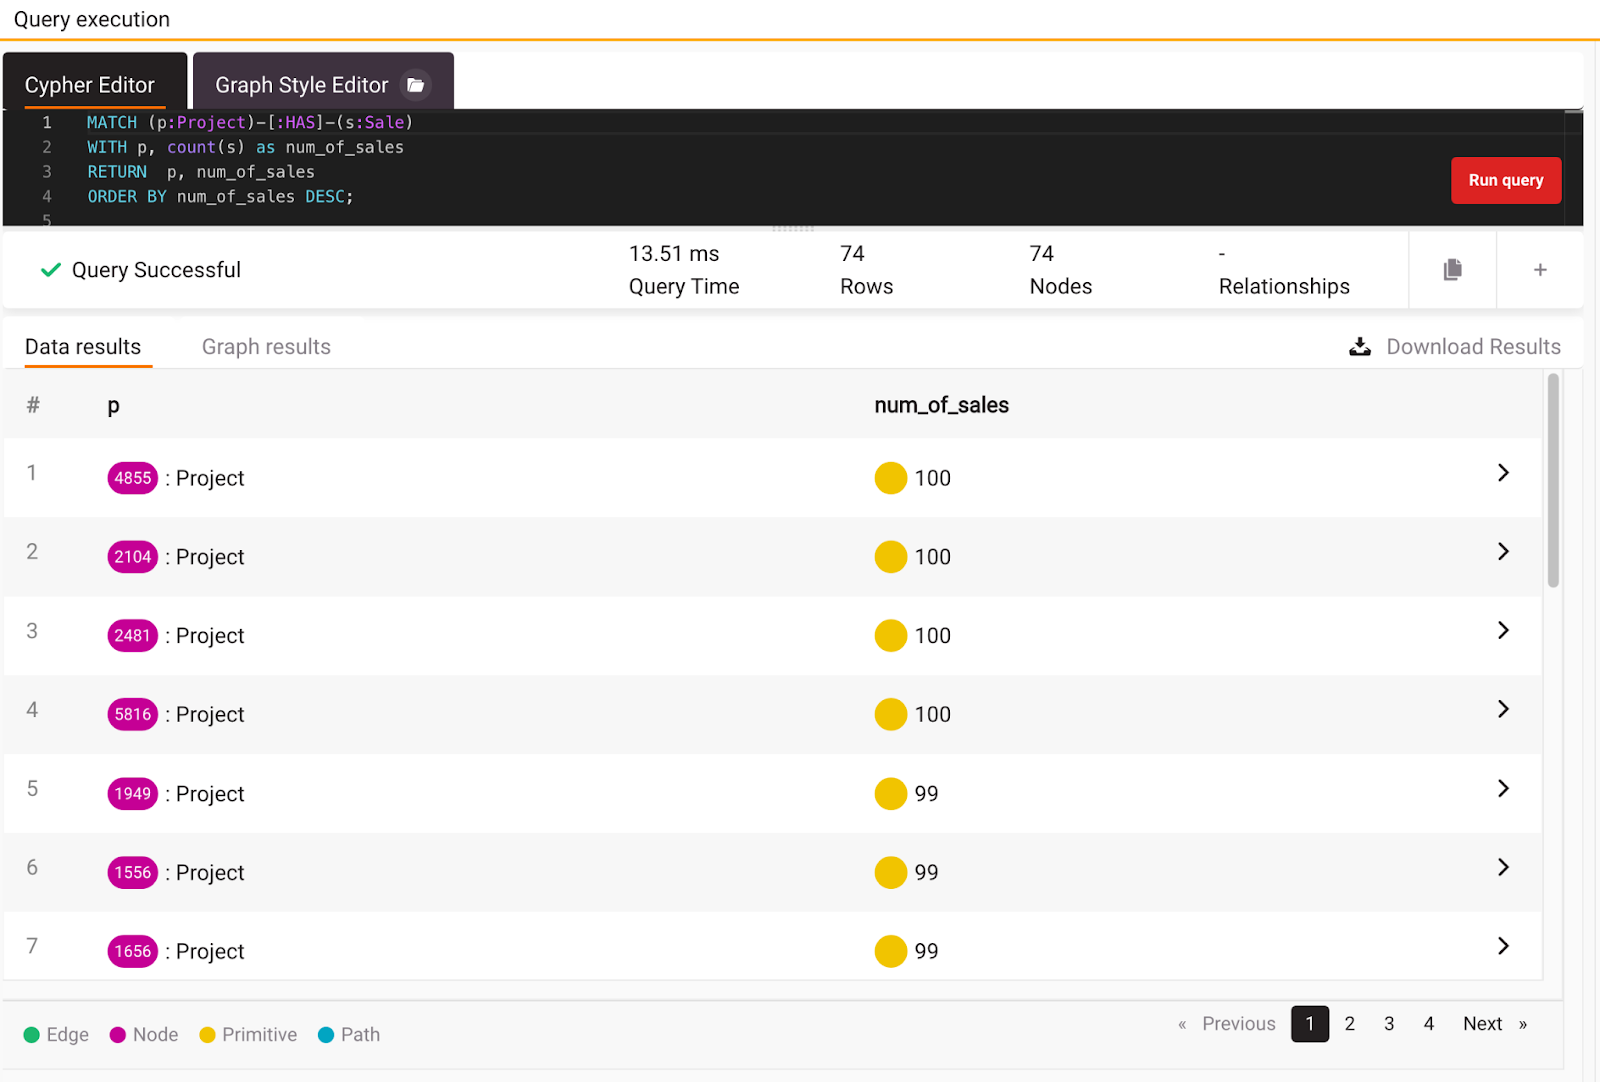
If you look closely, you will notice that most projects have an equal number of sales. That is the reason for similar results from the PageRank algorithm. Feel free to explore other nodes with PageRank, but now let’s switch to community detection to figure out are there any communities inside this streaming dataset.
Community detection
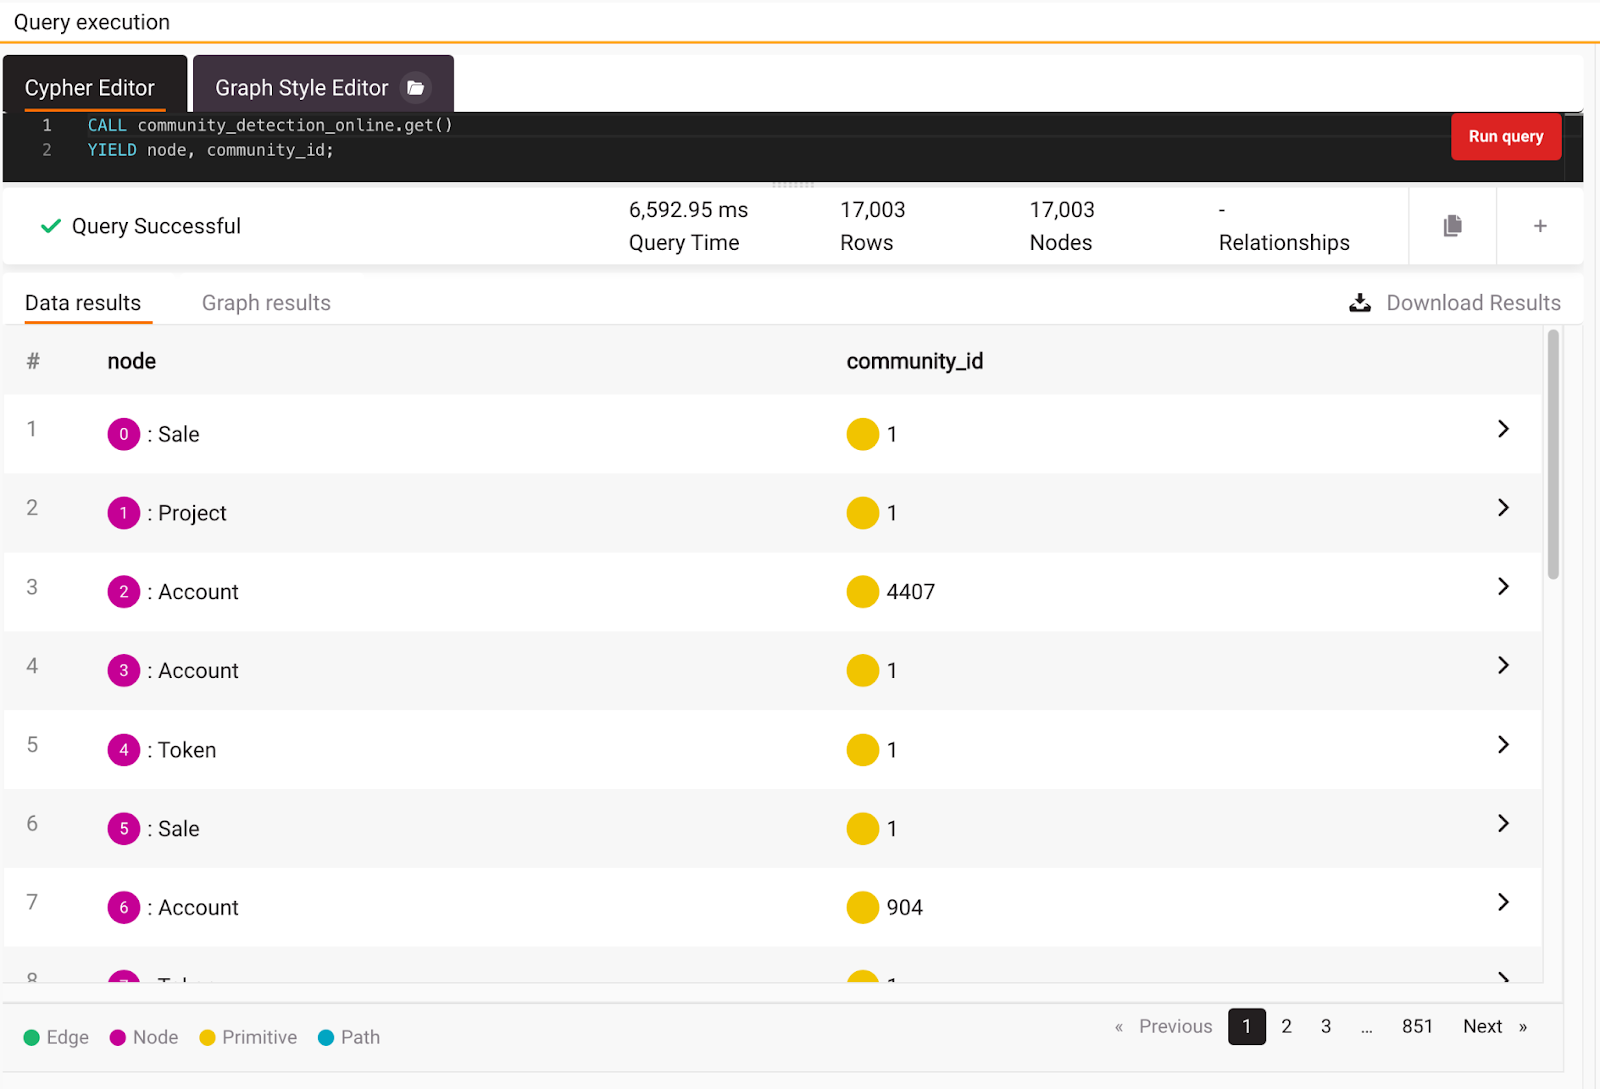
The community detection algorithm will calculate to which community a node belongs. If nodes are connected with multiple relationships from multiple sides, the nodes will belong to an appropriate community of nodes or relationships that share the most connections. To makes things even better, the community detection algorithm is also a part of MAGE. Check it's docs page to find more information on how to use it. But a good start is to execute the following query:
CALL community_detection_online.get()
YIELD node, community_id;
If you look at the results in the image below, you can see that different types of nodes belong to different communities, for example, community_id:1. Notice it took 6 seconds to get community detection results.
In order to get all the nodes and relationships that are involved in a community with community_id:1 you can execute this query:
CALL community_detection_online.get()
YIELD node, community_id
WITH node, community_id
WHERE community_id = 1
MATCH (node)-[r]-(m)
RETURN node, r, m;
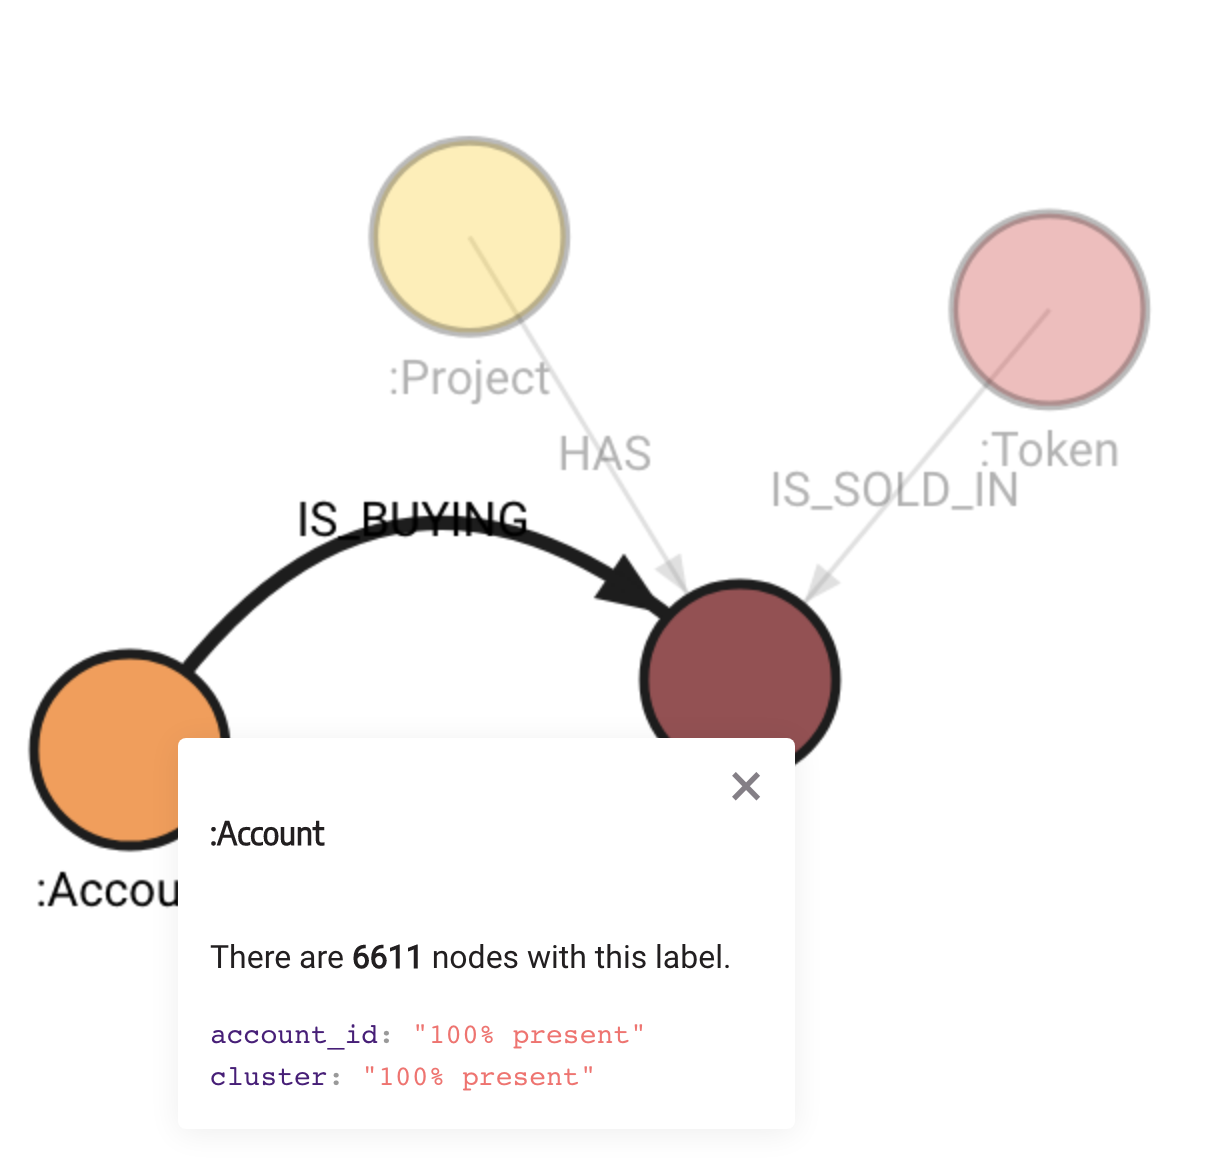
As you can see in the image below, we have all the nodes centered around a single project node. All these nodes belong to the same community or cluster. By further analyzing the cluster, you can find the best sales or prices. This could be quite interesting data to analyze because there is an opportunity to find similar accounts in the project and update the recommendations for those accounts.
As you previously saw, community detection took quite some time to execute. In order to get results from the community detection algorithm, it needs to be executed on a whole graph every time you need to find out a community for a specific node. On top of that, when incoming messages from the stream are stored in the database, the results become outdated. In order to change the dataset dynamically and avoid a bottleneck, you can set up a dynamic implementation of community detection, by running the query below:
CALL community_detection_online.set(False, False, 0.7, 4.0, 0.1, 'weight', 1.0, 100, 5) YIELD *;
To update the dataset in real-time, you also need to set up a trigger. In this case, the trigger will call community detection update for all changed nodes or relationships in the dataset and keep it consistent. In its last line, the trigger places every node within a certain cluster, by setting the cluster property to the value of the community_id.
CREATE TRIGGER community_trigger
BEFORE COMMIT
EXECUTE CALL community_detection_online.update(createdVertices, createdEdges, updatedVertices, updatedEdges, deletedVertices, deletedEdges)
YIELD node, community_id
SET node.cluster=community_id;
The cluster property enables the execution of the query related to community detection to last milliseconds instead of seconds.
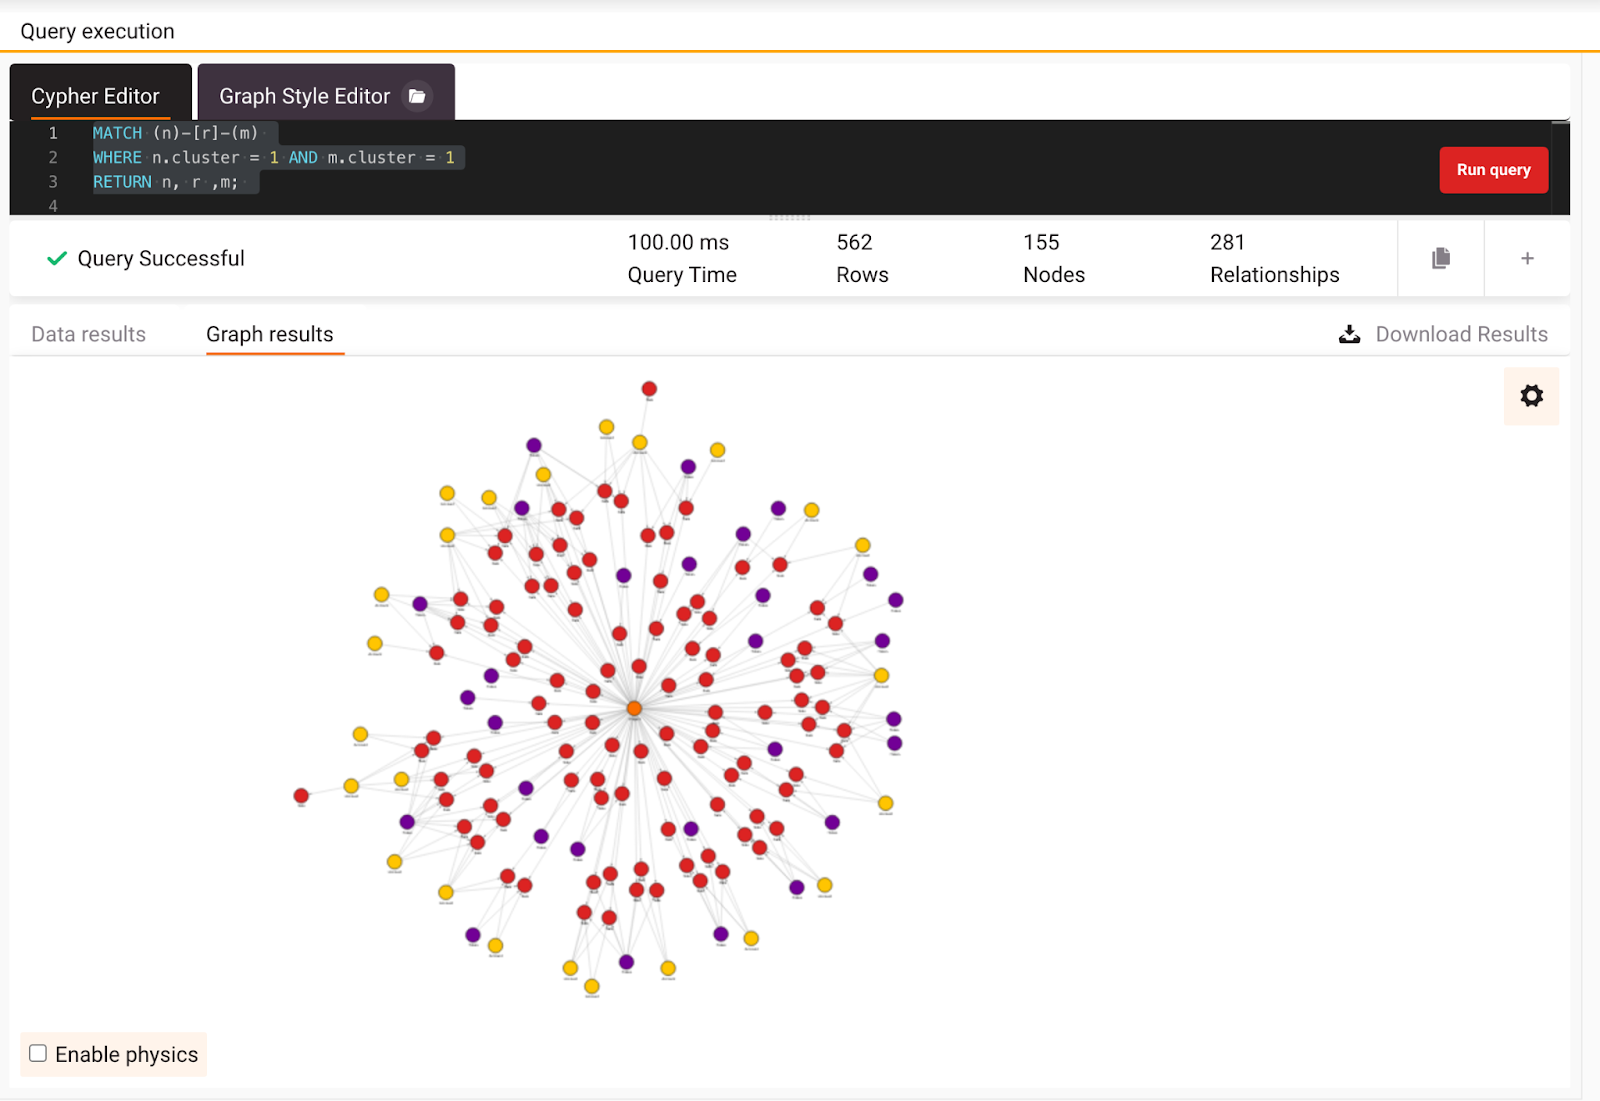
Running the query related to community detection now includes only matching the nodes. If you execute the query below, you will get all the nodes that are a part of cluster=1, but the results will be returned much faster.
MATCH (n)-[r]-(m)
WHERE n.cluster = 1 AND m.cluster = 1
RETURN n, r ,m;
In the image below you can see the results and nodes of the requested cluster, around a single project node.
Conclusion
Exploring any dataset can be quite a challenge, but with a few lines of Cypher query and the power of MAGE you can set up and analyze real-time streaming data in miliseconds. That is the reason why this blog was focused on exploring the dynamic Art Blocks dataset with basic queries, running the PageRank and Community detection algorithm from MAGE. On top of that, it demonstrated how to update the dataset with incoming stream data for the more efficient performance of the community detection algorithm.
Feel free to play around with another dataset available on the Awesome Data Stream website. For example, check out another tutorial on how to get real-time book recommendations based on the Amazon book dataset. If you come across any issues or want to discuss something related to this article, drop us a message on our Discord server.