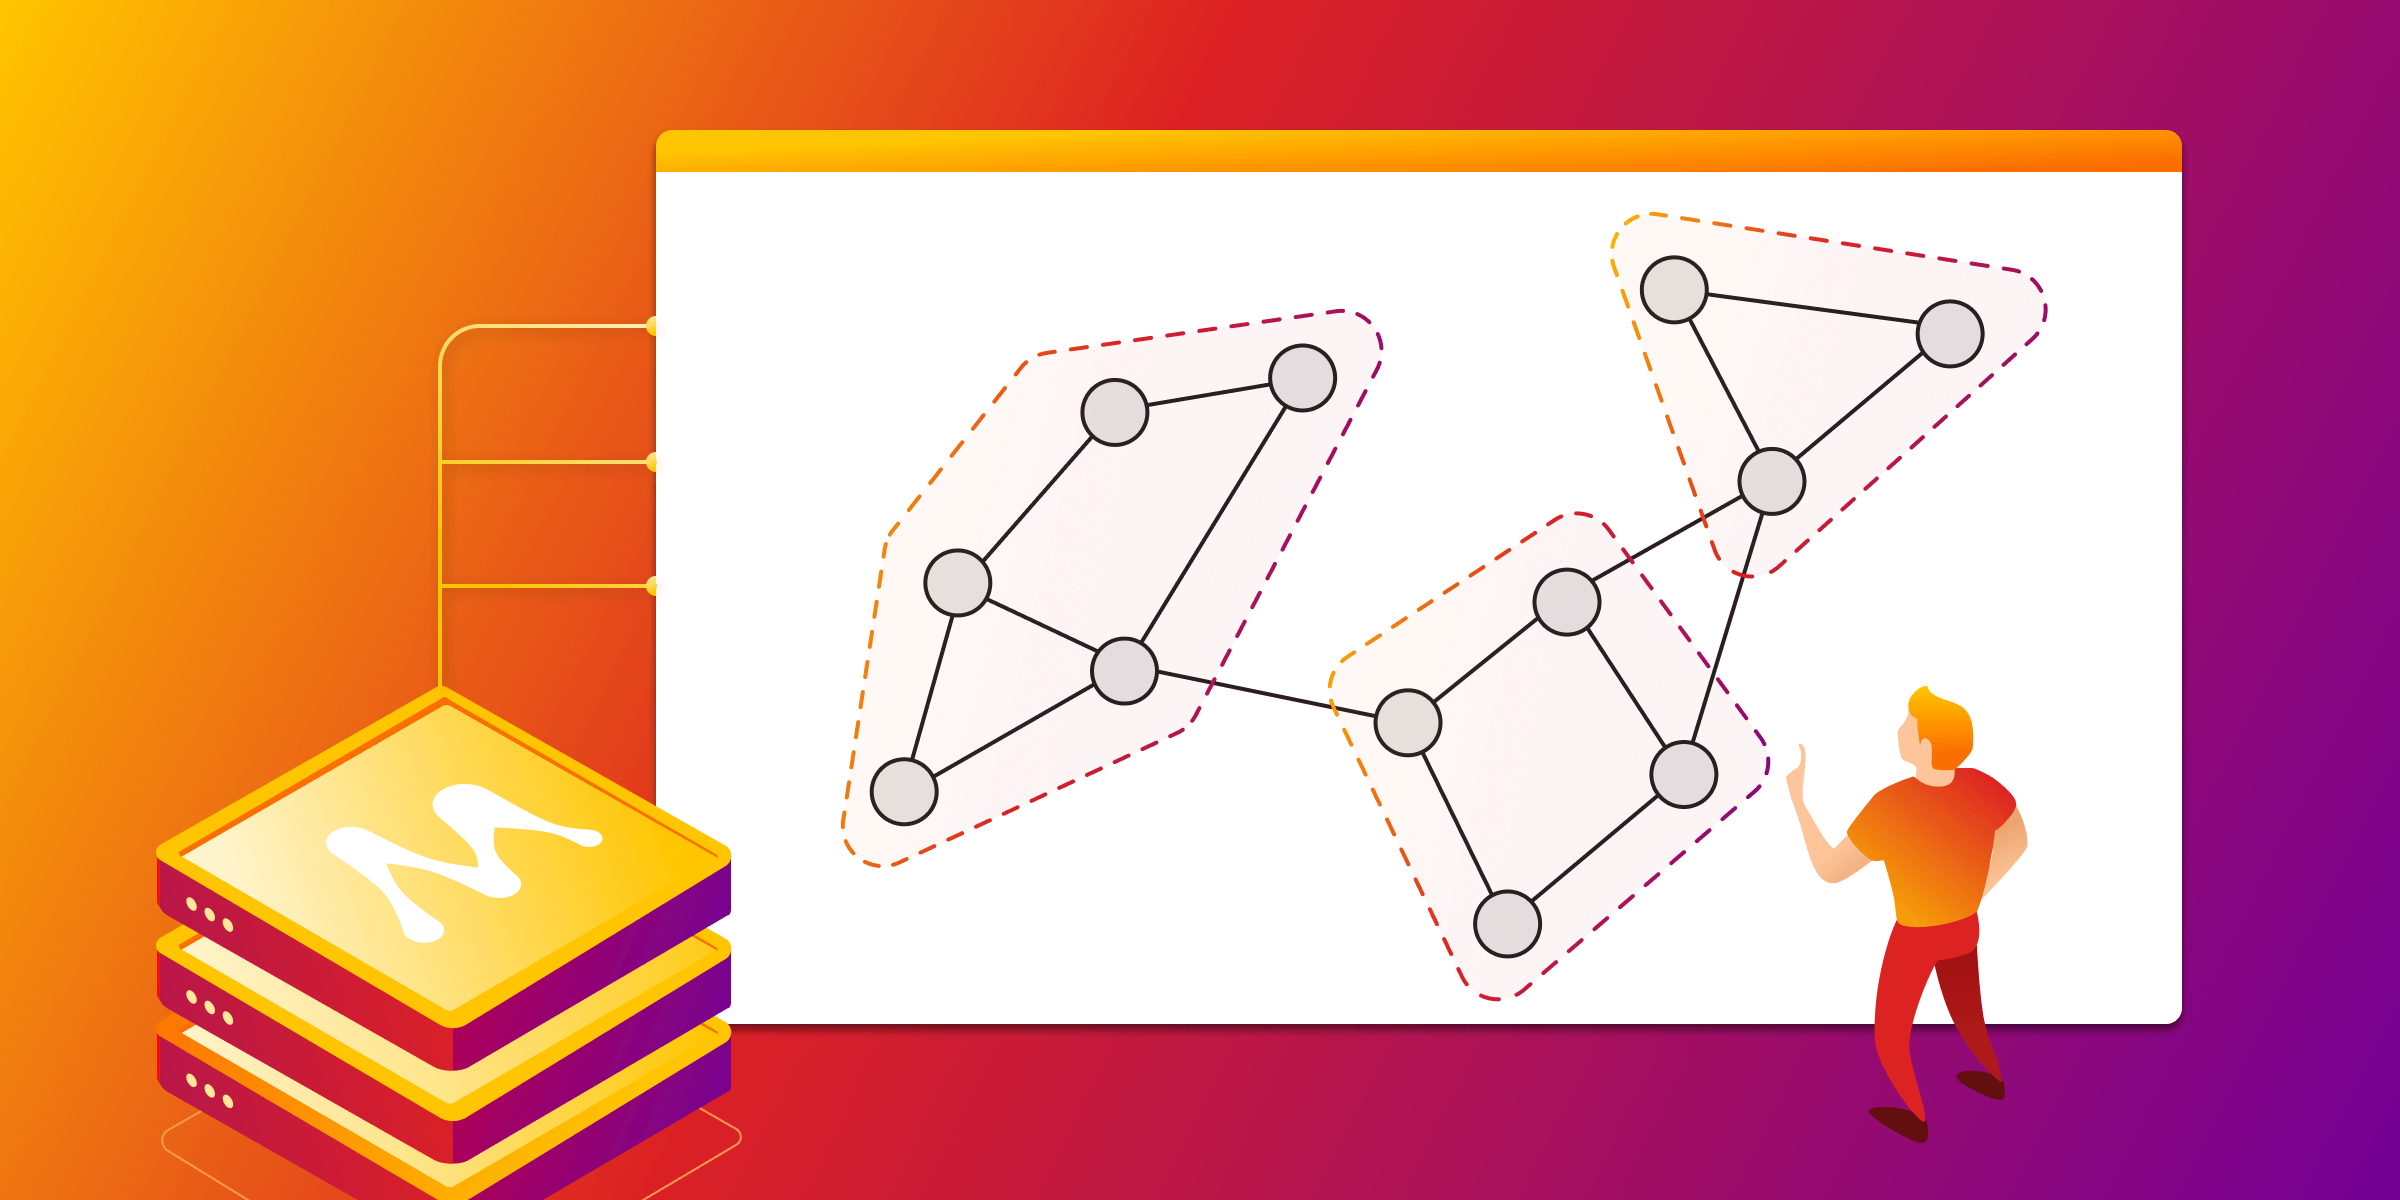
Graph Clustering Algorithms: Usage and Comparison
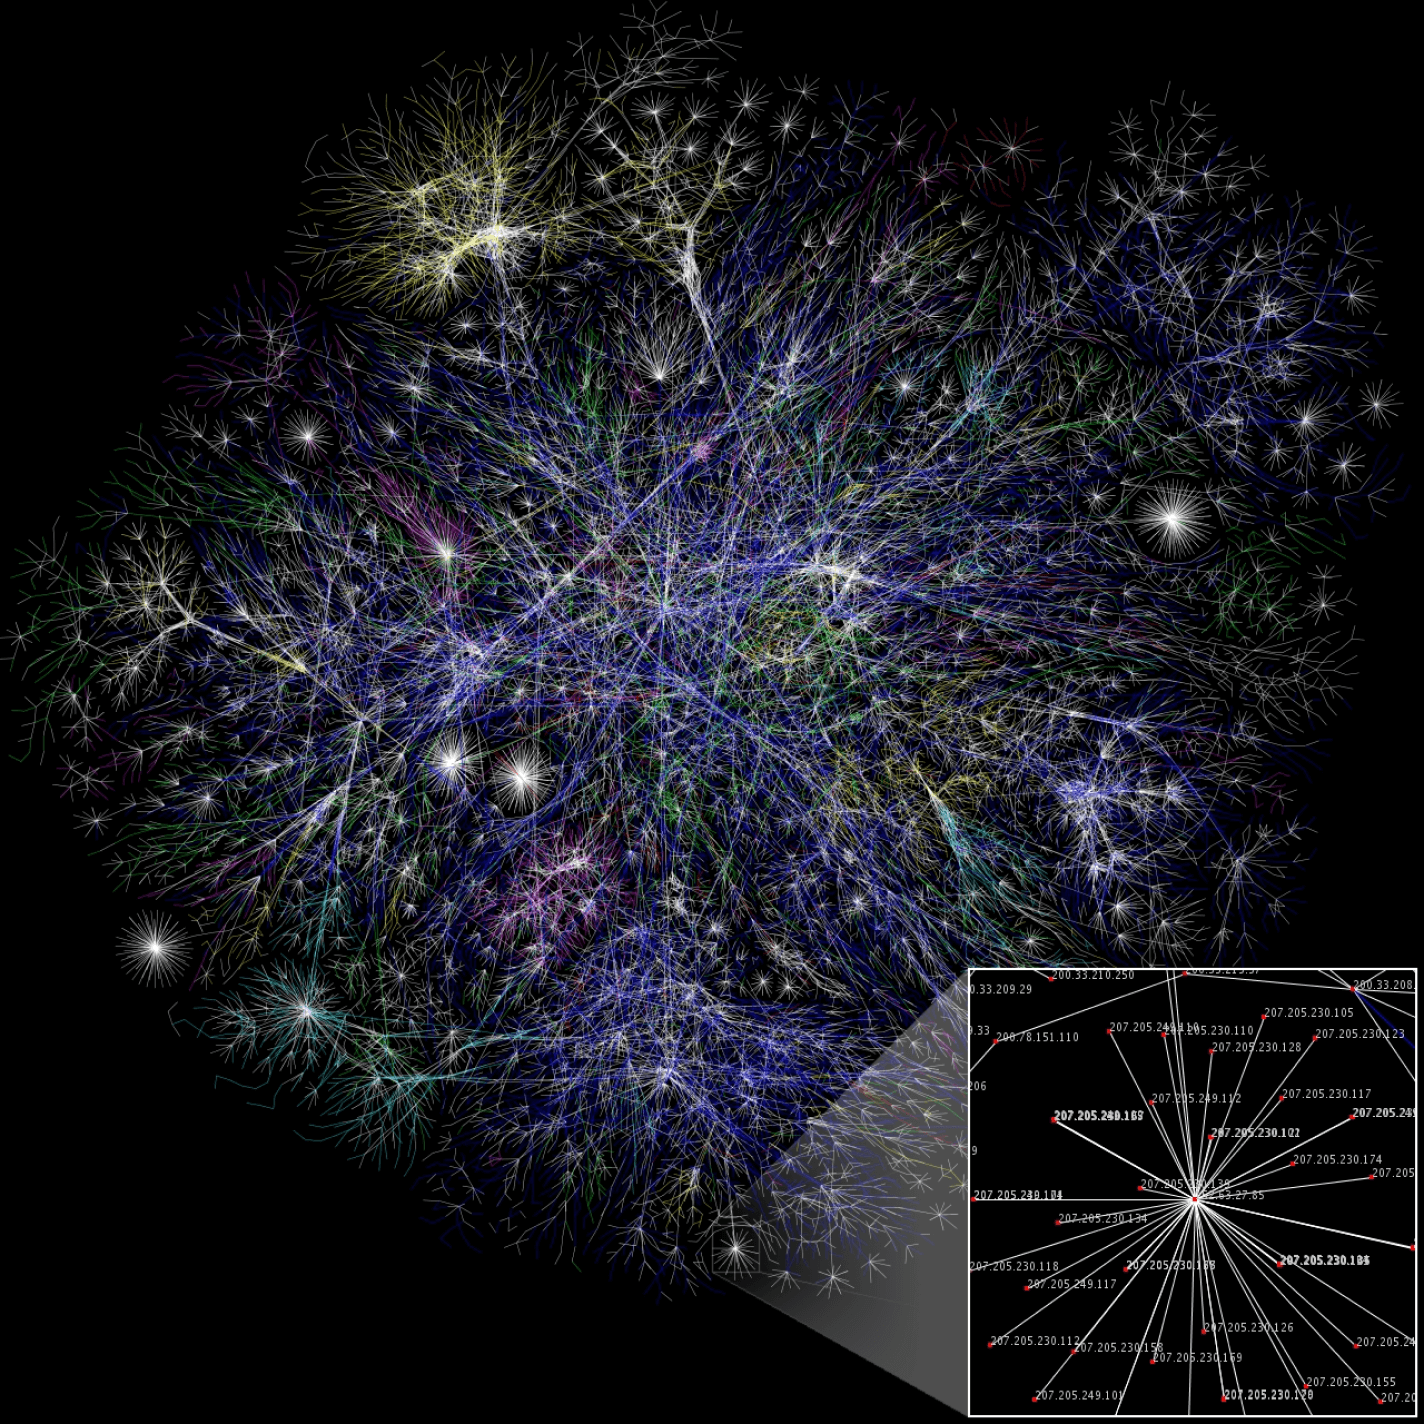
In the realm of data analysis, graph clustering algorithms have emerged as powerful tools for uncovering patterns, communities, and structures within complex networks. From social networks and biological systems to recommendation engines, these algorithms enable data scientists to gain insights and make informed decisions that create value. This article will explore the landscape of graph clustering algorithms, covering the key concepts, common techniques, and real-world applications thereof.
Graph clustering explained
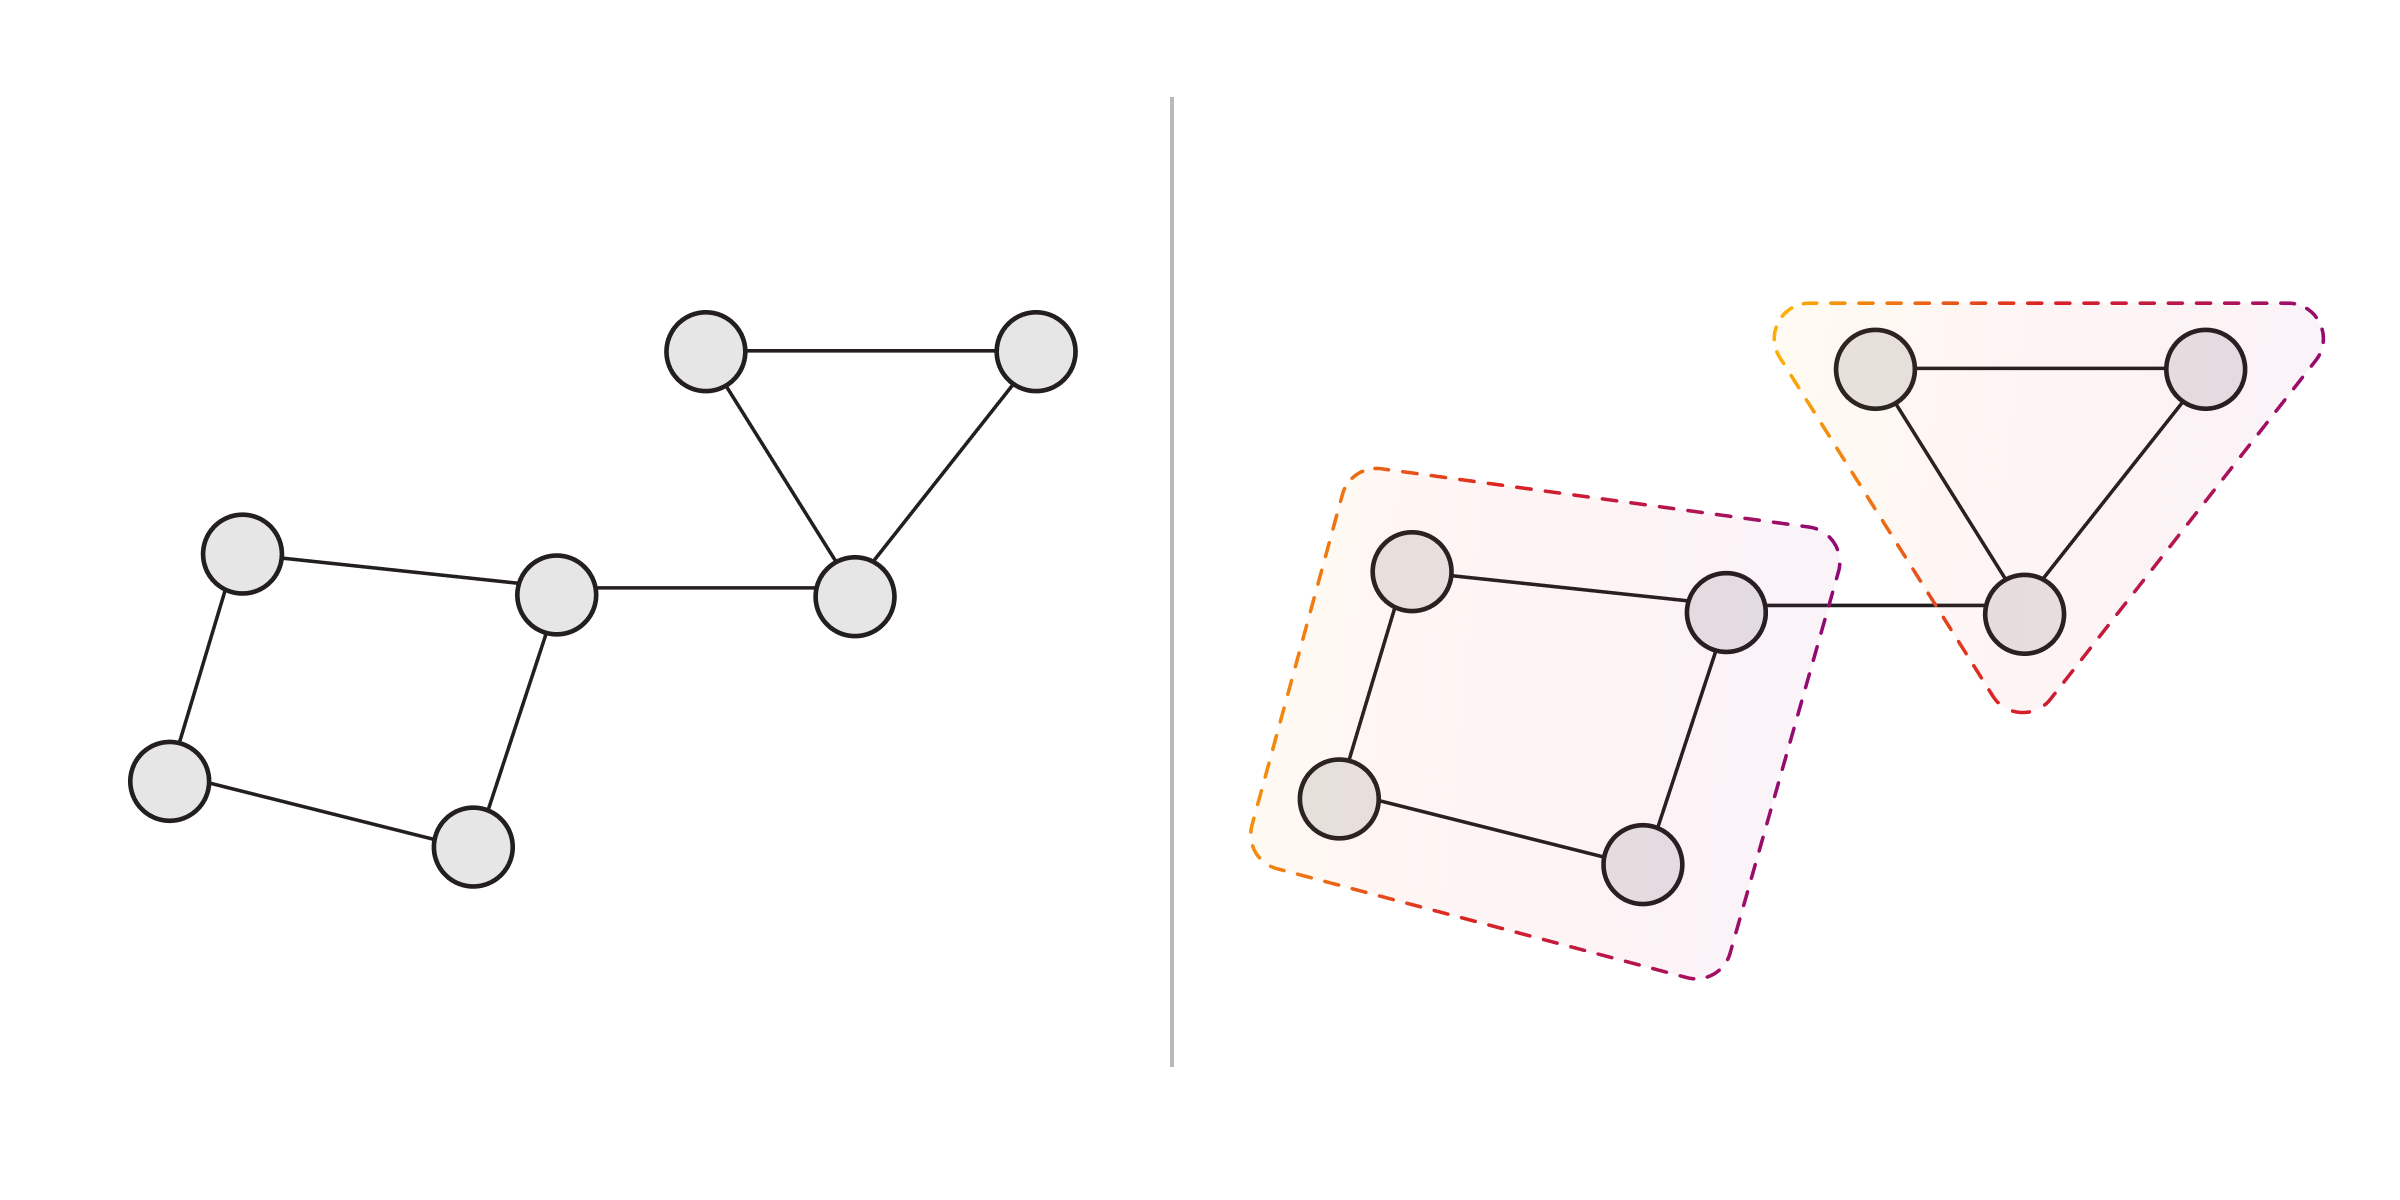
Graph clustering is a branch of unsupervised learning within machine learning, that is about partitioning nodes in a graph into cohesive groups (clusters) based on their common characteristics. As a rule of thumb, nodes assigned to the same cluster have more properties in common with each other than with nodes in different clusters. Depending on the choice of method, those properties might be predefined values, or implicitly computed from the graph’s connectivity structure.
By identifying the clustering of a graph or as a result of cluster analysis, we gain a deeper understanding of it on two levels:
- The structure of the graph as a whole
- The nodes and relationships themselves
This means that different algorithms around graph clustering find applications in various domains.
Applications of graph clustering algorithms
Social network analysis: These algorithms help identify communities, influential individuals, and opinion leaders in social networks. Because of that, they are used in marketing, and they also find a role in understanding social dynamics.
Recommendation Systems: Recommender systems are quite connected to the previous point where the use of graph clustering algorithms helps to group similar objects, people, or items based on user behavior. Recommendation systems use this data to help users discover new accounts and receive relevant ads.
Biological network analysis: Protein-protein interaction networks and gene expression networks are computationally represented as graphs, which means that graph clustering is applicable for identifying their functional modules. This lets researchers gain insights into their components’ roles and interactions for further study of biological processes.
Security and fraud detection: Graph clustering algorithms can detect outliers or anomalies within networks, helping identify fraudulent activities, money laundering patterns, or malicious actors. With the data they provide, these algorithms assist in maintaining network security and preventing crime in finance and insurance.
These are just a few examples of where graph clustering has shown utility. In fact, the knowledge of graph clusters is applicable to any problem that is expressible in terms of networks and patterns contained in their structure.
Common graph clustering methods
The landscape of graph clustering techniques is large and varied, but certain techniques are commonly used in practice:
k-means clustering
k-means clustering partitions a graph into k distinct clusters, where k is a user-defined quantity. It requires a node representation of some sort and a similarity measure that works with the said representation.
Initially, the technique creates k points (centroids) at random and assigns nodes to the nearest centroid using the given similarity measure. Next, it “moves” each point to the very center of its cluster and checks if there are any nodes that ended up nearer to a different point than before. If so, they are reassigned to the other point’s cluster.
Next, the technique iteratively recomputes the centroids based on the latest-formed clusters until convergence, i.e. the point when cluster assignments stop changing between iterations.
k-means clustering owes its popularity to the availability of optimized algorithms that scale to large datasets and to its output quality. However, it requires the user to predefine the number k of clusters, and that parameter is known to be hard to choose.
Hierarchical clustering
Hierarchical clustering refers to clustering algorithms based on a tree-like structure (dendrogram) of graph nodes that are built in any of the following ways:
- Each node starts in its own cluster, and pairs of clusters are merged bottom-up (agglomerative strategy).
- All observations start in one cluster, and clusters are iteratively split top-down (divisive strategy).
Like k-means clustering, this technique relies on similarity measures to determine what cluster a particular node belongs to. Similarity measures generally use scalar or vector values and not nodes themselves, which means that users need to provide a compatible representation such as node embeddings.
An upside of hierarchical clustering is its output: the dendrogram is a visual, interpretable structure of the graph’s cluster partition. On the other hand, this type of clustering algorithms have high complexity and aren’t scalable to large datasets.
Node embedding
Node embedding is a technique that represents graph nodes as vectors in a low-dimensional space. In broad lines, similar nodes will have similar embeddings (vectors) and vice versa. The idea behind is that there’s a wealth of mathematical methods that can be used to group similar vectors into clusters.
To illustrate, k-means clustering and hierarchical methods both require a similarity measure. With graph data, that often means you need to provide graph embeddings because raw node data doesn’t contain enough information to calculate similarity.
However, there are also graph clustering techniques that don’t use similarity data. Instead, they rely on connection data to assign nodes to clusters.
Modularity-based algorithms
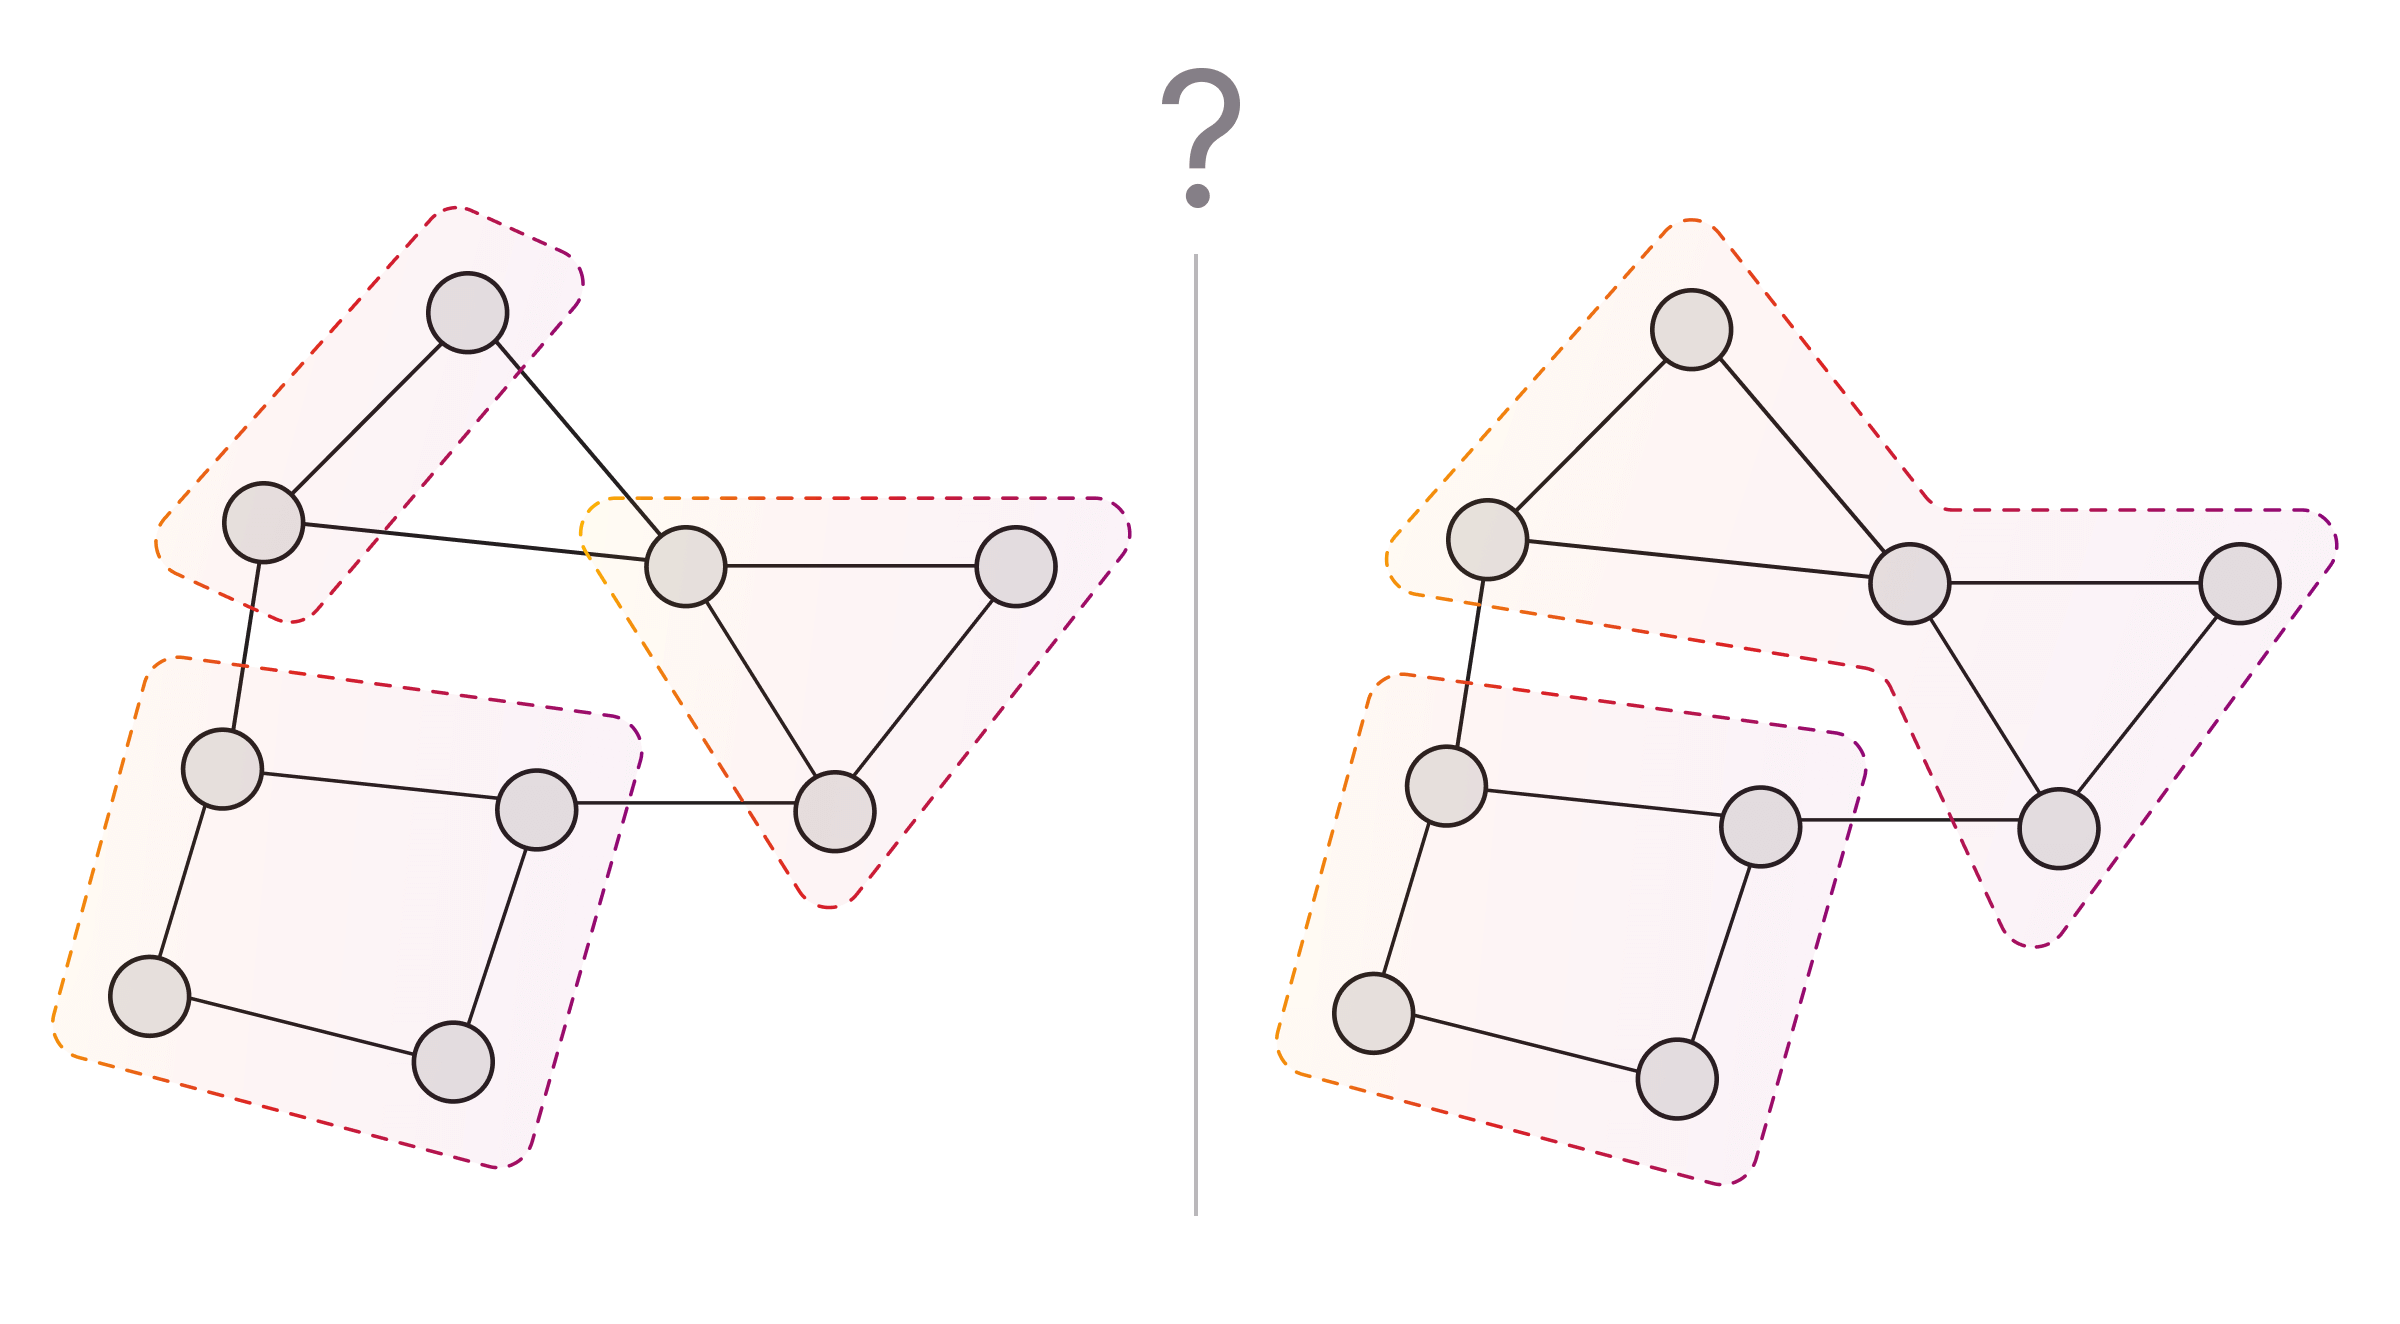
Modularity-based algorithms like Louvain and Leiden optimize for the graph partition with maximum modularity. The modularity of a graph is a statistical measure that reflects the concentration of relationships within clusters compared with a random distribution of relationships.
These algorithms sort nodes into clusters using the connectivity structure of the graph, and their scalability depends on the method used to maximize modularity.
Label propagation
Label propagation works by labeling each node and iteratively passing the labels between neighboring nodes. Labels are associated with probabilities, and each node is ultimately assigned its most probable label.
In general, label propagation algorithms are fairly scalable, and their output is distinctive in that it finds "exemplars," nodes that are representative of their clusters. That is, if a node is highly representative of its cluster, its label will tend to propagate through it and win out over other labels.
Choosing the right algorithm
Domain-specific and technical factors both influence the choice of algorithm for graph clustering problems.
Domain-specific factors
The question-alignment approach helps users leverage their domain knowledge to choose suitable algorithms. The first step is to clearly define the task at hand and state how the approach (graph clustering here) can be used to solve it. Next, three questions serve as guidelines:
- What process(es) are driving the formation of specific communities within a network (graph)?
- How do the main variables of interest interact with the network?
- What do relationships represent in the network?
Answers to these questions can guide the selection of a specific graph clustering algorithm. To give an example, researchers tasked with developing a cost-efficient strategy to prevent flu transmission by promoting hygiene created a social network graph whose nodes and relationships represented individuals and their in-person interactions, with hand hygiene as the variable of interest.
The prototypical community at high risk of transmission is a tightly-knit group where at least some people have poor hand hygiene, and the researchers used community detection (graph clustering) to identify such communities. Having concluded that they searched for algorithms that define communities based on transmission and zeroed in on flow-based algorithms.
This approach helps users motivate and justify their choices, but it should be used in conjunction with paying attention to technical factors.
Technical factors
The technical factors involved in this matter deal with the size and structure of the graphs being analyzed. For example, big data applications call for scalable algorithms, and graphs, where relationship weight or direction are important, may be best served by algorithms that take them into account.
Streaming is another use case that can influence the choice of algorithm. If your graph is connected to a data source that gradually streams new data to it, online clustering algorithms are probably the best option because they save up on computation time by reusing the previous run’s results.
Graph clustering in Memgraph
Memgraph is a high-performance graph database that’s able to accommodate use cases with complex data relationships that require real-time processing and high scalability. This includes graph data science – Memgraph’s MAGE graph data science library comes with optimized algorithms that you can run directly on the stored graph. The graph clustering algorithms in MAGE are as follows:
- K-means: in the
kmeansmodule - Louvain clustering: implemented in
community_detection - Label propagation: implemented in
community_detection_online - node2vec: implemented in the
node2vecandnode2vec_onlinemodules; the online variant is suited for dynamic graphs
More graph clustering methods are available in third-party data science libraries accessible via MAGE:
- Balanced-cut and spectral clustering: NVIDIA’s cuGraph comes with optimized GPU implementations of these algorithms.
- Leiden clustering: This modularity-based method is available in igraph.
Curious about how to apply them? Make sure to check out our article on how to analyze commits in a GitHub social network.
If you’re working with a heterogeneous graph and you want to determine the clustering on its subset, you can make use of Memgraph’s graph projection feature. With it, you can isolate a portion of the graph to run graph clustering (or any other algorithm) on it alone, or even “zoom in” on a single cluster to study it in-depth without sacrificing algorithm performance.
Final thoughts
Graph clustering algorithms provide insights into complex networks, helping data scientists connect their properties with the problems at hand and make informed decisions in diverse fields from bioinformatics to marketing, or even security and fraud detection.
Memgraph with MAGE is a one-stop solution for use cases that involve graphs and data analysis on them. Try out Memgraph, and let us know what you think! You might also find it helpful to explore the documentation, join our growing community on Discord, or even share your projects with us.