Understanding Cosine Similarity in Python with Scikit-Learn
Cosine similarity helps you compare text, embeddings, and other feature vectors without focusing on raw document length. In this article, you’ll learn what cosine similarity measures, how to calculate it in Python with scikit-learn, and when it makes sense to use Memgraph for graph-native similarity workflows.
What Cosine Similarity Measures
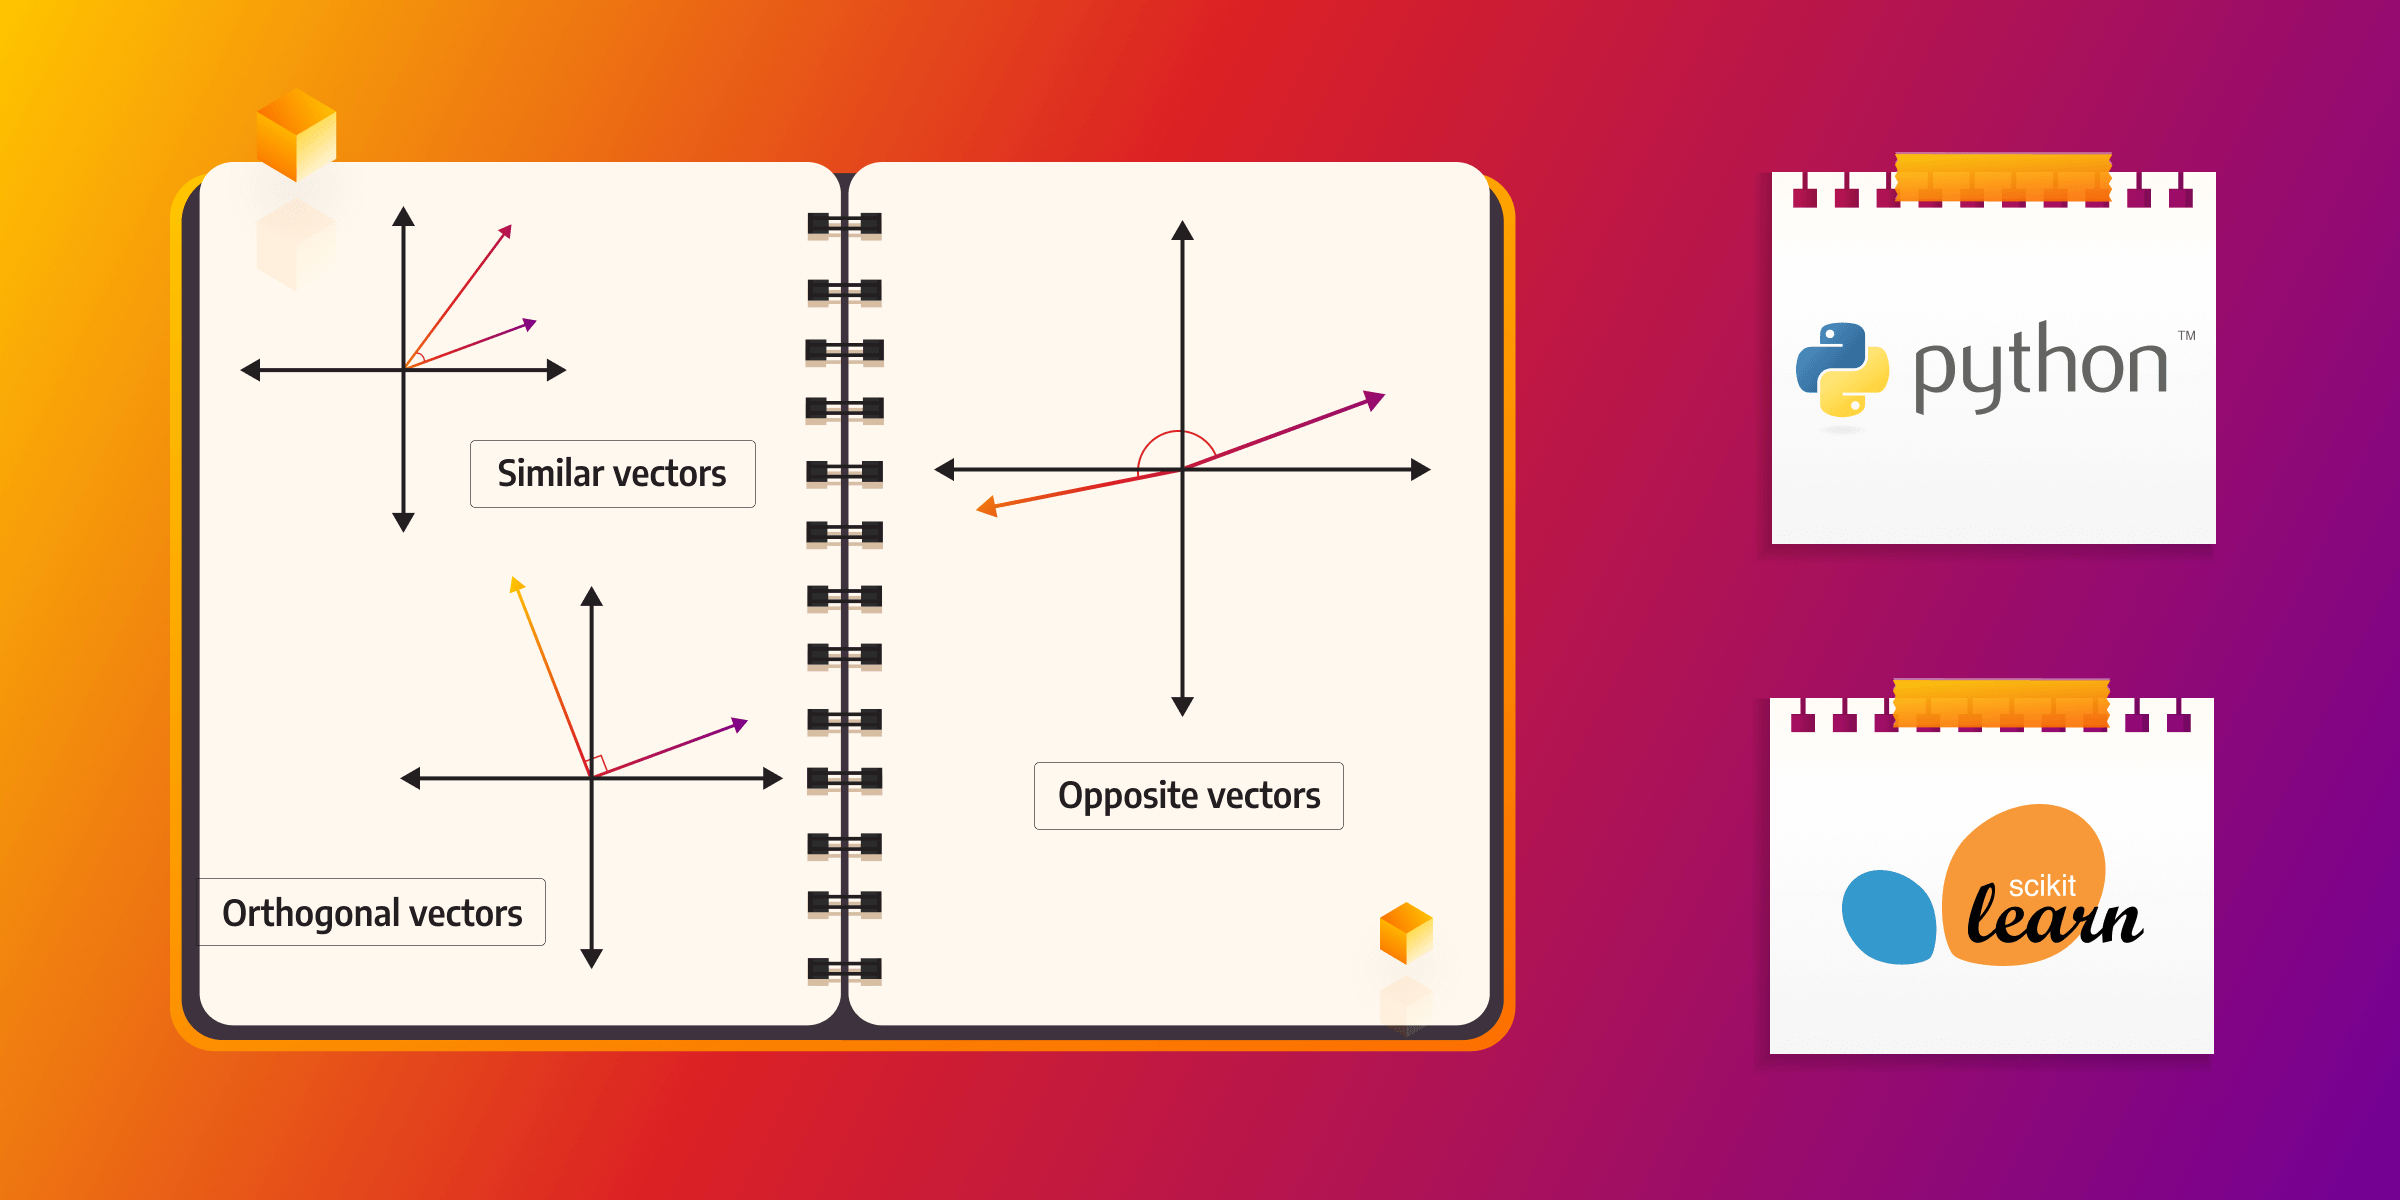
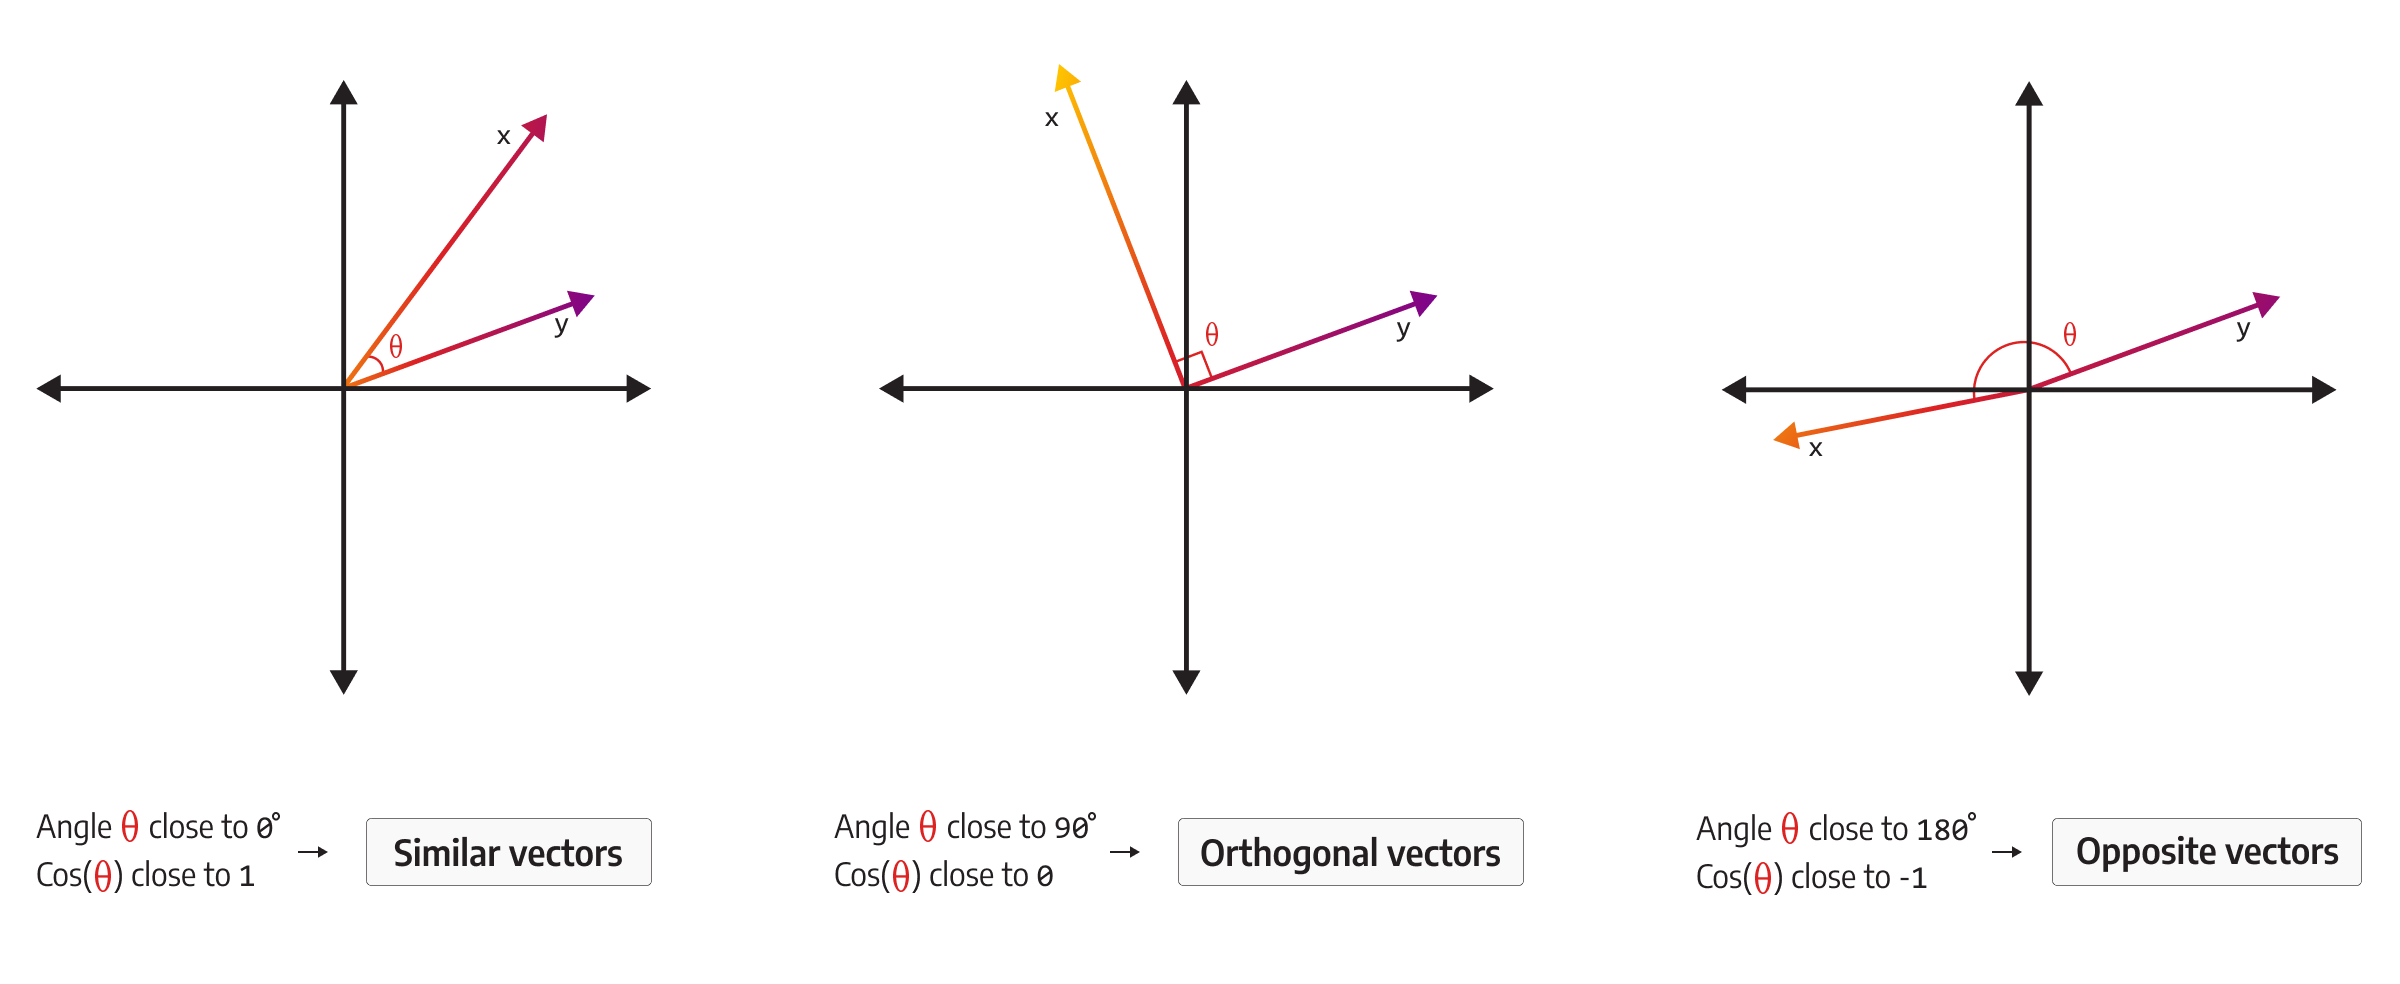
Cosine similarity measures how closely two non-zero vectors point in the same direction. The score falls between -1 and 1. A score of -1 means the vectors point in opposite directions, 0 means they are orthogonal, and 1 means they point in the same direction.
The Cosine Similarity Formula
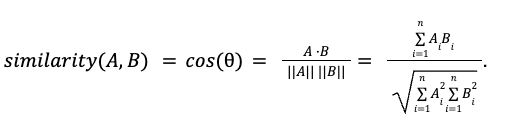
To compute the cosine similarity between vectors A and B, you can use the following formula:
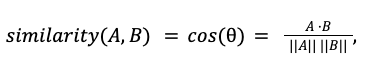
In the formula, θ is the angle between the vectors, AB is the dot product, and A and B are the vector magnitudes. You can also write the dot product as the sum of the products across each vector dimension:
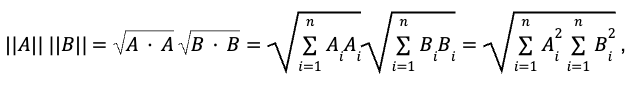
So the cosine similarity formula is equivalent to:
Cosine similarity is common in text analytics because it helps you compare documents after you convert them into vectors. In that representation, each unique word becomes a dimension, and the word frequency or weight becomes the value in that dimension.
Once you have those vectors, you compare the angle between them. A smaller angle gives you a higher cosine score, so the documents are more similar. A larger angle gives you a lower score, so they are less similar. Because cosine similarity focuses on direction instead of magnitude, two documents can still look similar even when they have very different lengths.
Python Libraries for Cosine Similarity
You can always calculate cosine similarity from the formula directly. Still, Python libraries make the job faster once your data grows. Common options include:
- NumPy: the core Python package for scientific computing. It gives you the dot-product and vector-magnitude operations needed for the formula.
- SciPy: a scientific computing library that includes cosine distance, which equals 1 minus cosine similarity.
- scikit-learn: a machine learning library that includes a direct cosine-similarity function.
Of those options, scikit-learn gives you the most direct path because it computes cosine similarity between vectors or matrices out of the box. We’ll use sklearn.metrics.pairwise.cosine_similarity in the example below.
How to Calculate Cosine Similarity
Before running the example, make sure you have Python 3 and pip installed. Then install the required libraries:
python -m pip install pandas scikit-learnIf your system uses python3 instead of python, replace the command accordingly.
To demonstrate cosine similarity on a simple text-analysis task, let’s compare short descriptions of popular social networks sourced from Wikipedia. We’ll use CountVectorizer to convert the text into token counts and cosine_similarity to compare the resulting vectors. In this example, common English stop words are removed so the comparison focuses on topic-specific words instead of filler terms.
from sklearn.feature_extraction.text import CountVectorizer
import pandas as pd
from sklearn.metrics.pairwise import cosine_similarity


twitter = """
Twitter is an online social media and social networking service owned and operated by American company X Corp.,
the legal successor of Twitter, Inc. Twitter users outside the United States are legally served by the Ireland-based
Twitter International Unlimited Company, which makes these users subject to Irish and European Union data protection laws.
On Twitter users post texts, photos and videos known as 'tweets'. Registered users can tweet, like, 'retweet' tweets,
and direct message (DM) other registered users, while unregistered users only have the ability to view public tweets.
Users interact with Twitter through browser or mobile frontend software, or programmatically via its APIs.
"""
facebook = """
Facebook is an online social media and social networking service owned by American technology giant Meta Platforms.
Created in 2004 by Mark Zuckerberg with fellow Harvard College students and roommates Eduardo Saverin, Andrew McCollum,
Dustin Moskovitz, and Chris Hughes, its name derives from the face book directories often given to American university students.
Membership was initially limited to only Harvard students, gradually expanding to other North American universities and,
since 2006, anyone over 13 years old. As of December 2022, Facebook claimed 2.96 billion monthly active users, and ranked third
worldwide among the most visited websites. It was the most downloaded mobile app of the 2010s. Facebook can be accessed from devices
with Internet connectivity, such as personal computers, tablets and smartphones. After registering, users can create a profile
revealing information about themselves. They can post text, photos and multimedia which are shared with any other users who have
agreed to be their friend' or, with different privacy settings, publicly. Users can also communicate directly with each other with
Messenger, join common-interest groups, and receive notifications on the activities of their Facebook friends and the pages they follow.
"""
tiktok = """
TikTok, and its Chinese counterpart Douyin (Chinese: 抖音; pinyin: Dǒuyīn), is a short-form video hosting service owned by ByteDance.
It hosts user-submitted videos, which can range in duration from 3 seconds to 10 minutes. Since their launches, TikTok and Douyin have
gained global popularity.[6][7] In October 2020, TikTok surpassed 2 billion mobile downloads worldwide. Morning Consult named TikTok the
third-fastest growing brand of 2020, after Zoom and Peacock. Cloudflare ranked TikTok the most popular website of 2021,
surpassing google.com.
"""
instagram = """
Instagram is a photo and video sharing social networking service owned by American company Meta Platforms. The app allows users to
upload media that can be edited with filters and organized by hashtags and geographical tagging. Posts can be shared publicly or
with preapproved followers. Users can browse other users' content by tag and location, view trending content, like photos, and follow
other users to add their content to a personal feed. Instagram was originally distinguished by allowing content to be framed only in a
square (1:1) aspect ratio of 640 pixels to match the display width of the iPhone at the time. In 2015, this restriction was eased with
an increase to 1080 pixels. It also added messaging features, the ability to include multiple images or videos in a single post, and a
Stories feature—similar to its main competitor Snapchat—which allowed users to post their content to a sequential feed, with each post
accessible to others for 24 hours. As of January 2019, Stories is used by 500 million people daily.
"""


documents = [twitter, facebook, tiktok, instagram]
count_vectorizer = CountVectorizer(stop_words="english")
sparse_matrix = count_vectorizer.fit_transform(documents)


doc_term_matrix = sparse_matrix.todense()
df = pd.DataFrame(
   doc_term_matrix,
   columns=count_vectorizer.get_feature_names_out(),
   index=["twitter", "facebook", "tiktok", "instagram"],
)
print(df)
print(cosine_similarity(df, df))
Before you look at the results, it helps to set a rough expectation. Facebook and Instagram should look fairly close because both descriptions focus on sharing media through Meta-owned social platforms. Twitter may also land closer to Facebook and Instagram than to TikTok because the TikTok description emphasizes short-form video.
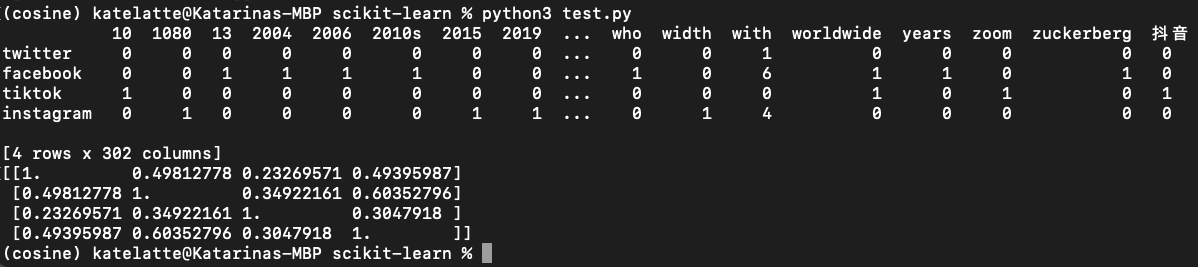
The output first shows the document-term matrix for all four texts. Then it shows the cosine-similarity matrix built from those vectors. Here is the simplest way to read it:
- Each row-column pair shows how similar two descriptions are.
- Every diagonal value is 1 because each document is perfectly similar to itself.
- The Facebook-Instagram score is the highest non-diagonal score, so those two descriptions are the closest match in this dataset.
- Twitter is closer to Facebook and Instagram than it is to TikTok.
Practical Use Cases for Cosine Similarity
You can use cosine similarity in many machine learning and natural language processing workflows, including:
- Text analysis, where you compare documents for search, retrieval, and document grouping.
- Recommendation systems, where you find similar items or similar users from shared patterns.
- Data clustering, where you group nearby data points with a similarity metric.
- Semantic similarity, where you combine cosine similarity with embeddings such as Word2Vec to compare words, passages, or documents.
Cosine Similarity in Graph Databases
Graph databases store relationships as first-class data, so they are a good fit when similarity is only one part of the question you want to answer. Nodes can store vectors, descriptions, or other feature data, and cosine similarity can help you compare those values alongside the graph structure.
With Memgraph, you can compare node vectors and then use the result in traversals, recommendations, or other Cypher queries. That is useful when you want to identify similar users, detect related events, or rank candidates inside a broader graph workflow.
To run cosine similarity in Memgraph, you’ll need Docker and a Memgraph setup that includes MAGE, Memgraph Advanced Graph Extensions. The node_similarity module includes procedures for cosine similarity, Jaccard similarity, and overlap similarity.
For example, let’s run the cosine_pairwise procedure from the node_similarity module on a simple dataset. Start Memgraph Platform in the background with the ports needed for the database and for Memgraph Lab on port 3000:
docker run -d --name cosine-similarity-demo -p 7687:7687 -p 7444:7444 -p 3000:3000 memgraph/memgraph-platform:2.14.1The Memgraph Platform image bundles Memgraph, MAGE, and Memgraph Lab. After the container starts, open Memgraph Lab and wait until it is ready. Then load the dataset in the Query Execution tab:
CREATE (b:Node {id: 0, score: [1.0, 1.0, 1.0]});
CREATE (b:Node {id: 1, score: [1.0, 1.0, 1.0]});
CREATE (b:Node {id: 2, score: [1.0, 1.0, 1.0]});
CREATE (b:Node {id: 3, score: [1.0, 1.0, 0.0]});
CREATE (b:Node {id: 4, score: [0.0, 1.0, 0.0]});
CREATE (b:Node {id: 5, score: [1.0, 0.0, 1.0]});
MERGE (a:Node {id: 0}) MERGE (b:Node {id: 2}) CREATE (a)-[:RELATION]->(b);
MERGE (a:Node {id: 0}) MERGE (b:Node {id: 3}) CREATE (a)-[:RELATION]->(b);
MERGE (a:Node {id: 0}) MERGE (b:Node {id: 4}) CREATE (a)-[:RELATION]->(b);
MERGE (a:Node {id: 0}) MERGE (b:Node {id: 5}) CREATE (a)-[:RELATION]->(b);
MERGE (a:Node {id: 1}) MERGE (b:Node {id: 0}) CREATE (a)-[:RELATION]->(b);
MERGE (a:Node {id: 1}) MERGE (b:Node {id: 1}) CREATE (a)-[:RELATION]->(b);
MERGE (a:Node {id: 1}) MERGE (b:Node {id: 2}) CREATE (a)-[:RELATION]->(b);
MERGE (a:Node {id: 2}) MERGE (b:Node {id: 1}) CREATE (a)-[:RELATION]->(b);
MERGE (a:Node {id: 2}) MERGE (b:Node {id: 4}) CREATE (a)-[:RELATION]->(b);
MERGE (a:Node {id: 2}) MERGE (b:Node {id: 5}) CREATE (a)-[:RELATION]->(b);
MERGE (a:Node {id: 4}) MERGE (b:Node {id: 0}) CREATE (a)-[:RELATION]->(b);
MERGE (a:Node {id: 4}) MERGE (b:Node {id: 1}) CREATE (a)-[:RELATION]->(b);
MERGE (a:Node {id: 5}) MERGE (b:Node {id: 2}) CREATE (a)-[:RELATION]->(b);
MERGE (a:Node {id: 5}) MERGE (b:Node {id: 3}) CREATE (a)-[:RELATION]->(b);
If you’re not sure how to do that, refer to the Memgraph Lab query execution guide.
Every node has a score property, a vector of zeros and ones. Execute the following query to run the cosine_pairwise procedure:
MATCH (m)
WHERE m.id < 3
WITH COLLECT(m) AS nodes1
MATCH (n)
WHERE n.id > 2
WITH COLLECT(n) AS nodes2, nodes1
CALL node_similarity.cosine_pairwise("score", nodes1, nodes2) YIELD node1, node2, similarity AS cosine_similarity
RETURN node1, node2, cosine_similarity;
The above query splits the nodes into two lists and uses them as arguments to the cosine_pairwise procedure. Here is the result:
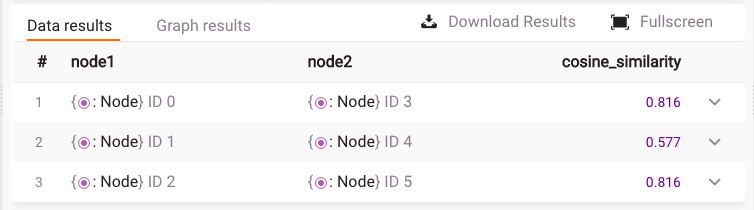
The result calculates cosine similarity from the score property on each node. We can see that node 0 is as similar to node 3 as node 2 is similar to node 5. Node 1 is still similar to node 4, but slightly less so.
Graph databases also give you other ways to build recommendation systems and similarity workflows. If you want a broader example, see our post on building a docs recommendation system with node2vec and link prediction.

You can also see how the same pattern works for paper recommendations in a physics collaboration network.

When you are done, stop and remove the demo container:
docker rm -f cosine-similarity-demoWhen to Use Scikit-Learn vs. Memgraph
Use scikit-learn when you want a fast way to compare documents or feature vectors inside a Python workflow. It is a good fit for local experiments, preprocessing pipelines, and machine learning notebooks.
Use Memgraph when those vectors belong to connected data and you want to combine similarity scores with traversals, recommendations, or other Cypher queries. It is a better fit when similarity is only one part of a broader graph analytics workflow.
If you want to keep exploring graph-native similarity, start with the node_similarity module docs and the Memgraph Lab query guide.