Connect to a Pulsar Cluster and Analyze Streaming NFT Data With Memgraph
Introduction
Art Blocks is an Ethereum based NFT platform where you can choose the style that you like and get a randomly generated version created by an algorithm. After that, you get your NFT (static image, 3D model, or interactive experience) on your Ethereum account. Since each output is different, there are endless possibilities for the types of content that can be created on the platform. In this blog post, you'll learn how to create a graph schema from the Art Blocks dataset, stream your data with Apache Pulsar and Memgraph, and how to analyze your streaming data.
The code for this application can be found in the repository, along with detailed instructions on how to run the app. If you are interested in analyzing real-time movie reviews with Redpanda and Memgraph, you can find the code in the given repository and read about it in another blog post.
Prerequisites
For this demo, you'll need Docker Compose, Memgraph Lab, and data-streams repository:
- Docker Compose:
- On Windows, you need to install Windows Subsystem for Linux (WSL) and then Docker Desktop. On Linux, install Docker Compose by following these instructions.
- Memgraph Lab
- Install the Memgraph Lab v1.3.5 for your operating system.
- data-streams repository
- Clone the data-streams repository. This project contains the data stream, a Pulsar setup, and Memgraph.
Dataset and Graph Schema
All necessary data can be found in the repository. CSV's that will be used are created with the create_csvs.py script, using the projects_and_sales.json file. When we generate the accounts.csv, projects.csv,tokens.csv and sales.csv files, we are ready to populate our graph database.
Below you can see the graph schema for our database. It is pretty straightforward due to the CSV files we generated.
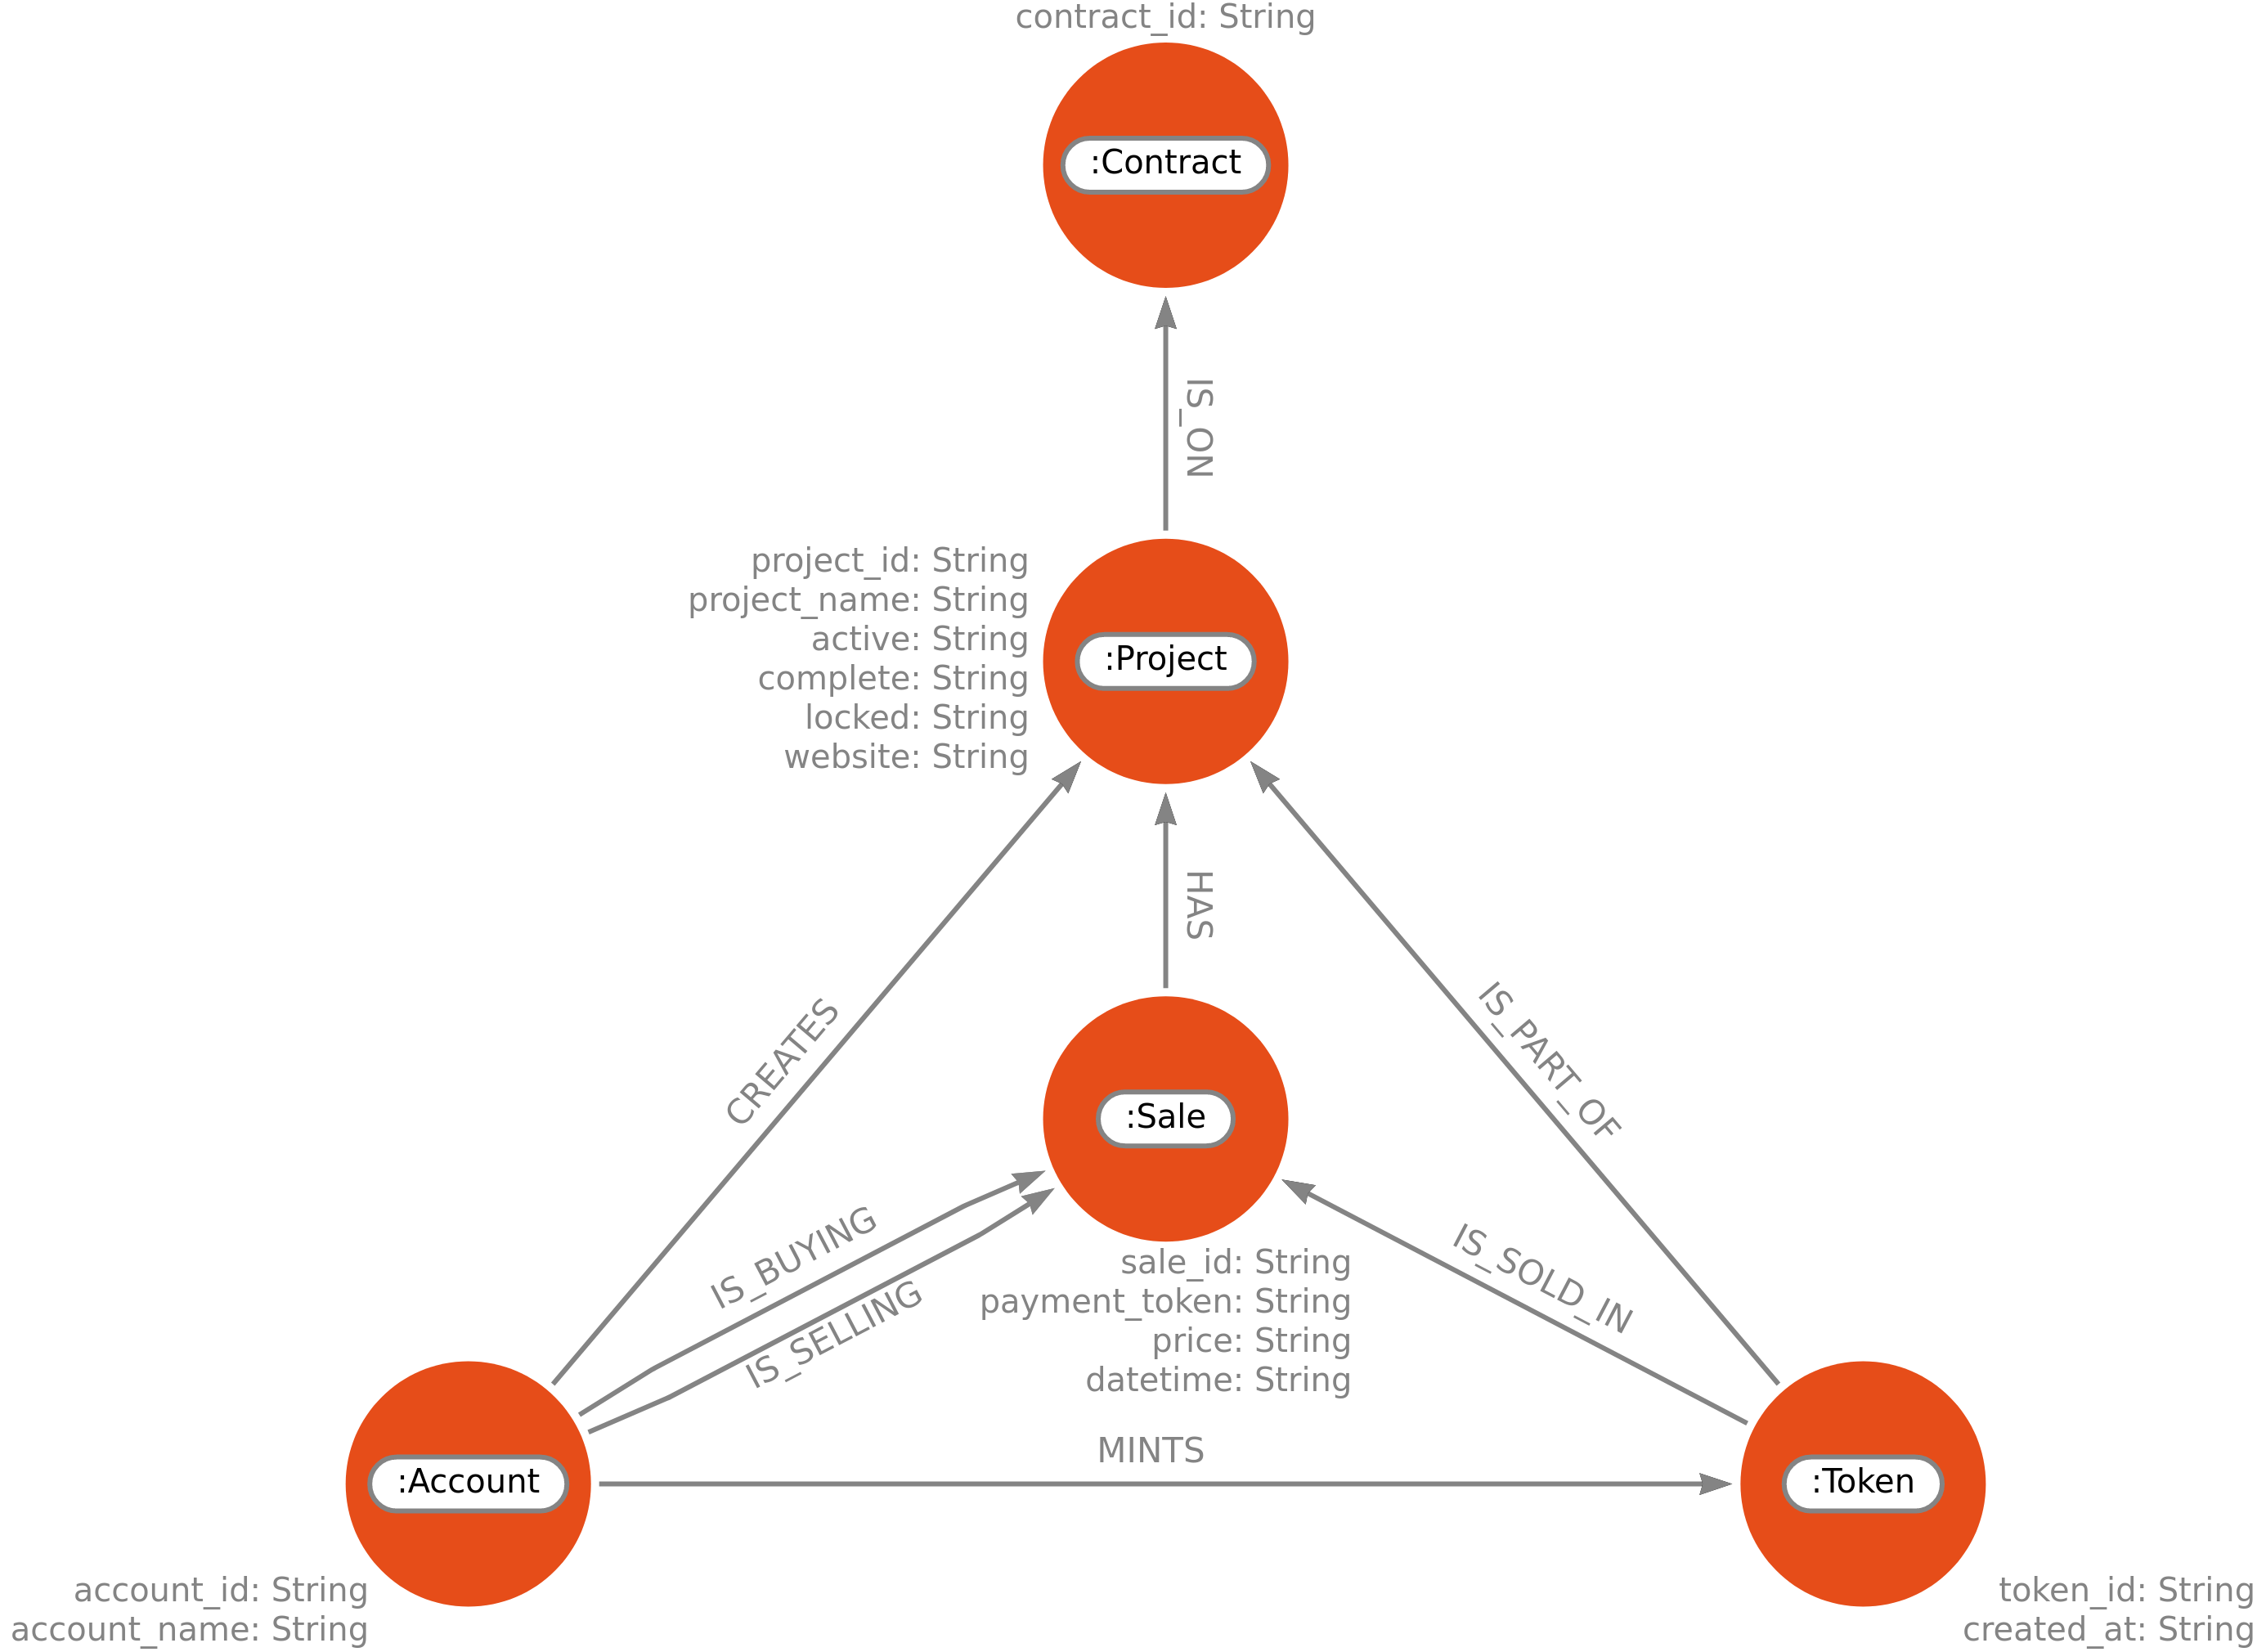
When you run the app, you'll have all the data with :Account, :Project, :Contract, and :Token loaded, along with the relationships between them. Data will be loaded with the LOAD CSV clause, and you can see how that is implemented in the art-blocks-memgraph.py script in the repository. There we have also created and started a stream, which will consume sales. Then we'll be able to create :Sale nodes.
Transformation Module
Memgraph needs to understand somehow the messages that are being consumed. Those messages are JSON files, and we want to create new nodes and relationships from received data. Our transformation module looks like this:
import mgp
import json

@mgp.transformation
def sales(messages: mgp.Messages
          ) -> mgp.Record(query=str, parameters=mgp.Nullable[mgp.Map]):

    result_queries = []

    for i in range(messages.total_messages()):
        message = messages.message_at(i)
        sale_info = json.loads(message.payload().decode('utf8'))
        result_queries.append(
            mgp.Record(
                query=(
                    "CREATE (s:Sale {sale_id: $sale_id, payment_token: $payment_token, price: $price, datetime: $datetime})"
                    "MERGE (p:Project {project_id: $project_id})"
                    "CREATE (p)-[:HAS]->(s)"
                    "MERGE (a:Account {account_id: $seller_id})"
                    "CREATE (a)-[:IS_SELLING]->(s)"
                    "MERGE (b:Account {account_id: $buyer_id})"
                    "CREATE (b)-[:IS_BUYING]->(s)"
                    "MERGE (t:Token {token_id: $token_id})"
                    "CREATE (t)-[:IS_SOLD_IN]->(s)"),
                parameters={
                    "project_id": sale_info["project_id"],
                    "seller_id": sale_info["seller_id"],
                    "buyer_id": sale_info["buyer_id"],
                    "token_id": sale_info["token_id"],
                    "sale_id": sale_info["sale_id"],
                    "payment_token": sale_info["payment_token"],
                    "price": sale_info["price"],
                    "datetime": sale_info["datetime"]
                }))
    return result_queries
It follows the rules of the transformation modules written in Python, and you can read more about them in our docs.
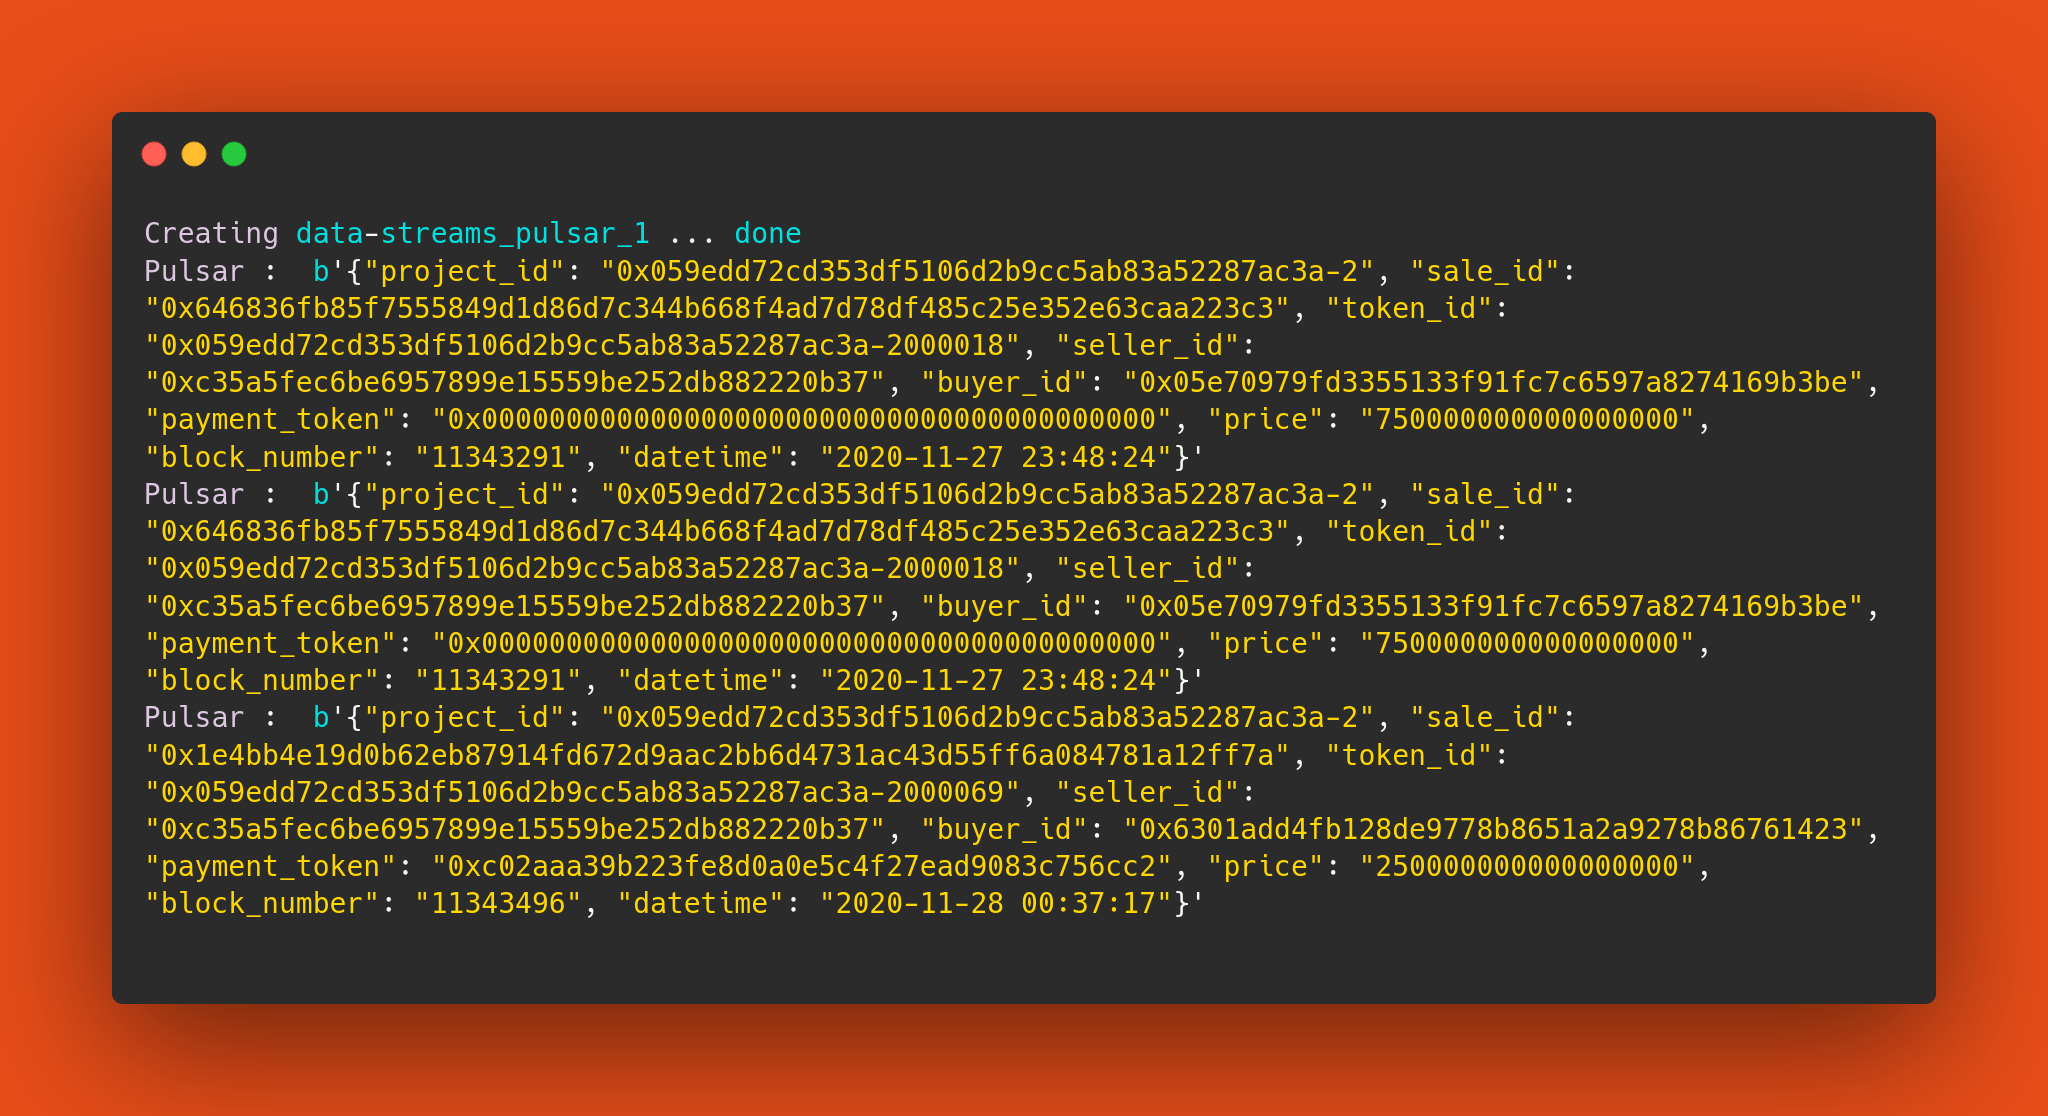
The messages the producer sends look like this:
{
    "project_id": "0xa7d8d9ef8d8ce8992df33d8b8cf4aebabd5bd270-10",
    "sale_id": "0x84b60fca478019f86cc45080850d4b7c19e47d446d344dbb93d7700ed8b909c9",
    "token_id": "0xa7d8d9ef8d8ce8992df33d8b8cf4aebabd5bd270-10000005",
    "seller_id": "0x9260ae742f44b7a2e9472f5c299aa0432b3502fa",
    "buyer_id": "0x720a4fab08cb746fc90e88d1924a98104c0822cf",
    "payment_token": "0x0000000000000000000000000000000000000000",
    "price": "690000000000000000",
    "block_number": "11675452",
    "datetime": "2021-01-17 23:29:47"
}
For each sale (message), we create a node with the label :Sale that will have sale_id, payment_token, price and datetime properties. Each message has information about the project and account that has sold and bought tokens in that sale. From that information, we create nodes labeled with :Project, :Account, :Token. We use the MERGE clause since we don't want to duplicate nodes but connect new sales with existing projects, accounts, or tokens. Now you can notice that our transformation module is quite simple and intuitive because we're writing down all the queries we would make if we want to load one sale into our database.
How to Load a Transformation Module into Memgraph
In this demo, everything will be set up for you, but you may be wondering how to load your transformation module into Memgraph. Let's dive a bit into that.
If you have started Memgraph with Docker, you'll have to copy your transformation module into query_modules folder in the docker container where you ran Memgraph. First, check the container_id with:
docker ps
After you have copied the right container_id, run:
docker cp <PATH_TO_LOCAL_TRANFORMATION_MODULE> <container_id>:/usr/lib/memgraph/query_modules/<transformation.py>
To check if everything is where it's supposed to be, enter the Docker container with:
docker exec -it <container_id> bash
Then run:
cd /usr/lib/memgraph/query_modules
And see whether your transformation module is there.
Start the Producer
Now we will create a Pulsar producer that sends messages we are generating from the sales.csv file. Each message is a row from that CSV file, converted into a dictionary, sent as JSON.
def producer(ip, port, topic, generate, stream_delay):
    client = pulsar.Client('pulsar://' + ip + ':' + port)
    producer = client.create_producer(topic)
    message = generate()
    while True:
        try:
            producer.send(json.dumps(next(message)).encode('utf8'))
            sleep(stream_delay)
        except Exception as e:
            print(f"Error: {e}")
Then we can create a simple consumer, which will print received messages in your terminal.
def consumer(ip, port, topic, platform):
    client = pulsar.Client('pulsar://' + ip + ':' + port)
    consumer = client.subscribe(topic, 'my-subscription')
    while True:
        msg = consumer.receive()
        try:
            print(platform, ": ", msg.data())
            consumer.acknowledge(msg)
        except:
            consumer.negative_acknowledge(msg)
            client.close()
When you start the application with python3 start.py --platforms pulsar --dataset art-blocks, you'll see messages being consumed, which means we have created the producer correctly.
All that is left is to create a stream in Memgraph, create new nodes, and analyze our data.
Streaming with Apache Pulsar and Memgraph
We want Memgraph to be able to consume all the streaming messages and update the database. That is pretty easy with CREATE PULSAR STREAM clause. You can see that everything is set up in the art-blocks-memgraph service. The query for creating a Pulsar stream is:
CREATE PULSAR STREAM sales_stream
TOPICS sales
TRANSFORM artblocks.sales
SERVICE_URL 'pulsar://pulsar:6650;'
This creates the stream sales_stream that consumes messages from topic sales and transforms those messages into queries with artblocks.sales transformation module. SERVICE_URL is the URL to the running Pulsar cluster. Now we're going to start that stream with:
START STREAM sales_stream;
To make sure that your stream is up and running, type in:
SHOW STREAMS;
Now we'll run art-blocks-memgraph service:
docker-compose up art-blocks-memgraph
Open Memgraph Lab and check the Overview tab:
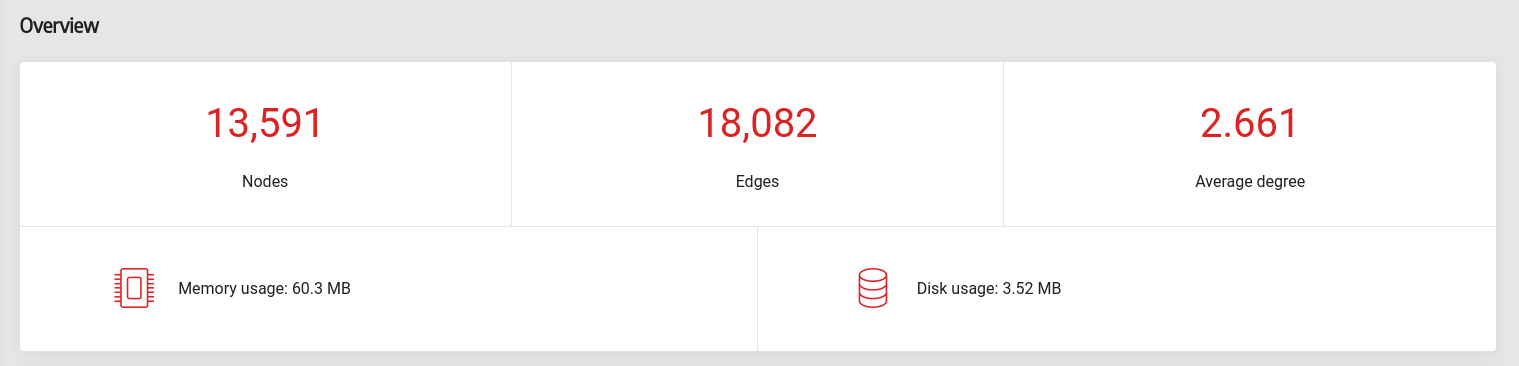
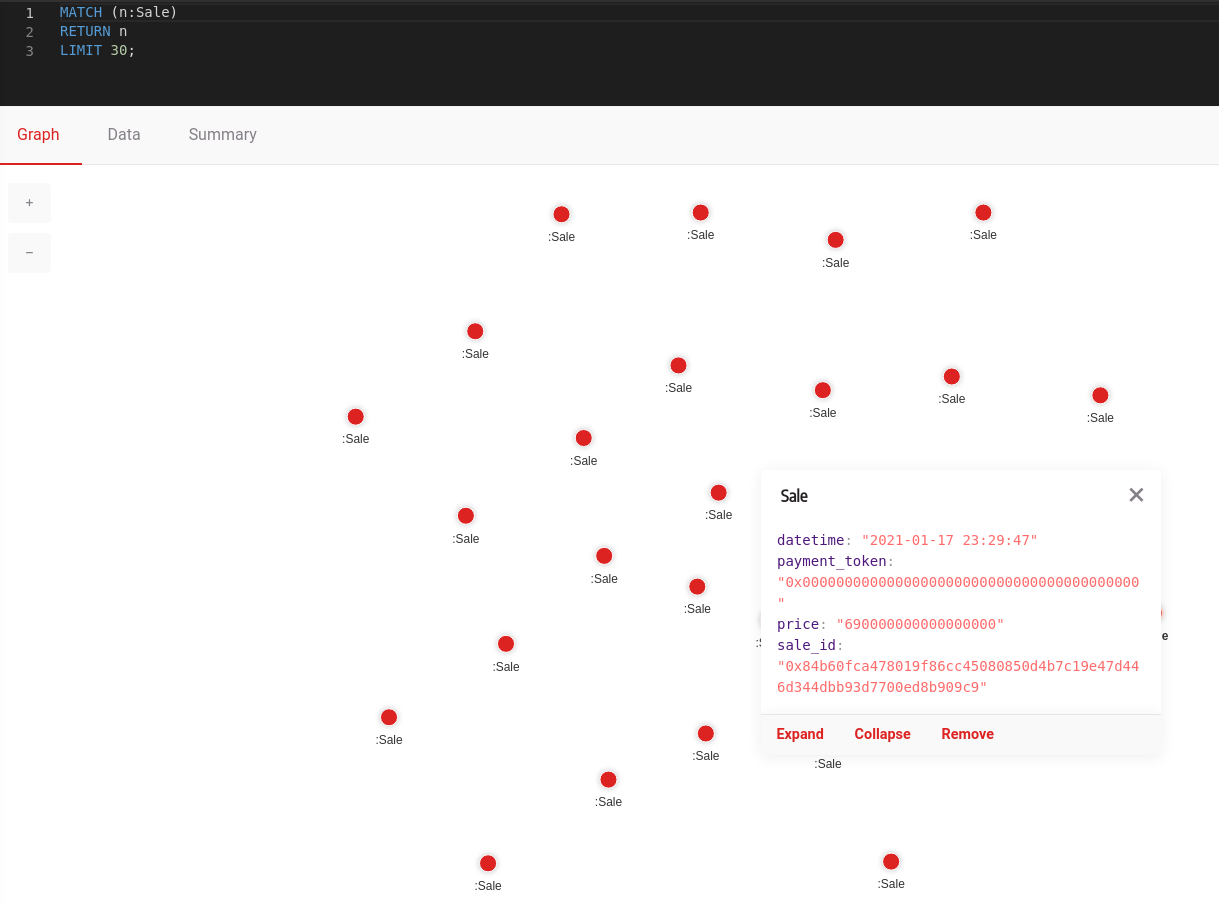
As you can see, we loaded all accounts, projects, tokens, and contracts into Memgraph. Notice that the number of nodes and edges is growing. This is happening because :Sale nodes are being created, and you can verify that by running a simple query and checking the results.
Streaming Data Analysis
There are many interesting insights we can get from our graph database. Let's see which account is the best seller so far. Every sale consumed creates a relationship with the account that has sold and bought tokens in that sale. Therefore, for checking who is the best seller, we can run a query:
MATCH (a:Account)-[r:IS_SELLING]->(s:Sale)
WITH a, count(s) AS num_of_sales
WHERE num_of_sales > 1
RETURN a.account_id, num_of_sales
ORDER BY num_of_sales DESC
LIMIT 10;
Fire up Memgraph Lab and see the results:
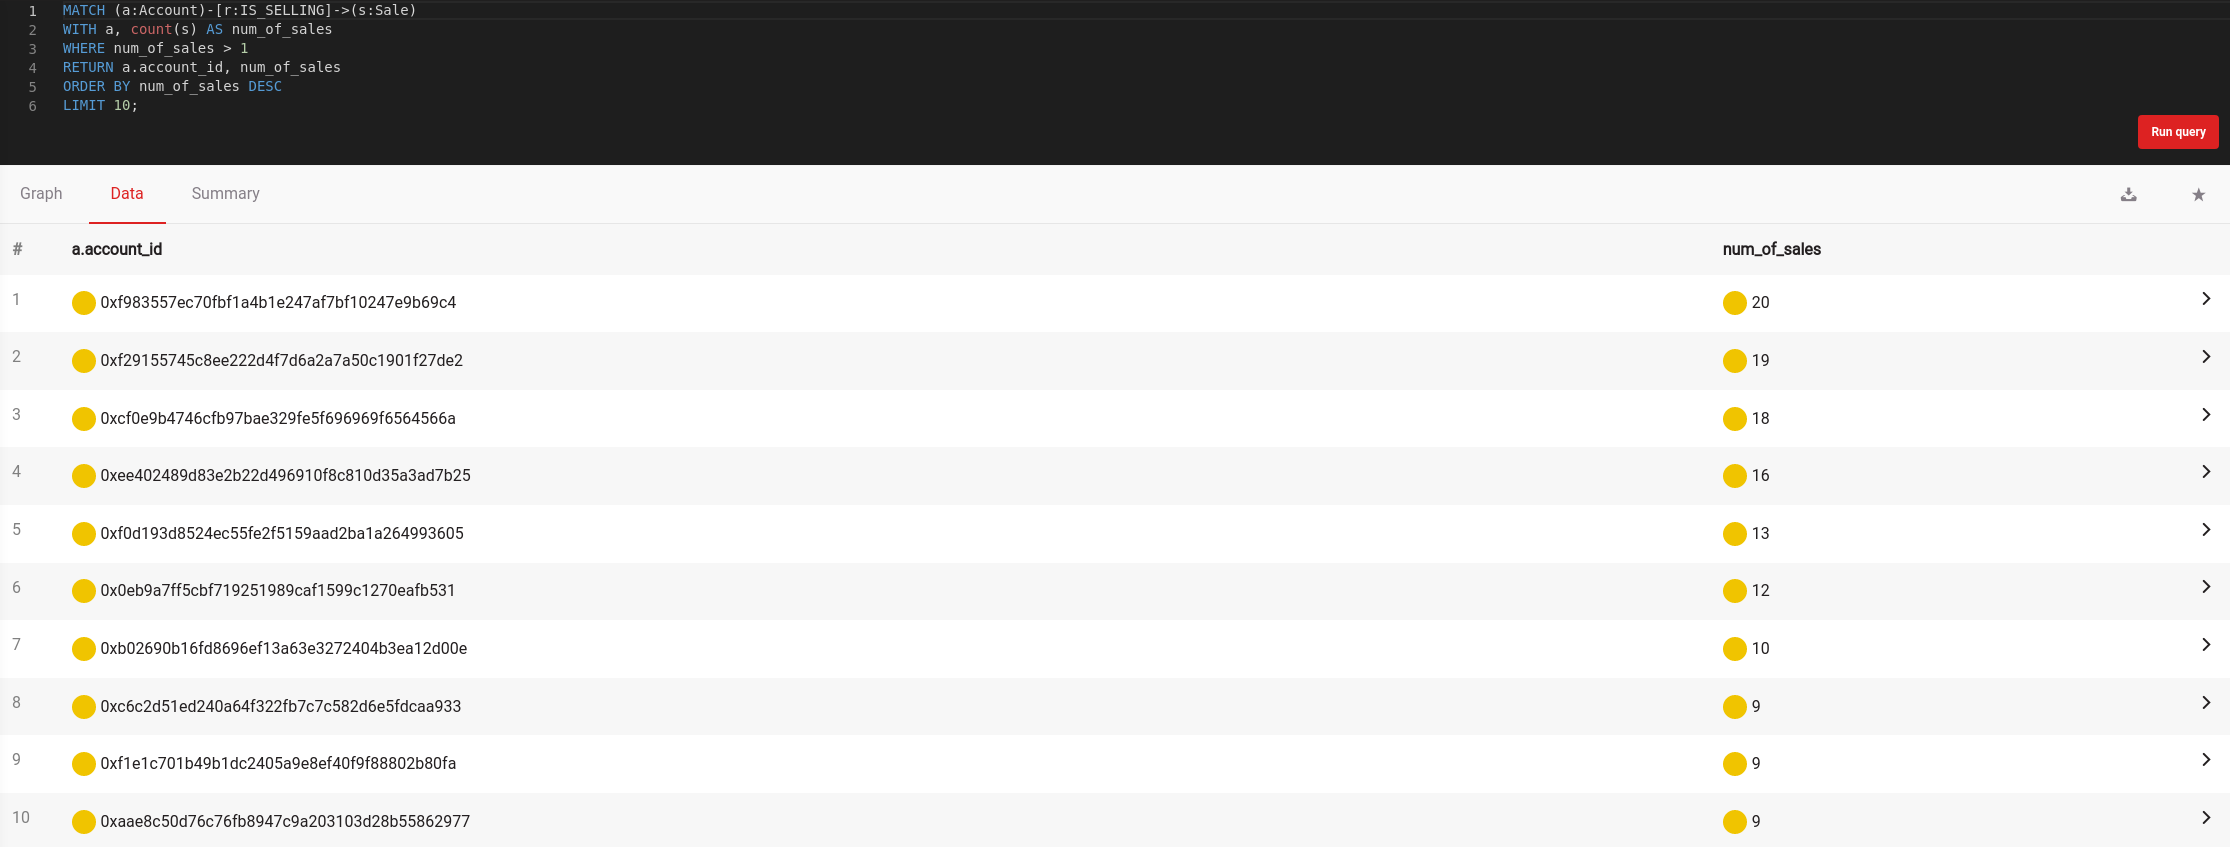
Since we have new incoming sales, we can suppose that these results will change over time. Try pushing that "Run query" button again, and see if anything changes! In the same way, you can see on which project the most sales were made.
Now you can be wondering who is the most frequent buyer - just swap :IS_SELLING relationship with IS_BUYING and you'll get your results.
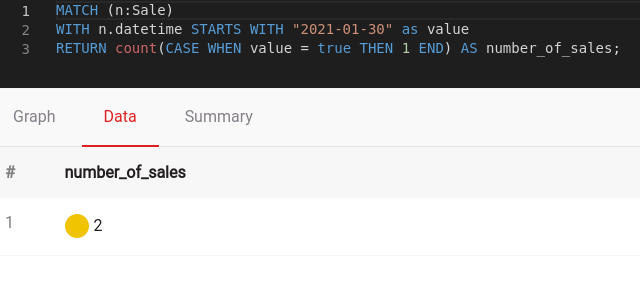
Another interesting query may be to check out whether a sale has been made on a particular day. You can get that with a query:
MATCH (n:Sale)
WITH n.datetime STARTS WITH "2021-01-30" as value
RETURN count(CASE WHEN value = true THEN 1 END) AS number_of_sales;
Run that in Memgraph Lab, and you get:
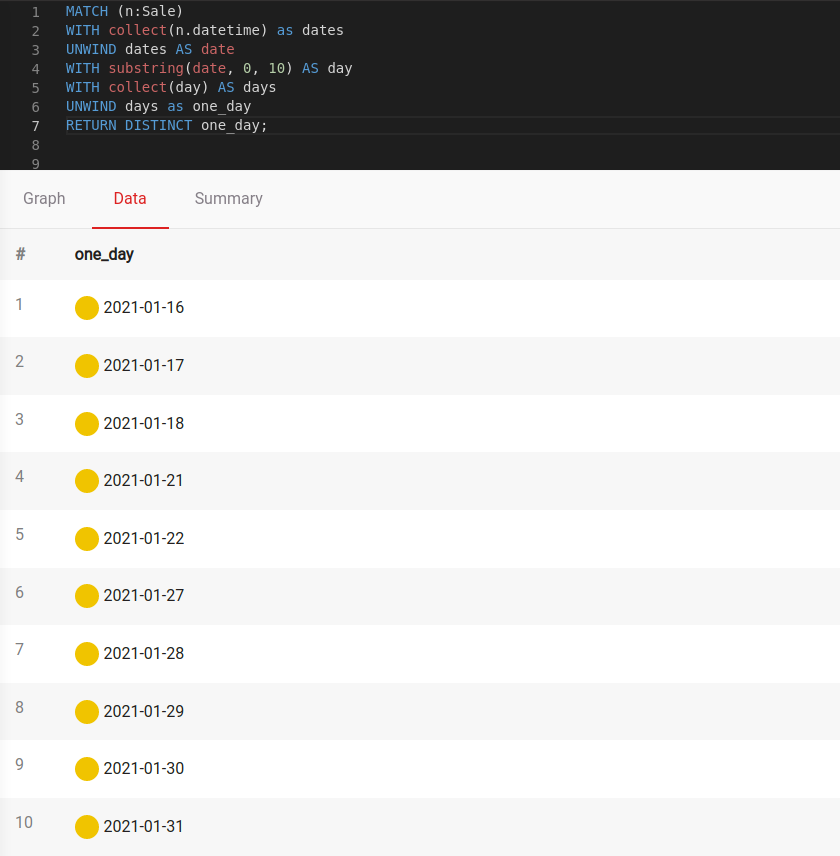
If you are wondering on which days sales have been made, check that with:
MATCH (n:Sale)
WITH collect(n.datetime) as dates
UNWIND dates AS date
WITH substring(date, 0, 10) AS day
WITH collect(day) AS days
UNWIND days as one_day
RETURN DISTINCT one_day;
Let's see the results:
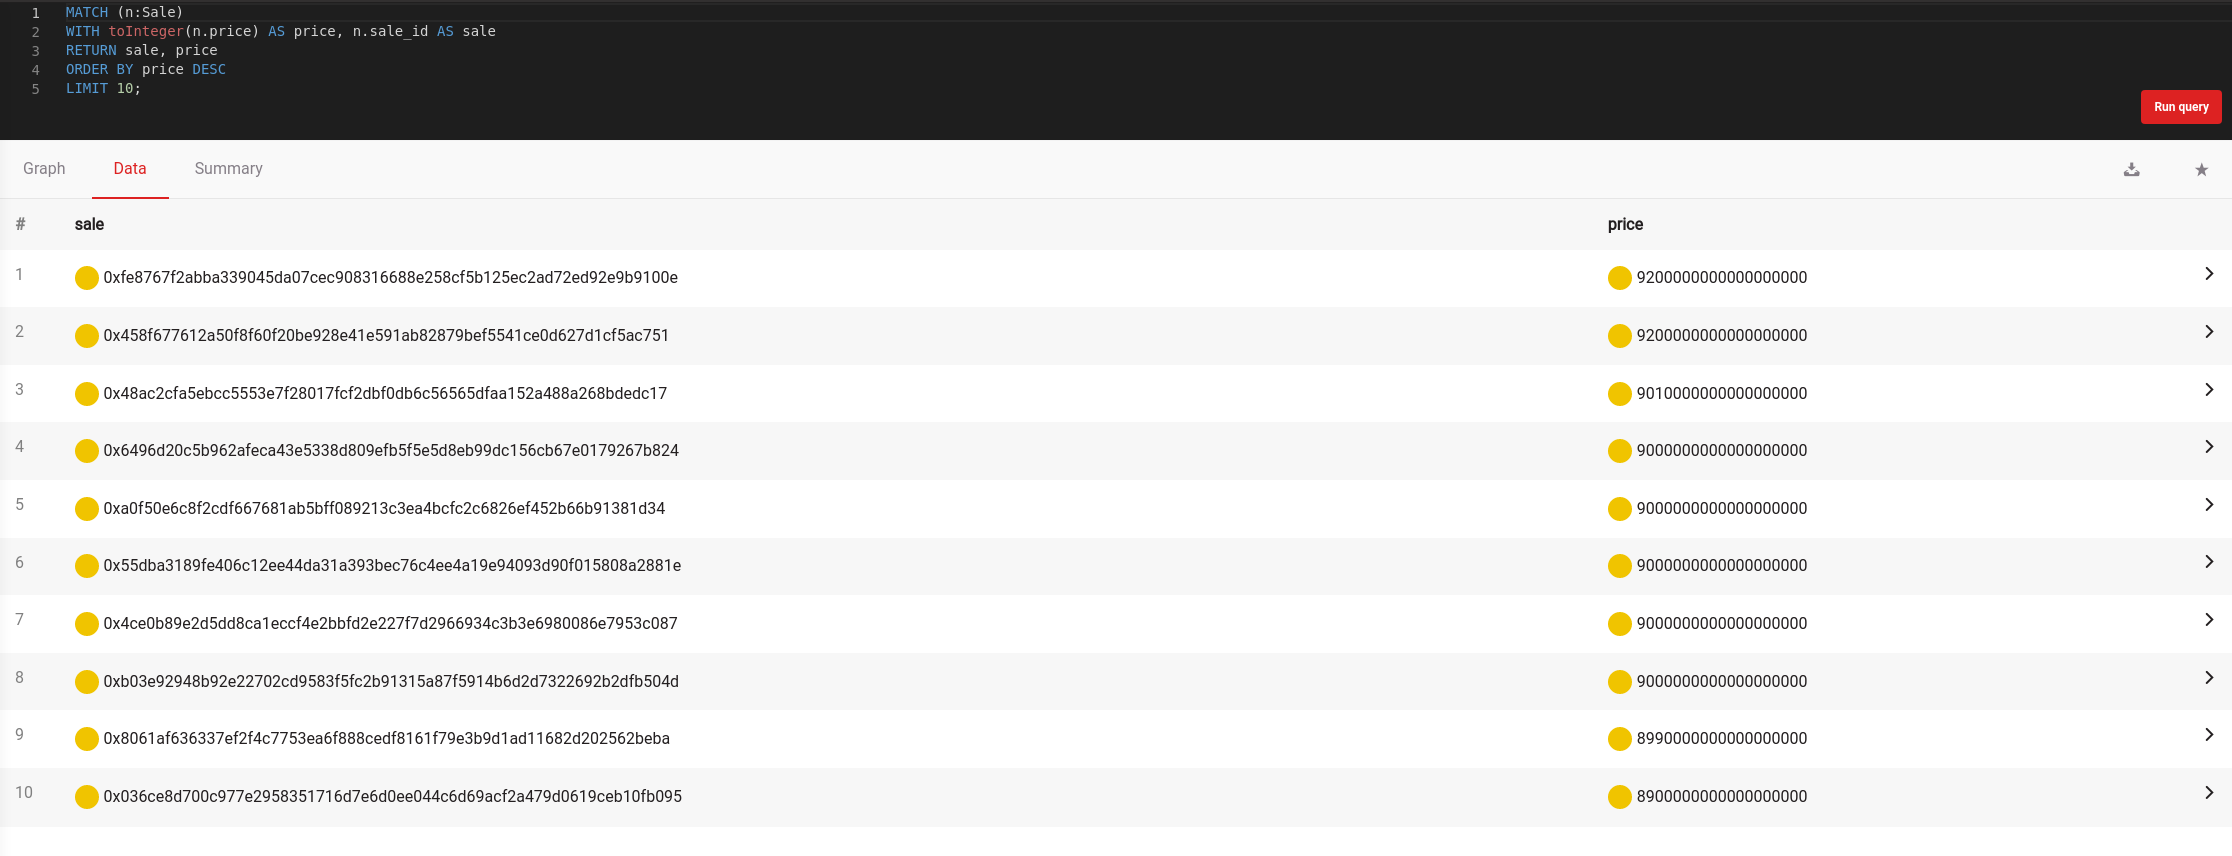
In the end, we'll find the top ten sales, based on the amount of money spent on them. The query we need to run is:
MATCH (n:Sale)
WITH toInteger(n.price) AS price, n.sale_id AS sale
RETURN sale, price
ORDER BY price DESC
LIMIT 10;
And the best sales are:
Conclusion
Streaming data analytics is becoming more popular each day, and we're still discovering their fun and valuable use cases. Now that Memgraph can stream data with Pulsar, Redpanda, and Kafka, the possibilities are endless! If you want to talk about this application or anything else, join our Discord server and have a chat with us.
Not sure what to do for the Challenge? You can build a simple graph web application with Python, Flask, Docker & Memgraph. How? Read all about it in one of our blog posts.