Analyzing the Eurovision Song Contest With Graphs
Introduction
After the 2020 Eurovision Song Contest was canceled, we are excited about this year's finals more than ever, but geeks among us can't just wait around doing nothing! Every year Eurovision brings us a fantastic mash-up of extravagant outfits, catchy songs, and bold dance moves. Underneath the surface of glitter and rainbows, there is a complicated story of geopolitics, rivalry, and tactics hidden in the collection of interconnected data.
We will try to untangle strategic voting, neighbor preferences, and political rivalries with the help of graph analytics.
Data model
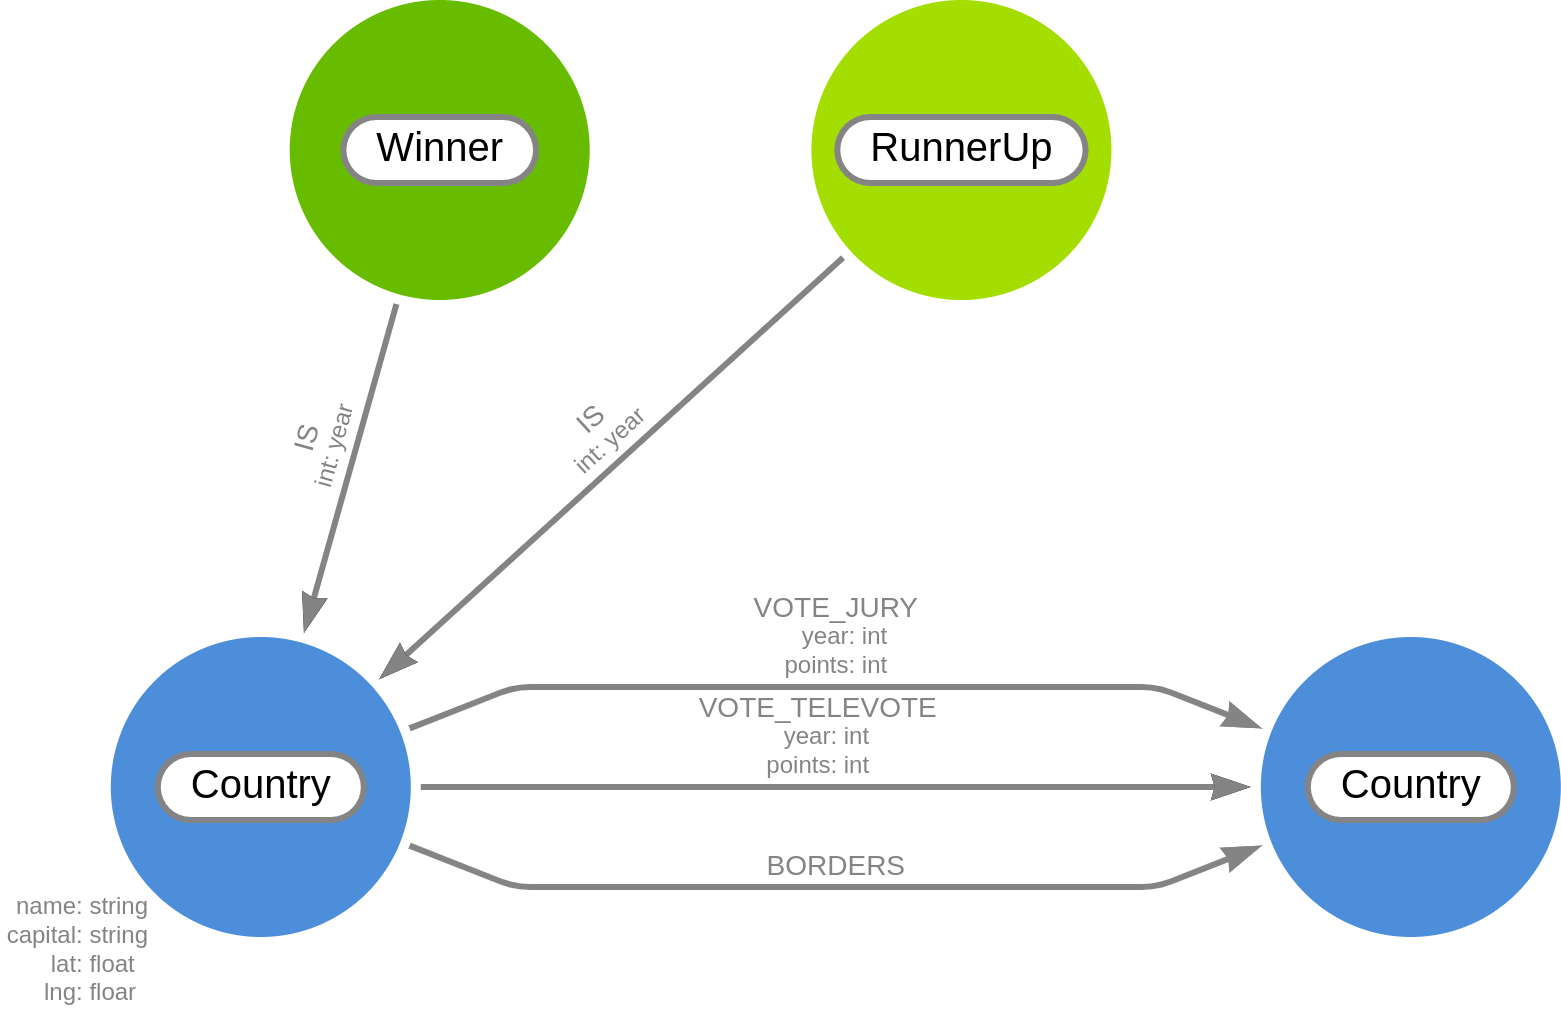
Our dataset is quite simple. There are 51 Country nodes with the following properties: name, capital, lat, lng and flag. The properties lat and lng represent the coordinates of a country's capital city and will be important for visualizing the data on a map. The same is true for the flag property.
Each year's winner and runner-up are connected to Winner and RunnerUp nodes, respectively, with an edge IS that contains the properties year and points.
The Country nodes are connected with the BORDERS edge if they are neighboring countries.VOTE_JURY and VOTE_TELEVOTE edges have properties year and points. VOTE_JURY edges represent a number of points given by each country's professional jury, and VOTE_TELEVOTE edges represent the general public's vote that has been introduced in 1997. The voting system has been changed a few times so far but since 2009 the winner is determined by votes of the jury and public in an equal split.
Visualizing the Graph With Memgraph Lab
You can find the Eurovision song contest dataset in Memgraph Lab and on Memgraph Playground online. Memgraph Lab is an integrated development environment used to import data, develop, debug and profile database queries and visualize query results. Just go to the Datasets tab and load the Eurovision voting results dataset.
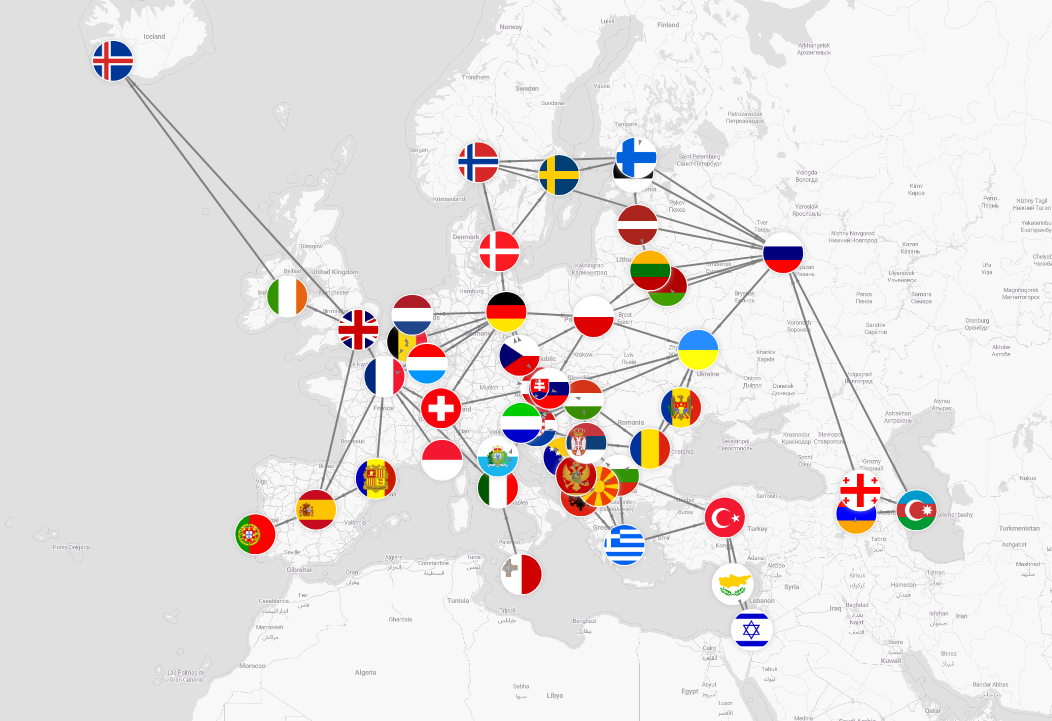
Visualizing data in Memgraph is pretty simple. Memgraph Lab automatically detects nodes that have numerical lat and lng properties and displays them on a map.
You can style the map to your liking by using the Style editor in Memgraph Lab. To find out more about the style editor, take a look at this tutorial.
Each country node also has a flag property which is used to display an image. You can use the following styling script to display the flags on a map:
@NodeStyle {
  size: 100
  border-width: 2
  border-color: #ffffff
  shadow-color: #bab8bb
  shadow-size: 6
}

@NodeStyle Greater(Size(Labels(node)), 0) {
  label: Format(":{}", Join(Labels(node), " :"))
}

@NodeStyle HasLabel(node, "Country") {
  color: #dd2222
  color-hover: Darker(#dd2222)
  color-selected: #dd2222
}

@NodeStyle HasProperty(node, "name") {
  label: AsText(Property(node, "name"))
}

@EdgeStyle {
  width: 10
  label: Type(edge)
  color: gray
}

@NodeStyle {
  image-url: Property(node, "flag")
}
To get your graph, run the following Cypher query:
MATCH (c:Country)
RETURN c;
If everything works properly, you should get a visualization similar to the one below.
Data analysis
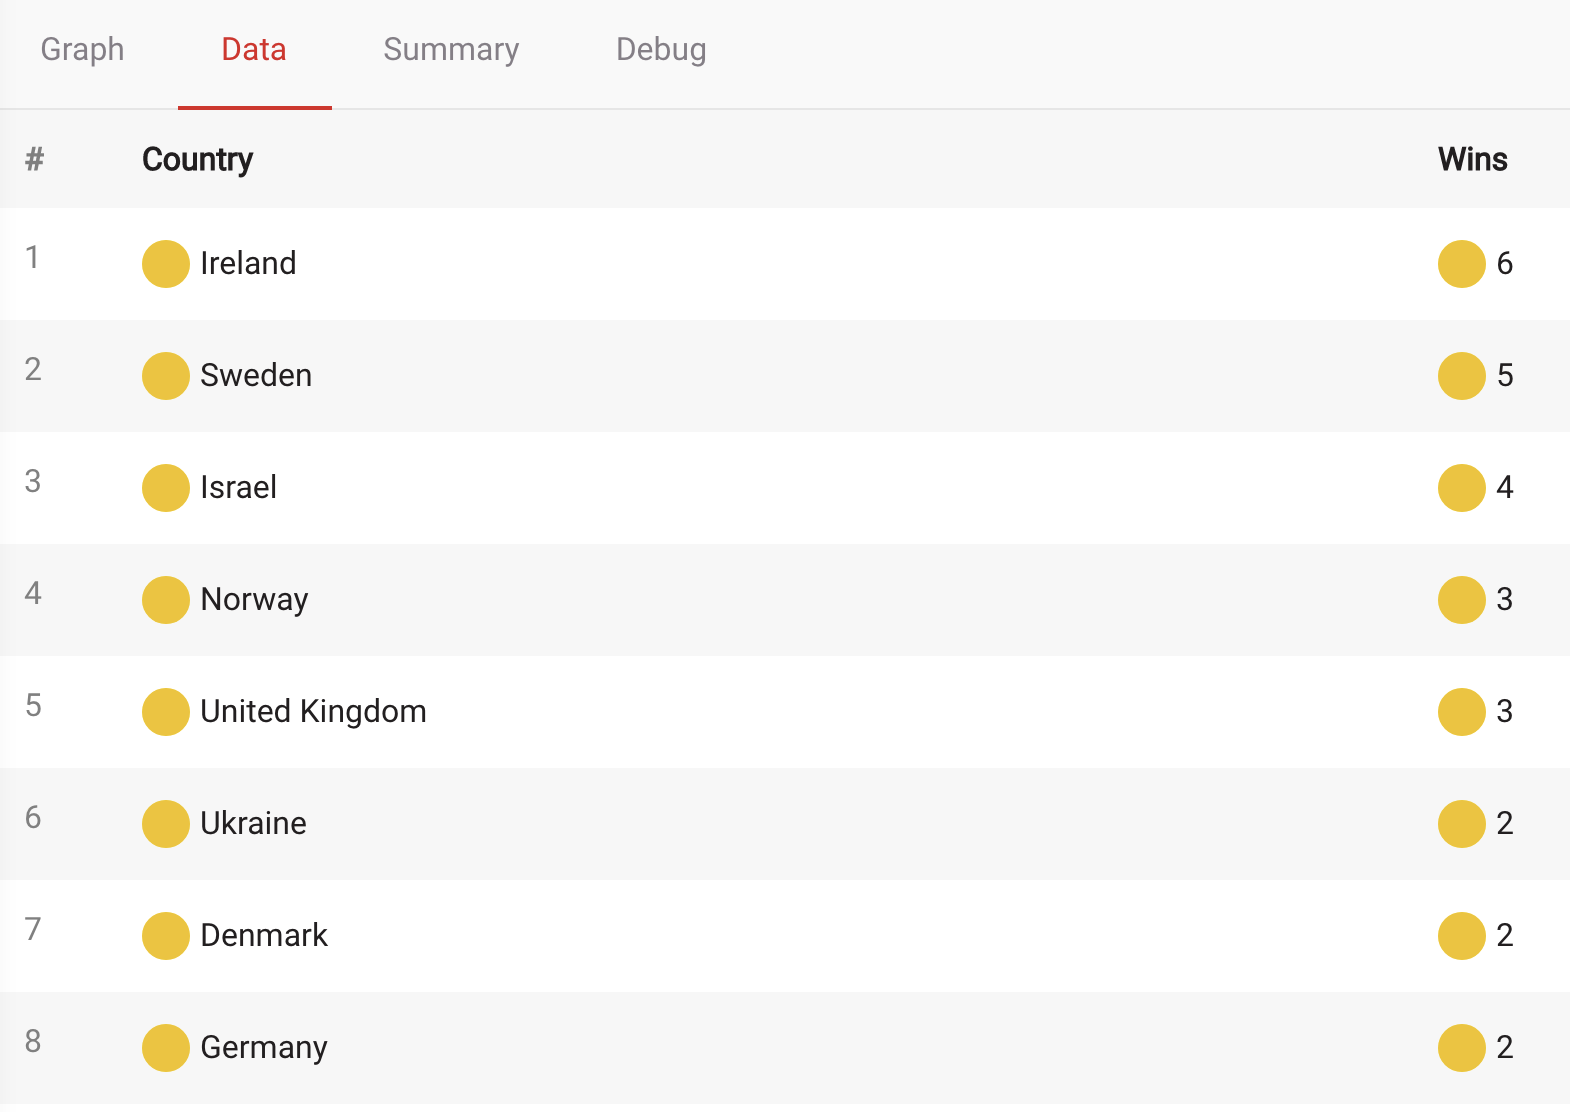
Some countries have been more successful than others in producing good music (or keeping strong relationships with their neighbors). Let's check which country was the most victorious since 1975:
MATCH (c:Country)-[i:IS]-(w:Winner)
RETURN c.name AS Country, count(i) AS Wins
ORDER BY Wins DESC;
Interestingly, Ireland and Sweden stay on top despite our dataset being incomplete.
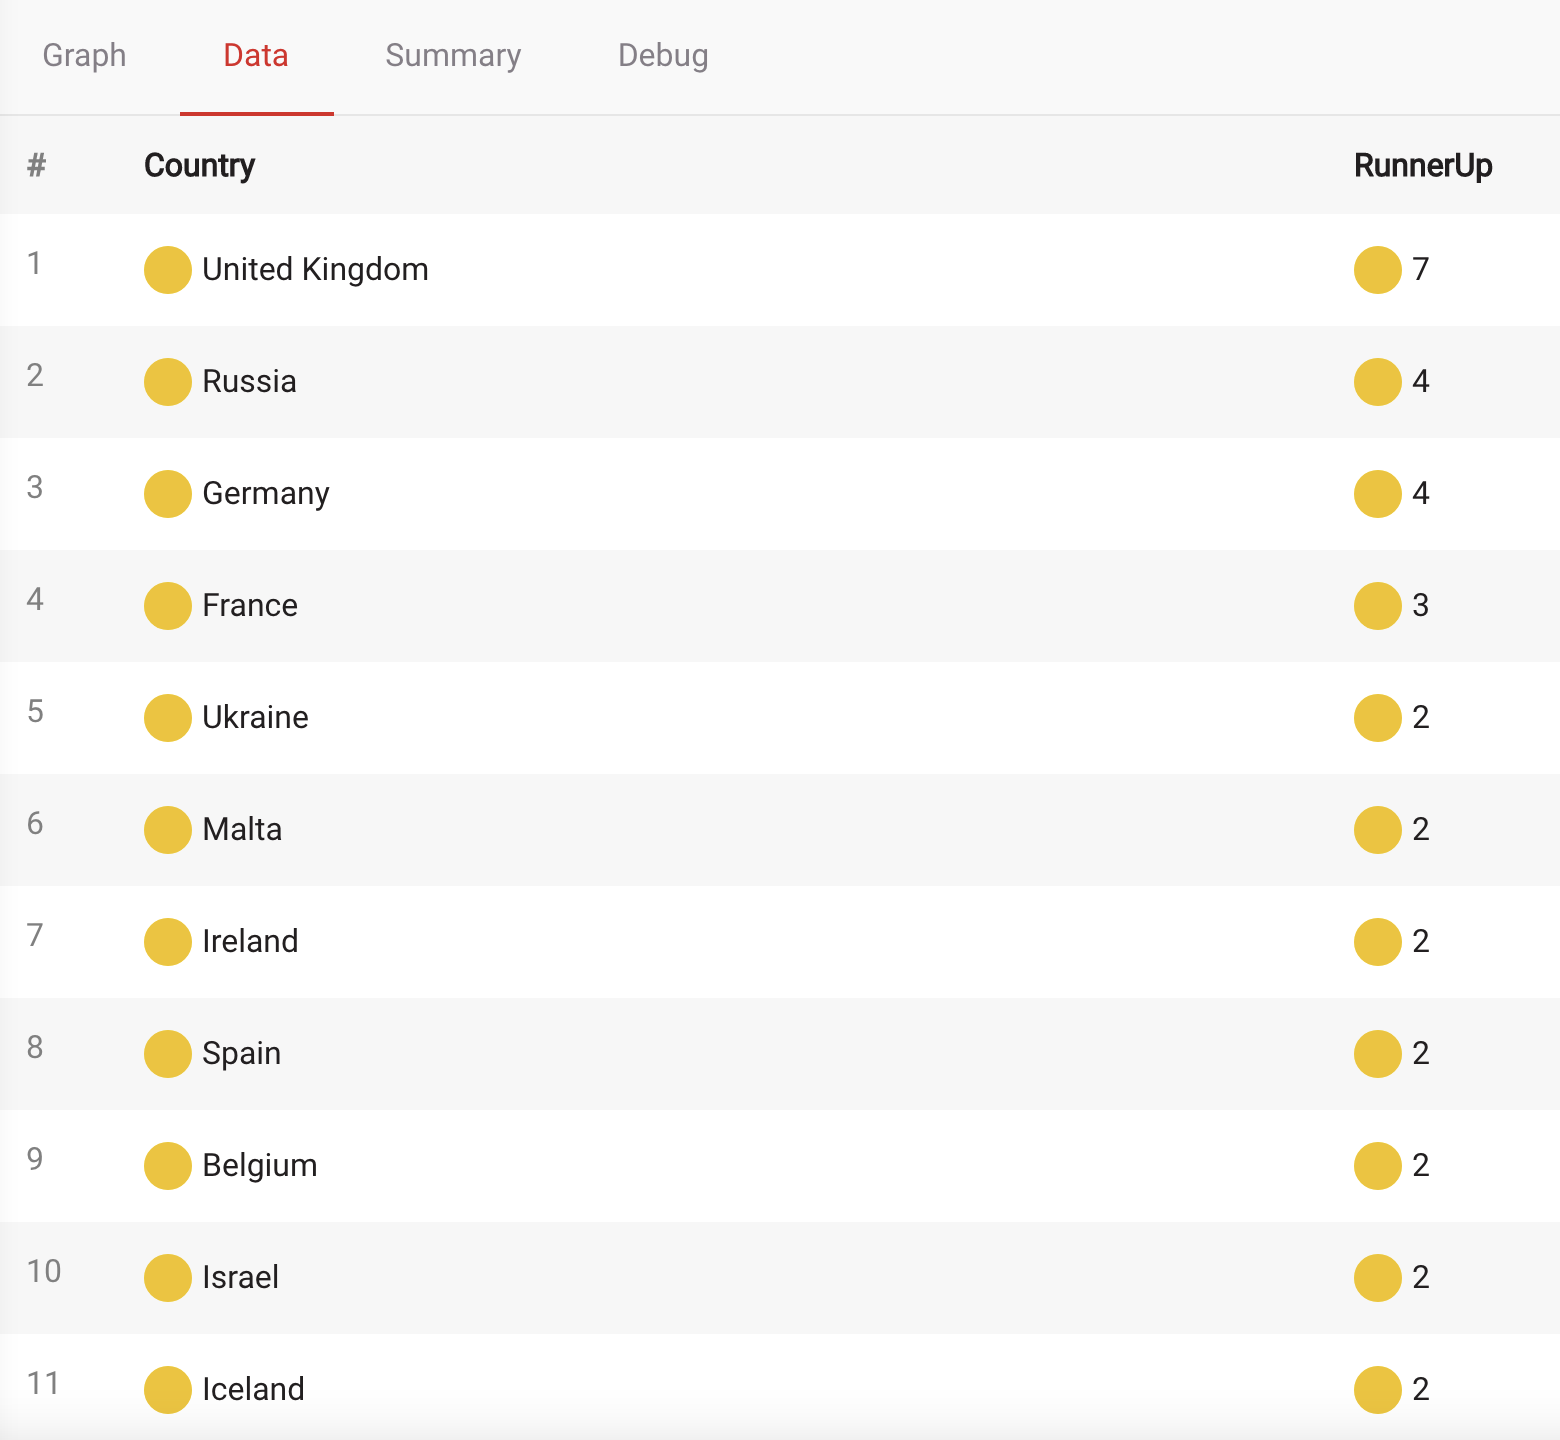
Coming in second on Eurovision is like nearly winning a medal at the Olympics. Let's check the biggest runner-ups of Eurovision:
MATCH (c:Country)-[i:IS]-(r:RunnerUp)
RETURN c.name AS Country, count(i) AS RunnerUp
ORDER BY RunnerUp DESC;
It seems that the UK is the most notable runner-up in history.
But it's not all about winning! There is a special satisfaction in supporting your favorite song and casting a vote.
Some countries were better than others in predicting a winner, or is it just that some have better taste? Let's check which countries gave the most points to the winners throughout history:
MATCH (c:Country)-[vote:VOTE_JURY]->(: Country)-[i:IS]->(w:Winner)
WHERE vote.points = 12 AND vote.year = i.year
WITH c, COUNT(vote.points) AS points
RETURN c.name AS Country, points
ORDER BY points DESC
LIMIT 10;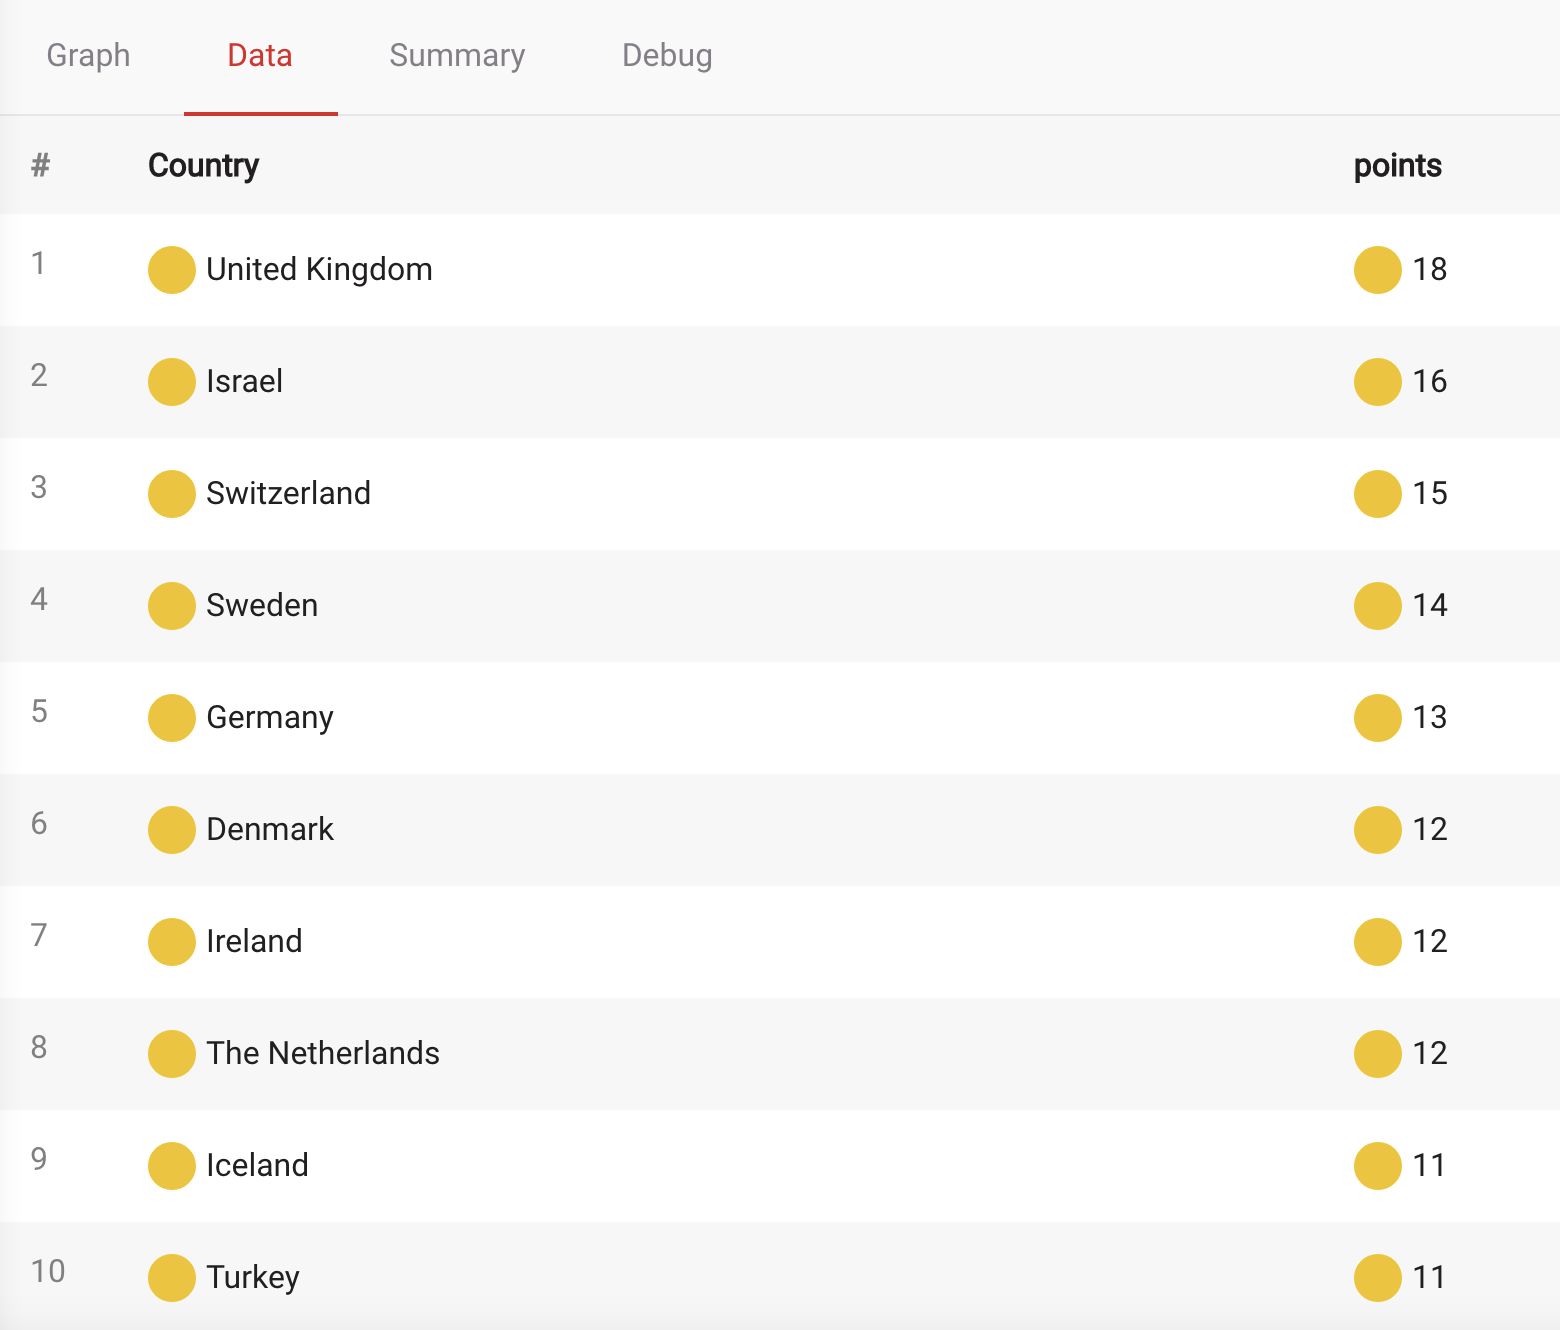
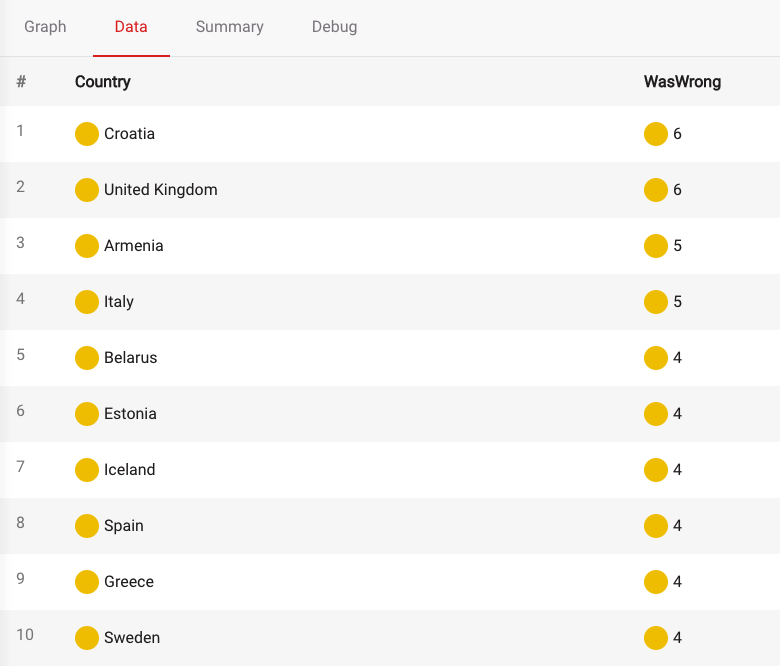
But it turns out that it isn't a matter of good or bad taste. When we take a look at the list of countries that didn't give any points to winners over the years:
MATCH (c:Country)-[v:VOTE_JURY]->(:Country)-[i:IS]->(w:Winner)
WHERE v.points = 0 AND v.year=i.year
RETURN c.name AS Country, count(v) AS WasWrong
ORDER BY WasWrong DESC
LIMIT 10;
The UK is again at the top of our list.
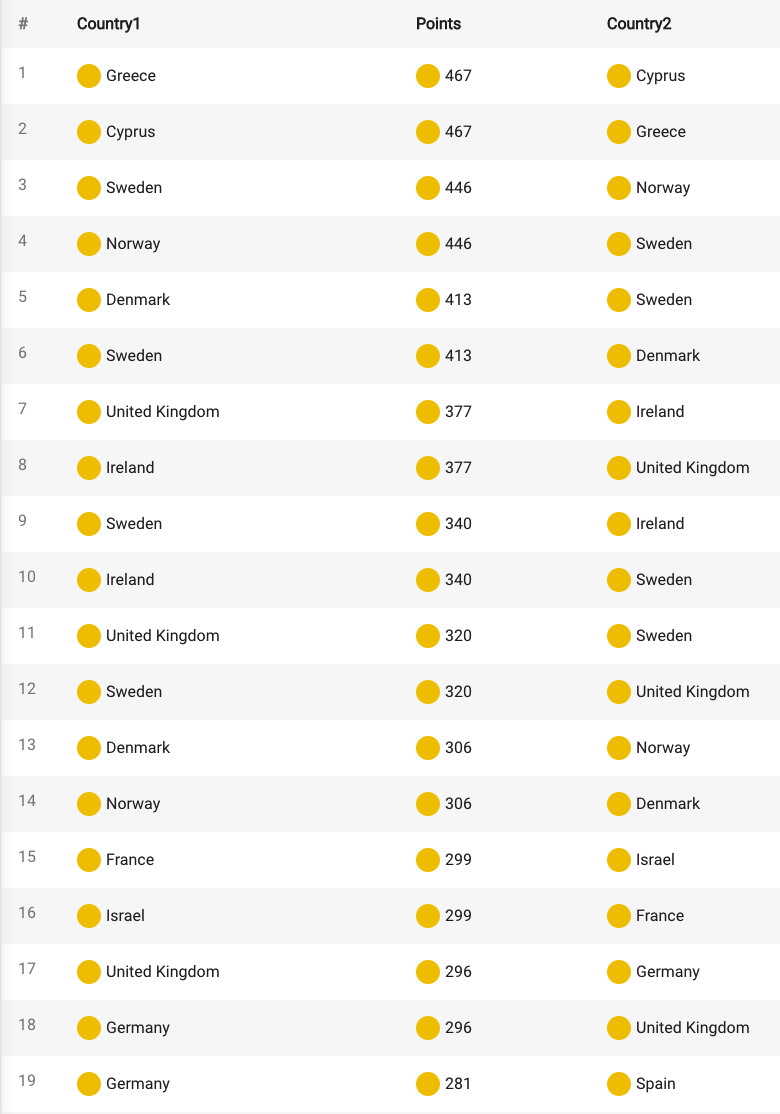
So what's Eurovision voting really about? Is having a catchy song really what it takes to win, or is there more to it? Maybe similar languages or familiar cultures play a role. Let's check who fancies who by looking into which countries exchange the most points between each other:
MATCH (c1:Country)-[v1:VOTE_JURY]->(c2:Country), (c1: Country)<-[v2:VOTE_JURY]-(c2:Country)
WHERE v1.year = v2.year
WITH c1.name AS Country1, c2.name AS Country2, SUM(v1.points) + sum(v2.points) AS Points
RETURN Country1, Points, Country2
ORDER BY Points DESC;
Relationships are symmetrical, so for every pair, there are two results. The number of points calculated is identical in both results, but countries switch places. It's not surprising that most love is exchanged between neighbors!
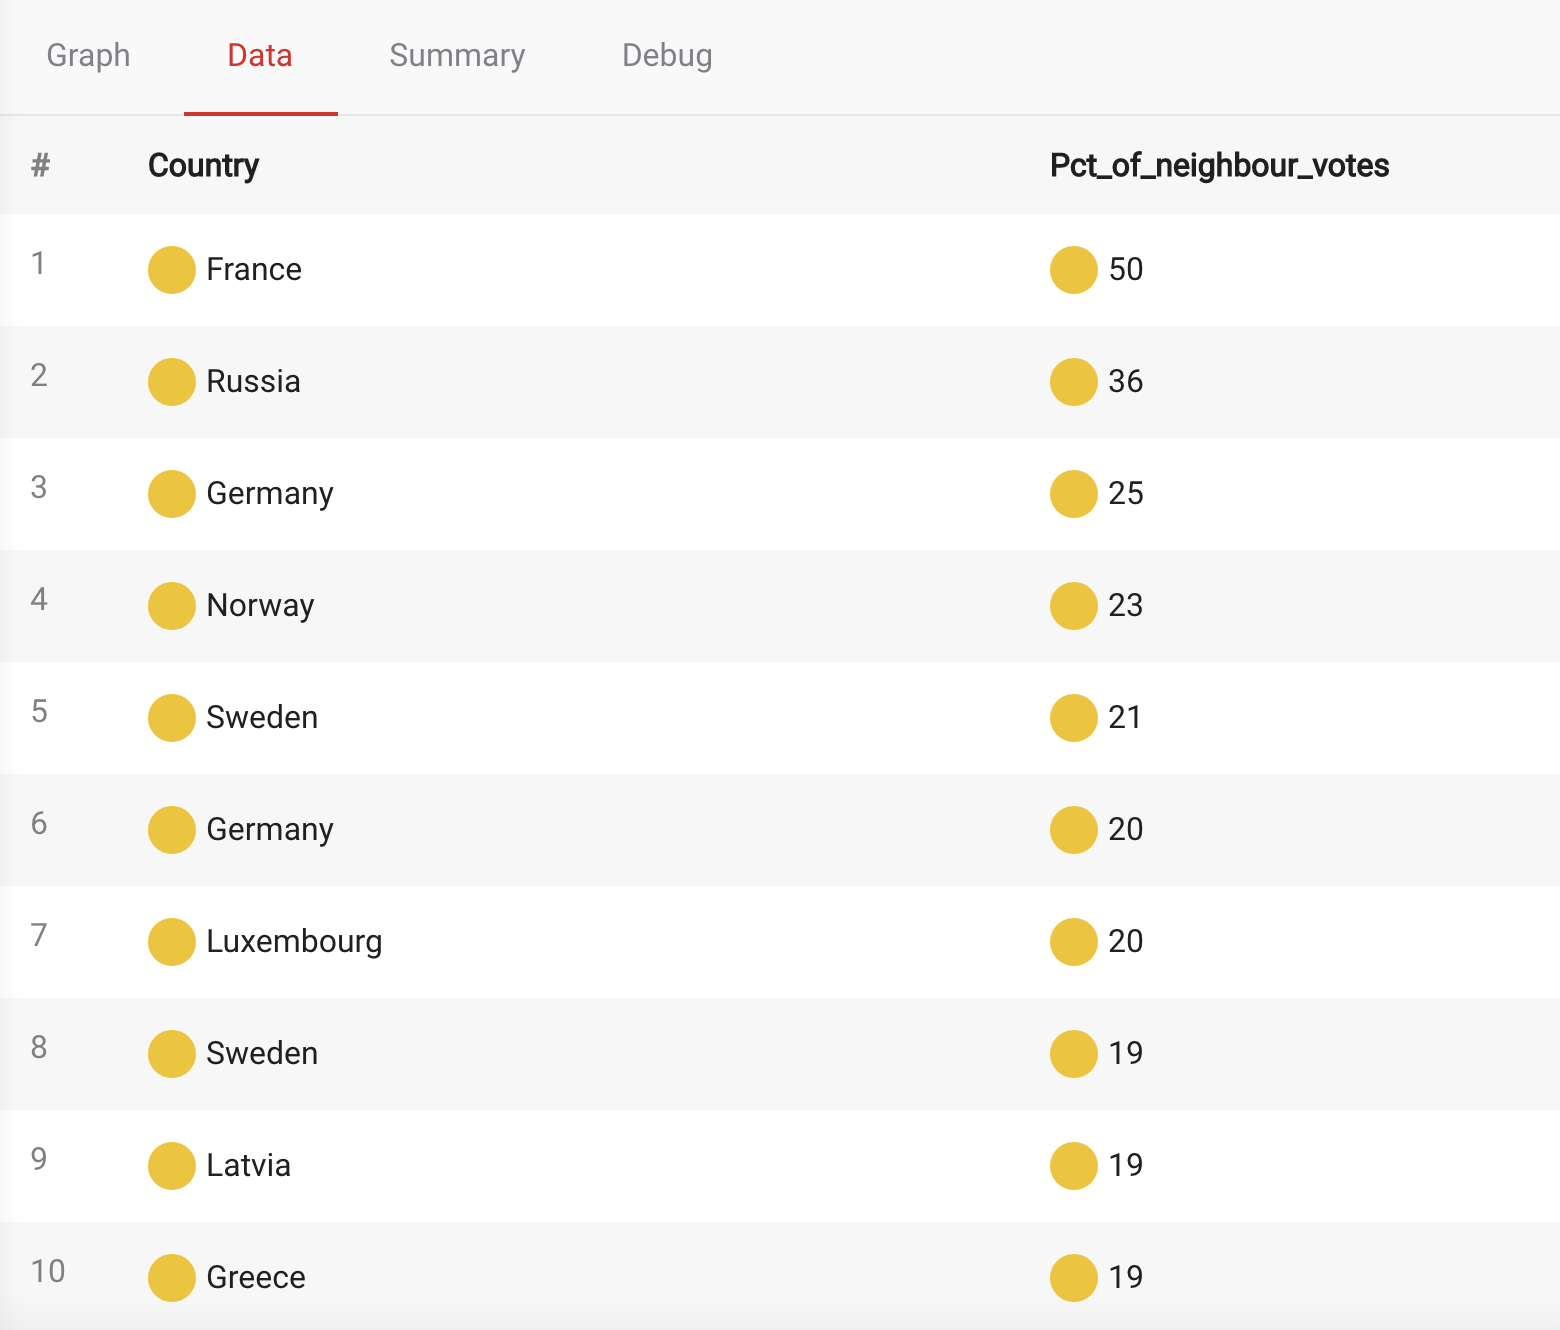
Let's check how number of points from neighbors influenced the choice of winners over the years:
MATCH (w: Winner)-[i:IS]-(c1: Country)-[b:BORDERS]-(c2: Country),
      (c1: Country)<-[v:VOTE_JURY]-(c2: Country)
WHERE i.year = v.year
WITH c1.name AS Country, sum(v.points) AS neighbour_points, i.points AS total_points
RETURN Country, round(1.0 * neighbour_points/total_points * 100) as Percent_of_neighbour_votes
ORDER BY Percent_of_neighbour_votes DESC;
Looks like France has amazing relationships with its neighbors. But is it about quality or quantity?
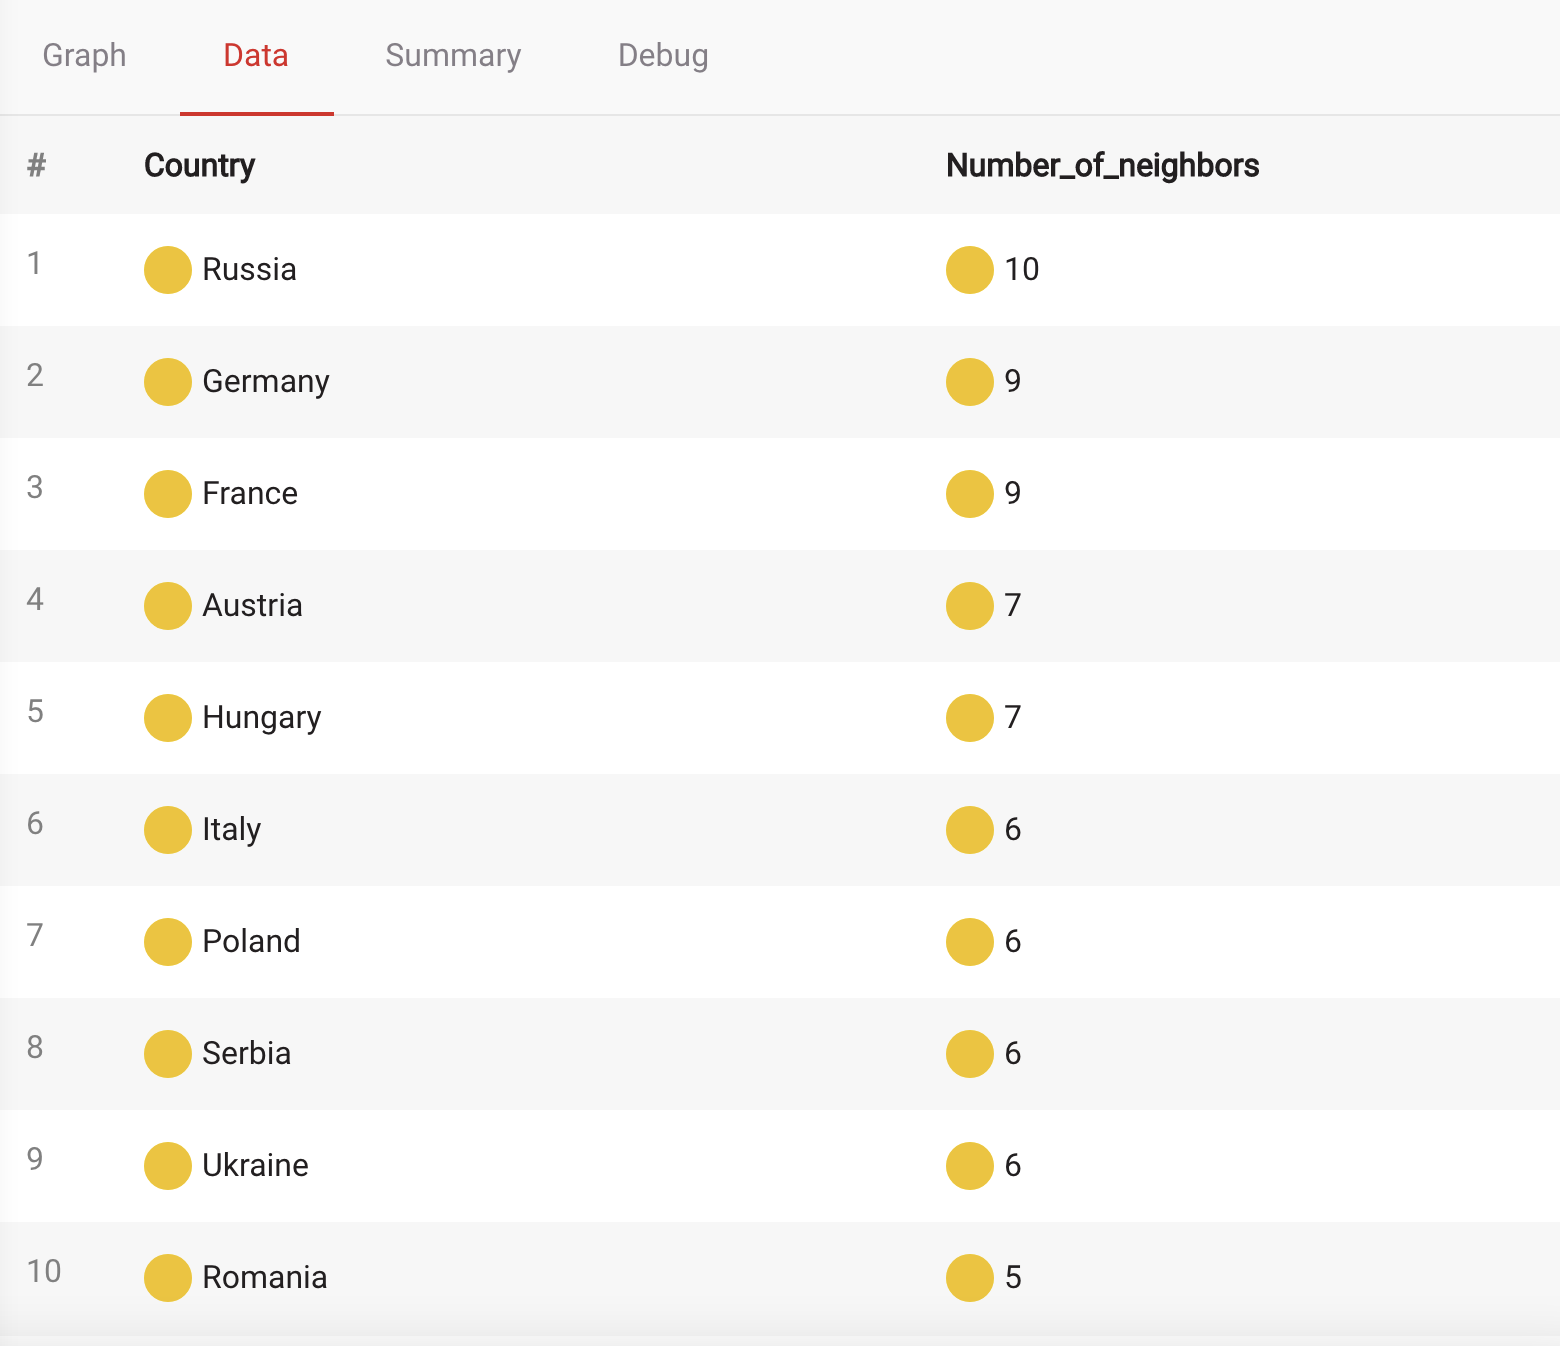
First, let's find out who has the most neighbors participating in the competition:
MATCH (c1:Country)-[:BORDERS]-(c2:Country)
WITH DISTINCT c2.name AS Neighbor, c1.name as Country
RETURN Country, COUNT(Neighbor) AS Number_of_neighbors
ORDER BY Number_of_neighbors DESC LIMIT 10;
Seems like quantity wins in this case. France, Russia, and Germany have the largest number of neighbors and the most significant influence on their victories.
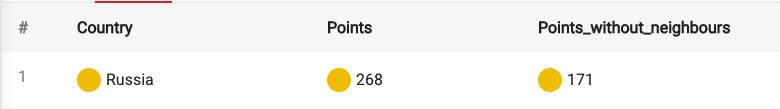
Let's finish with a specific example of how much geographical location influences the vote. Russia was the winner in 2008, but how many points would it get if voting for neighbors were forbidden?
MATCH (c1:Country)-[b:BORDERS]-(c2:Country {name: 'Russia'}),
      (c1:Country)-[v:VOTE_JURY {year: 2008}]->(c2:Country)
WITH sum(v.points) AS border_vote, c2.name AS name
MATCH (:Country)-[v:VOTE_JURY {year: 2008}]->(c:Country {name: 'Russia'})
RETURN c.name AS Country, sum(v.points) AS Points, sum(v.points)-border_vote AS Points_without_neighbours;
That's a significant difference!
Conclusion
There is a lot more to untangle and explore, but as the 2021 Grand Final is approaching, it's time to stop analyzing. After we find out this year's winner, we'll update the dataset and come back next year with new and more exciting analysis. Until then, for more interesting examples of how to use graph analytics to analyze network data, visit Memgraph Playground and check out one of the available tutorials. You can also download Memgraph Lab and try it out locally.
Now relax and enjoy all things Eurovision! "Good night, Europe! And Good morning, Australia!"