
Why Should You Use Memgraph When Dealing With the Power Grid and Energy Topologies
Graph databases are a smart choice for dealing with energy management systems. We have already outlined the benefits of performance, analytics and visualizations of graph databases in energy management systems. However, every graph database vendor has different features and capabilities that fit different use cases.
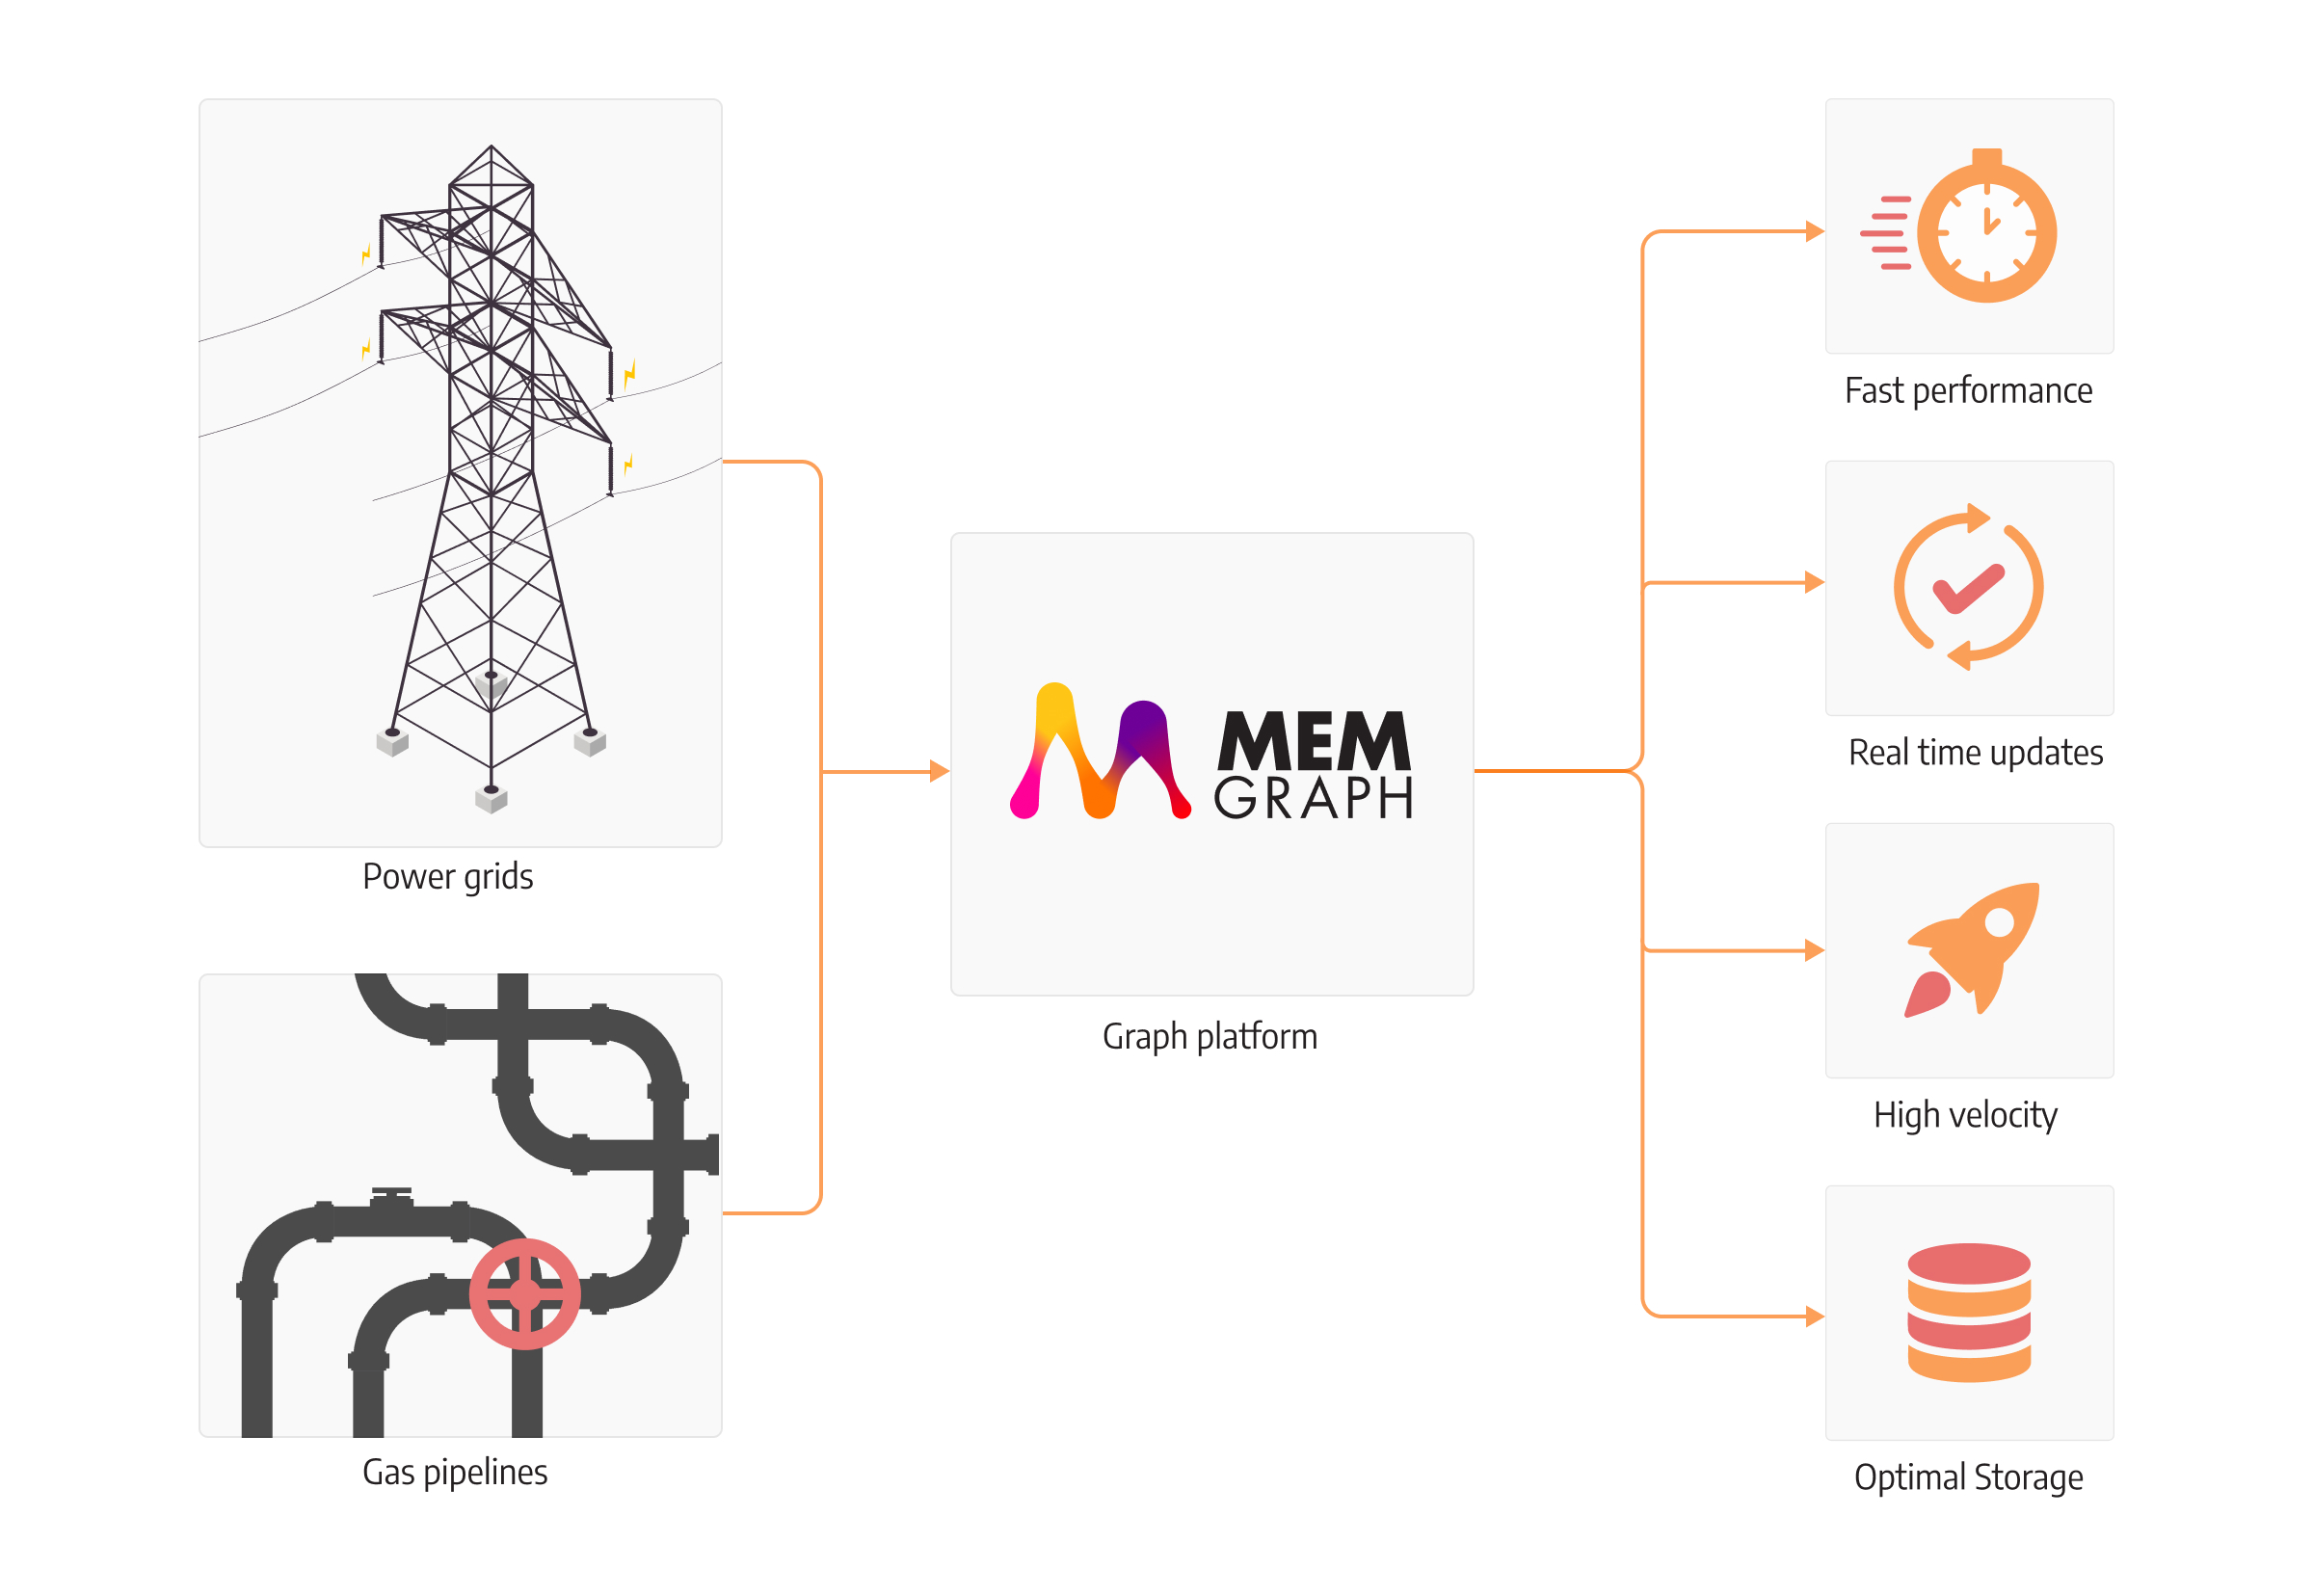
This post will showcase what Memgraph offers as a full-fledged solution for dealing with problems in energy management systems. It will showcase how fast computations, visualizations, extensions to analytics and additional features that enable real-time processing can be used to manage networks no matter how complex or dynamic the system is.
Motivation
In the age of digital innovations, many industries followed the same path of introducing technology and computing ideas from scratch to adopting fully scalable solutions. A decade ago, most technologies didn’t even have referential domain applications able to deal with day to day operations of the people working in the industry. The same can be said for the energy industry as well. When someone finally saw value in automating that industry and the grandiose application was built to solve all the problems, it worked marvelously, up to a point when it no longer does.
That point is the era of big data. It is no longer good enough to have a solution that just automates human actions. Modern systems need to be scalable. They need to be able to handle large amounts of updates of component states and not crash in highly dynamic environments. They need to be able to do huge amounts of computations per second to balance supply and demand, as well as ingest and visualize data.
The graph representation of the power grid topology enables companies to gain insights more easily. Modern energy management systems also need to be able to react with minimum latency when power outages happen, so companies can take meaningful action and decrease the impact of the power loss. Systems need to simulate different scenarios with ease to support analysts while doing risk analysis and managers making business and investment decisions.
When big data became crucial for analysis, the original systems began to hiccup and initial architectures started to show their flaws. At the same time, new technologies, databases, event streams, and many other products emerged as new scalable solutions. One of those solutions is Memgraph, a high-performance graph database designed to work in dynamic environments. Find out how the Memgraph ecosystem can solve some of the biggest challenges businesses in energy topologies and pipelines are facing at the moment.
Topology analysis
Loading the topology of an energy system takes up 25-35% of the processing time, which is a staggering amount. Once that gigantic network is loaded up and rendered with visualization tools, there are several basic questions regarding the topology that need answers. What is the maximal flow through the entire network? What is the critical part of the gas pipeline, and does it require the support of additional resources? From what angles can the network be looked at, and can a change in perspective lead to new realizations? It’s either really difficult to write these queries with SQL queries or impossible due to an enormous number of constraints these systems can have.
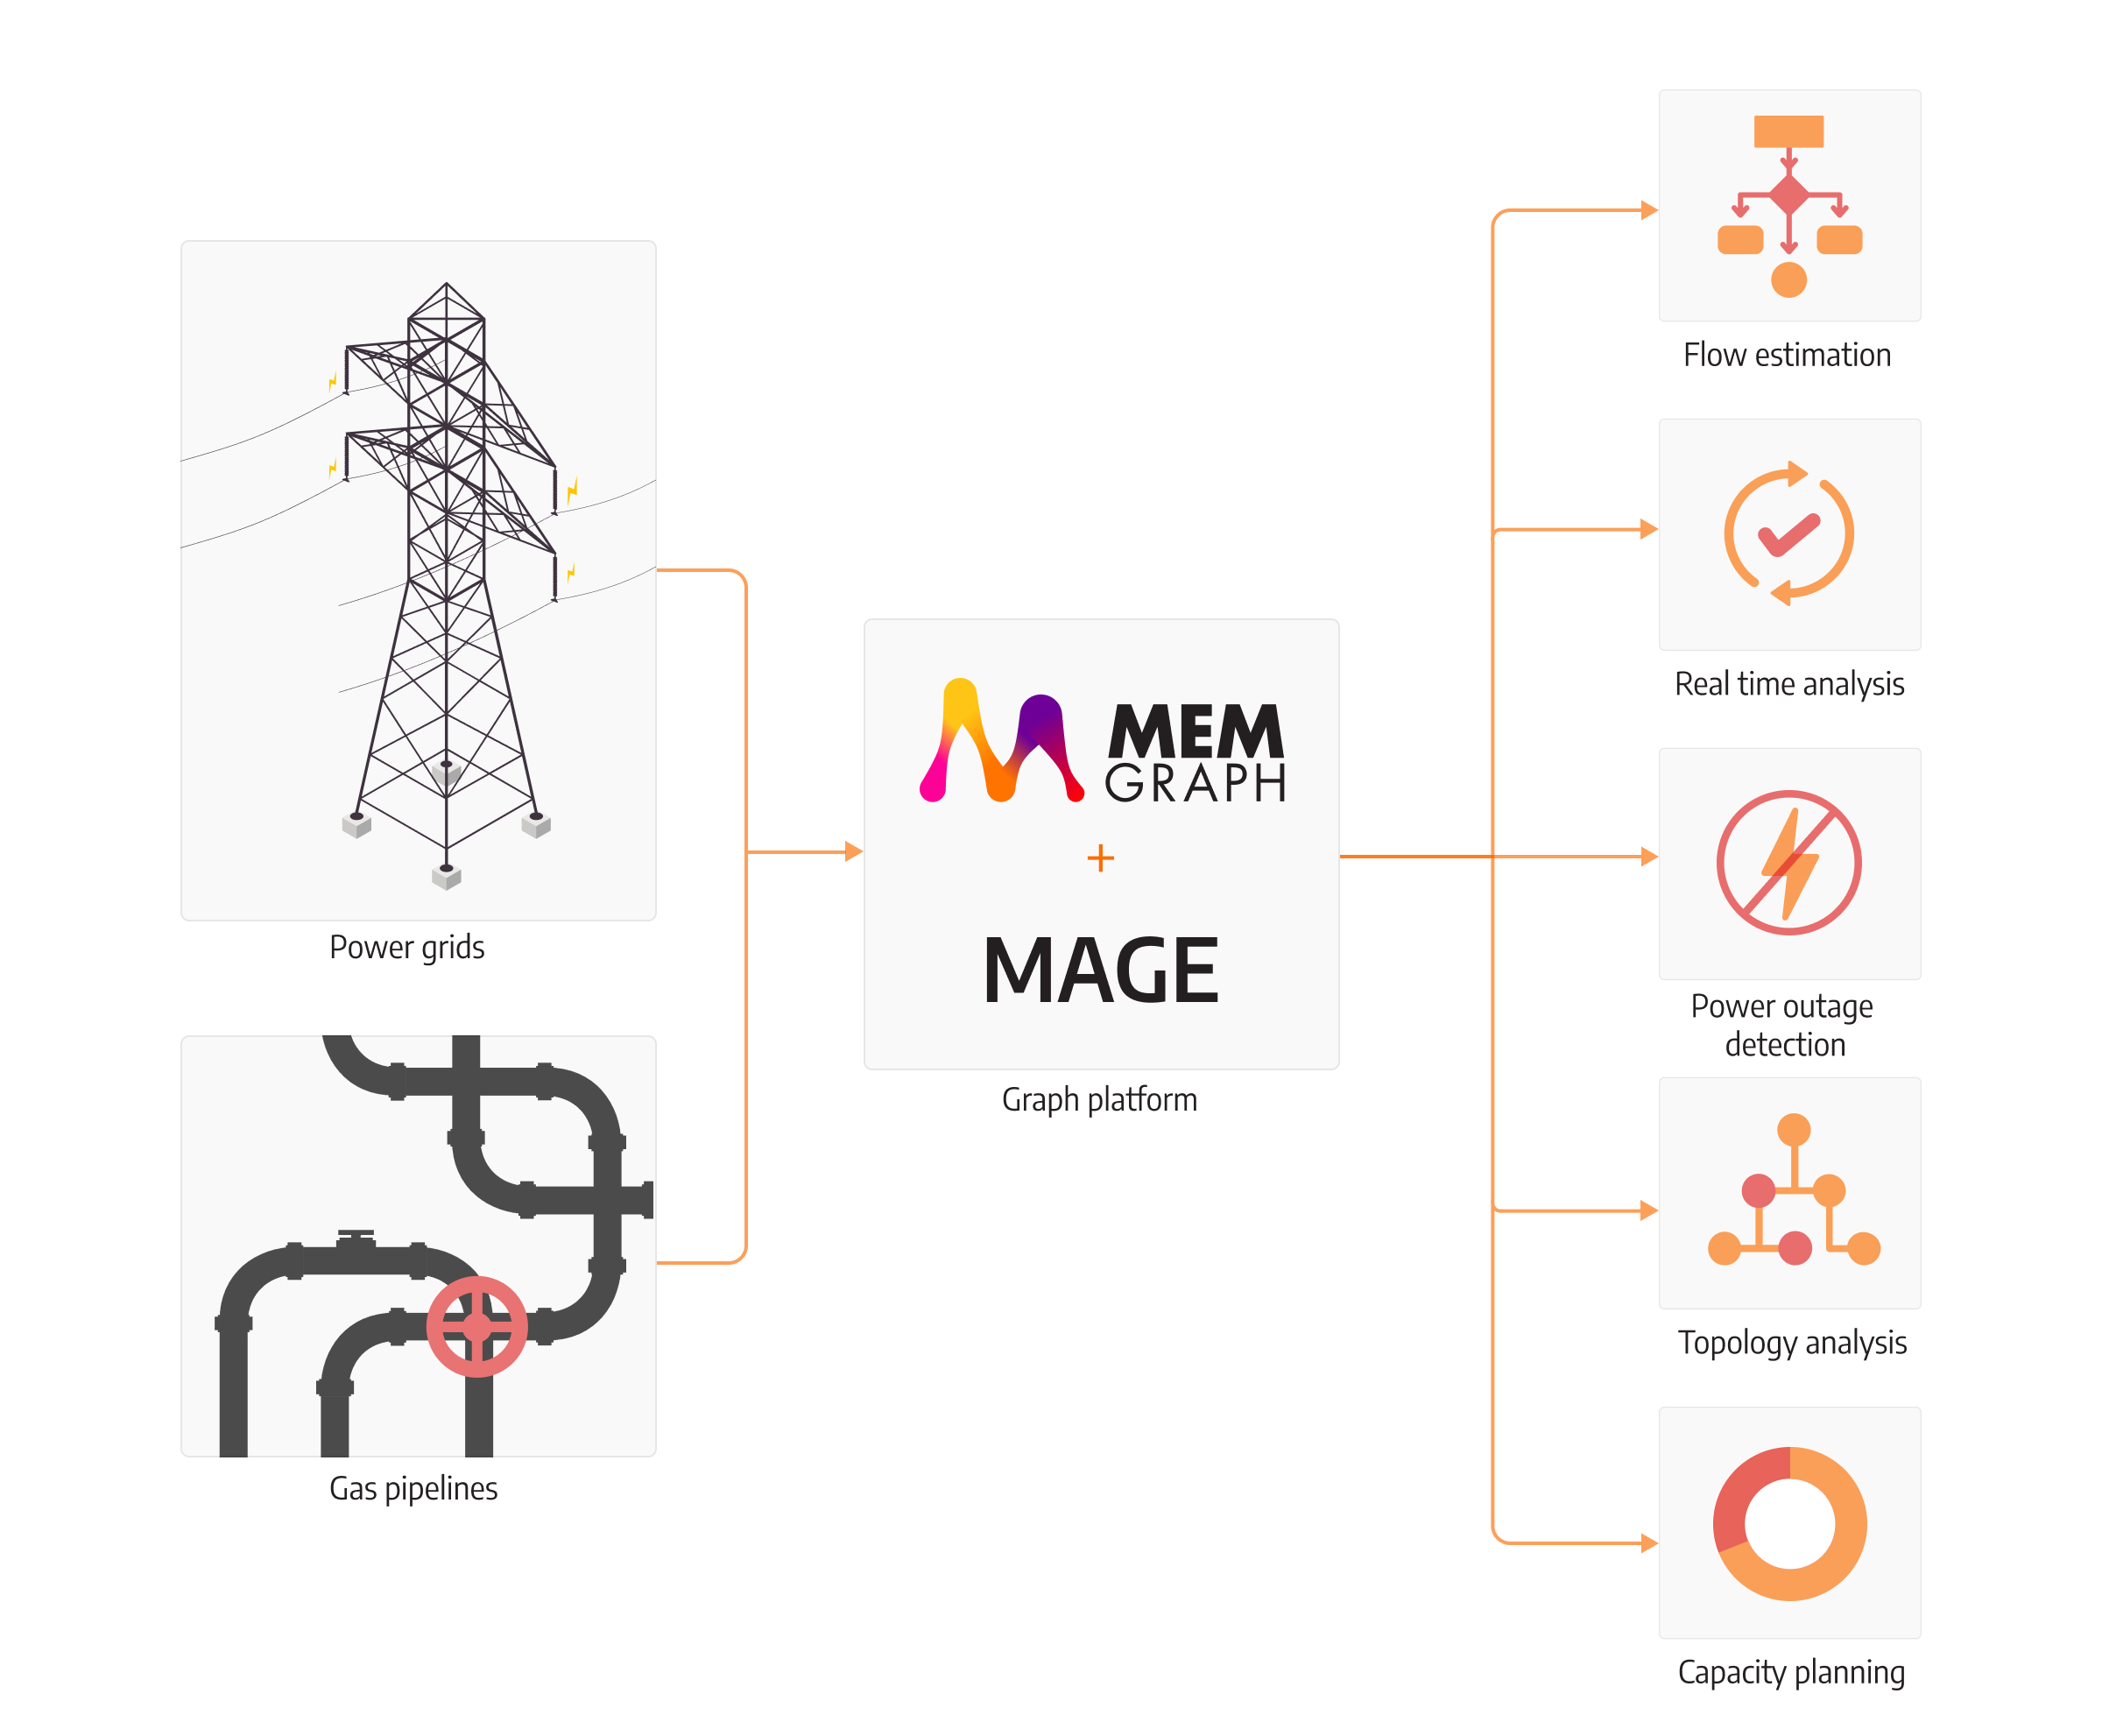
Memgraph, being a graph database, supports traversal queries, which are designed to analyze networks and highly connected data. Memgraph is able to ingest networks, retrieve already stored networks, or analyze paths and bottlenecks by inspecting simple neighboring connections or the whole network. Its graph analytics library, MAGE, which stands for Memgraph Advanced Graph Extensions, offers a number of graph algorithms that are reusable in any domain, including the energy management industry. For example, questions about the maximum capacity flow or hubs analysis can be immediately answered with betweenness centrality algorithms which will provide meaningful information without any data preprocessing whatsoever.
Another feature incorporated in Memgraph is graph projections which offer the possibility of traversing, querying and executing graph algorithms on subgraphs rather than doing it on the whole network. Another thing incorporated in Memgraph is graph projections. The key takeaway of graph projections is an environment where people can work against the right abstractions in the graph. One data analyst might be interested in connections between power generators in one country, while the other might be working against the gas pipelines in the whole EU.
Fast computations for real-time state estimation and flow analysis
To be able to react quickly to unexpected events, such as power outages in the grid, the system needs to react fast and with as low latency as possible. Upon an event, the system either needs to alert specific people, transfer energy through a different path, or do whatever it’s designed to do, but the action needs to be immediate. With dynamic systems, this challenge is sometimes impossible to overcome. Systems mostly batch updates and calculate states at a discrete time to explain what happened at some point in the past. Systems would behave more accurately if they could precisely calculate the flow or state of the system within a minimum time interval.
With Memgraph being an in-memory database, all data is loaded to memory from the initialization while still retaining the ACID features of the database since snapshots of the database are backed up to disk. Optimized in C++ to reduce memory footprint, it gives the user the possibility to stay in real-time with the high-velocity system if there is a spike in usage or data ingestion.
We talked about how graph algorithms can solve some of the typical problems related to topology. Memgraph’s graph algorithms are robust to changes in the database and calculate the graph analytics ad-hoc on changed data based on deeply researched dynamical algorithms combined with triggers. Since state updates in the network sometimes affect only a local neighborhood of the nodes, insights obtained from large datasets don’t need to be recomputed again but are optimized to keep on ingesting high throughput data and provide updated insights in real-time.
Extendable analysis
Although versatile tools that can handle a wide range of tasks and be set to different modes of work depending on the domain and the system do exist in the industry, there is no tool that can account for all the different day-to-day operations and situations businesses need to cover. Versatile tools are built for what is believed the most common tasks for grid topology analysis, such as hubs analysis that will help analysts further decide should the company invest in a robust power grid. But here and there, a task will emerge that is not supported by any of the tool’s features.
Because Memgraph is an open-source product, its algorithms are highly extendable. Users can create new algorithms and modify existing ones to their needs. Memgraph offers APIs in Python language for prototyping solutions and analytics or the performant Rust or C++ languages with wrapped automatic memory management to decrease time to value.
Additional tools include GQLAlchemy, a wrapper around the Memgraph client that interacts with the database objects in a Pythonic way and allows Python data analysts to have an additional tool for analysis and data inspection under their belt. The result of all these tools is being able to seamlessly write any kind of traversing logic to gain insights about the current state of the energy network.
Topology custom visualization
If all the people working in the industry were identical, they would all be comfortable working with only one visual representation of the data. And although the issue might not be considered crucial, the design and visualization of the network often help people understand what’s happening with the data so they can apply their own knowledge to make decisions. Because people, not computers, usually make decisions of great importance to business, such as decisions about investment, reputation or safety measures, it’s in the company’s best interest to enable visual customization to fit peoples’ needs.
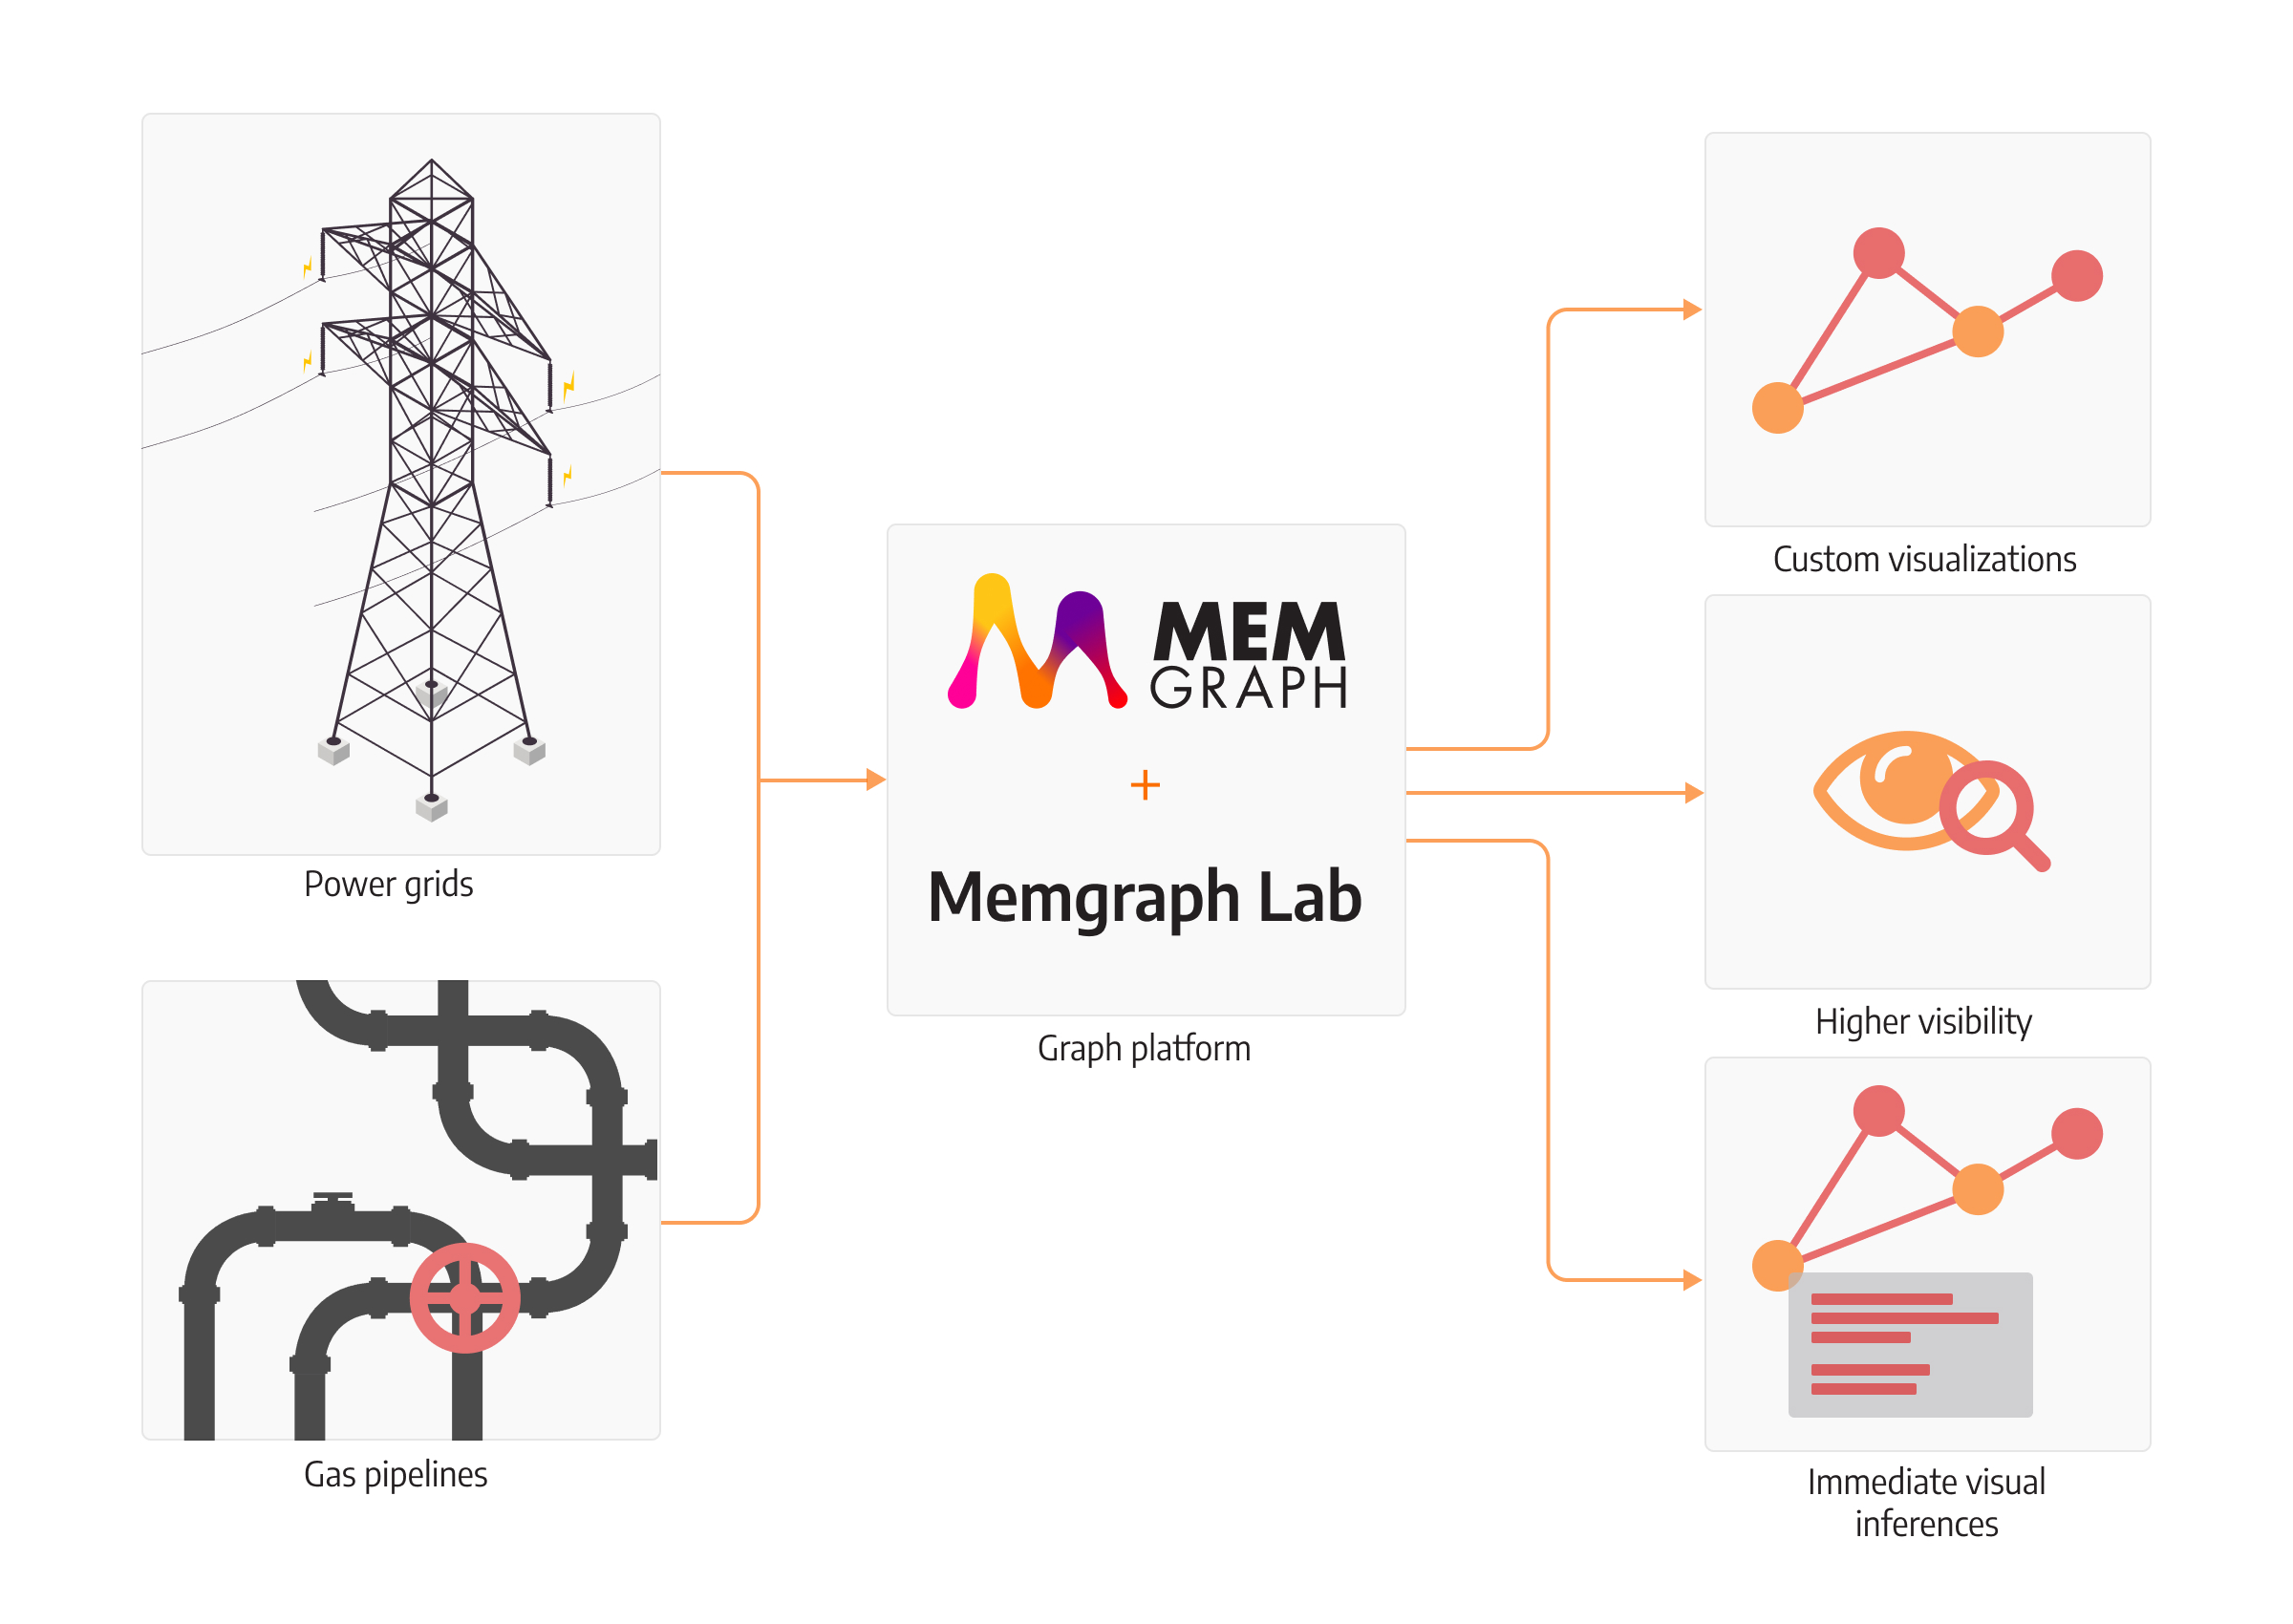
Among its many other features, Memgraph’s visual interface Memgraph Lab offers customizable visualizations of graphs displayed on the plain or certain geographic grid. The latter is specifically useful for displaying topologies between physical components in various towns, countries and continents.
Nodes and relationships can be edited and saved as graph styles for any occasion, such as showing specific topologies or running algorithms that highlight different types of connections. Its visualization brain is called Orb, an open-source graph visualization library developed by Memgraph as well. It’s customizable and can be embedded into any application.
Conclusion
Although changing legacy software is often considered a hassle, it definitely pays back if your system needs to be scalable, fault-tolerant, and performant. This post has outlined some of the biggest problems in the energy industry and presented Memgraph as the go-to solution to analyze your highly connected power grids or gas pipelines to make meaningful decisions and improve the impact on your business, the people and the environment around you.