How Can Companies Meet Energy Management Demands in the New Era - A Graph Approach
As blockchain and machine learning were the buzzwords 10 years ago, it seems that energy will be the buzzword of this decade. Being the most powerful asset in the upcoming years, it comes as a surprise that handling and managing power remains rather poor.
Let’s look at some numbers. Due to the pandemic, there was a 4.5% decline in energy consumption in 2020, but the statistics from 2021 show a rebound of an unbelievable 5%, marking the highest growth rate yet when compared to the usual 2% growth rate in recent years. To handle, store and transport all the necessary energy, complex interlinked systems and topologies are constructed to ensure that the supply meets the demand.
However, when things go south, modern tools are unable to detect failures in large network systems or perform sub-optimally in the best case. The US alone suffered 1.33B hours of power outage in 2020, with a loss to businesses of over 30B dollars.
In this article, we’ll dive into the reasons why the current analytical tools are no longer performant enough and introduce a graph data approach that solves problems regarding performance, analytics, and visualizations of energy systems and topologies.
Motivation
With the rise in size and complexity of energy system topologies, it’s fair to ask: “Can the underlying, supposedly state-of-the-art tools and systems handle the amount of processing power and data increasing every year?” To answer this question, we need to look at the architecture beneath those tools.
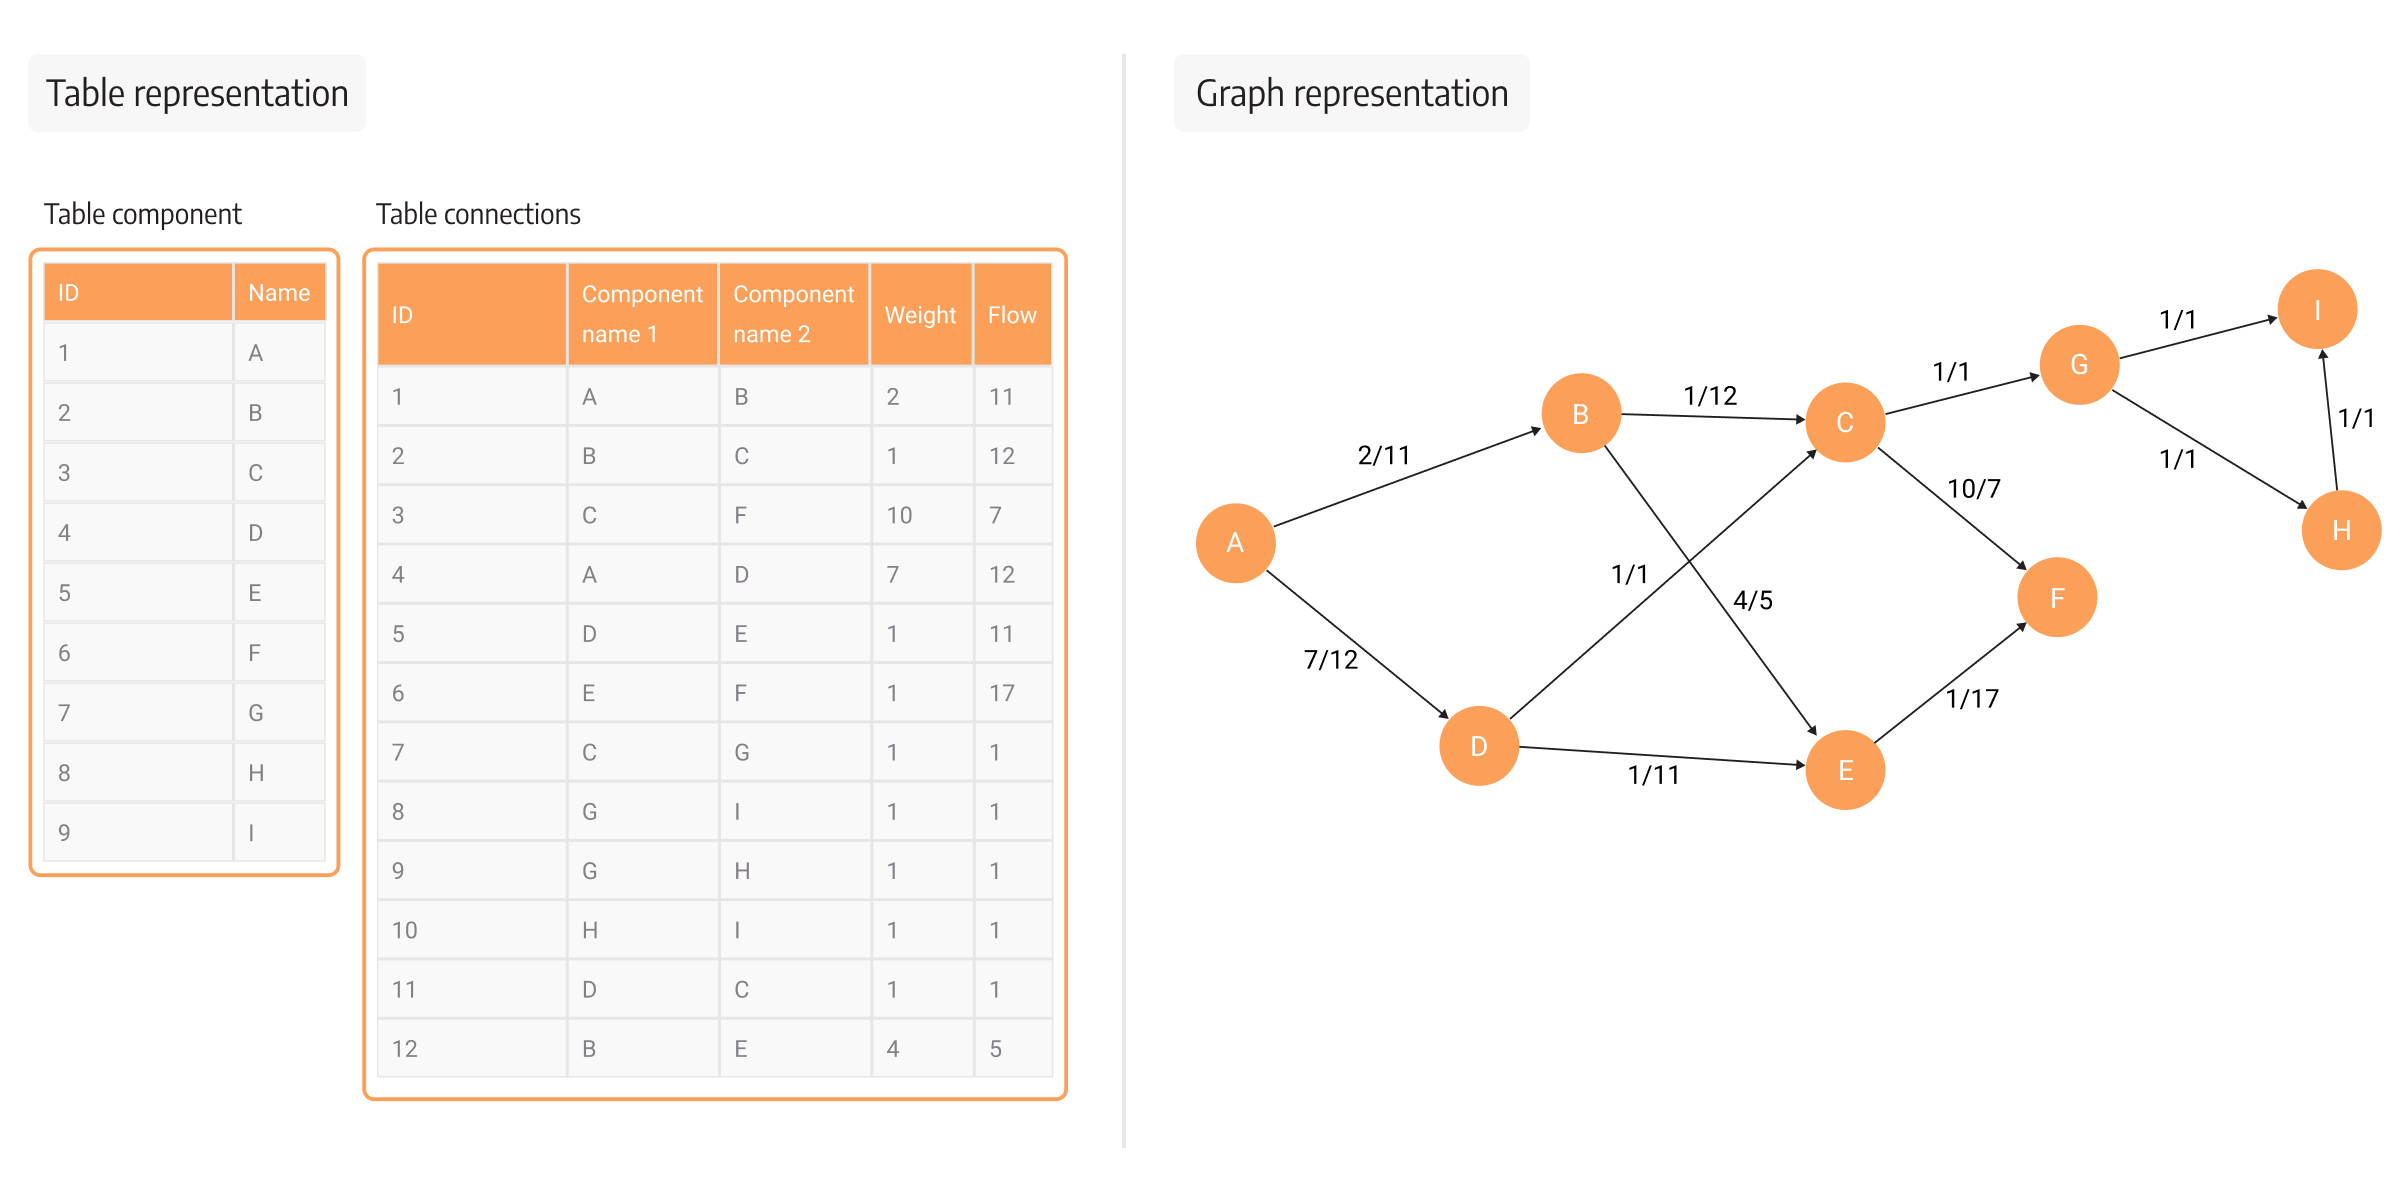
The base is a network of interconnected components representing various plants, energy power grids, gas pipelines, and similar. Each component inside the network can have one or many incoming, outgoing, or bidirectional links to other components, which indicate the transport of resources, such as oil, gas, electrical current, etc.
The end goal of the tools is to provide additional insights besides the raw topology of the network. Additional insights can be gained from analyzing power flow calculations, balancing supply and demand at different locations, estimating the state of single components, and many more. If the goal is to have a static topology, the current tools work as expected, with the occasional exception of doing some time-exhausting mathematical calculations.
Problems arise when topology needs to be dynamic or when the topology size increases from the topologies of cities to the topologies of countries or even continents. If we look at the topology of Europe, the size and complexity of the data quickly rise because every country has different demands, expectations, or constraints. At this point, the tools which were once passable, become slow and unable to perform analytics at the required pace.
This decrease in performance stems from the fact that data is traditionally stored in relational databases. Relational databases have been around since the 80s, and before the age of big data, they were the most rational choice when developing applications and analytical tools. The size of the data was, to a great extent, smaller than today, and computer hardware was improving vertically to support computing operations and improve processing time, which was the biggest bottleneck at the time.
Over time, data complexity has increased so much that relational databases are becoming more and more impractical for many use cases, including energy management use cases. This is largely due to the usage of JOINs and recursions, which are essential in modeling a topology in a row-based manner.
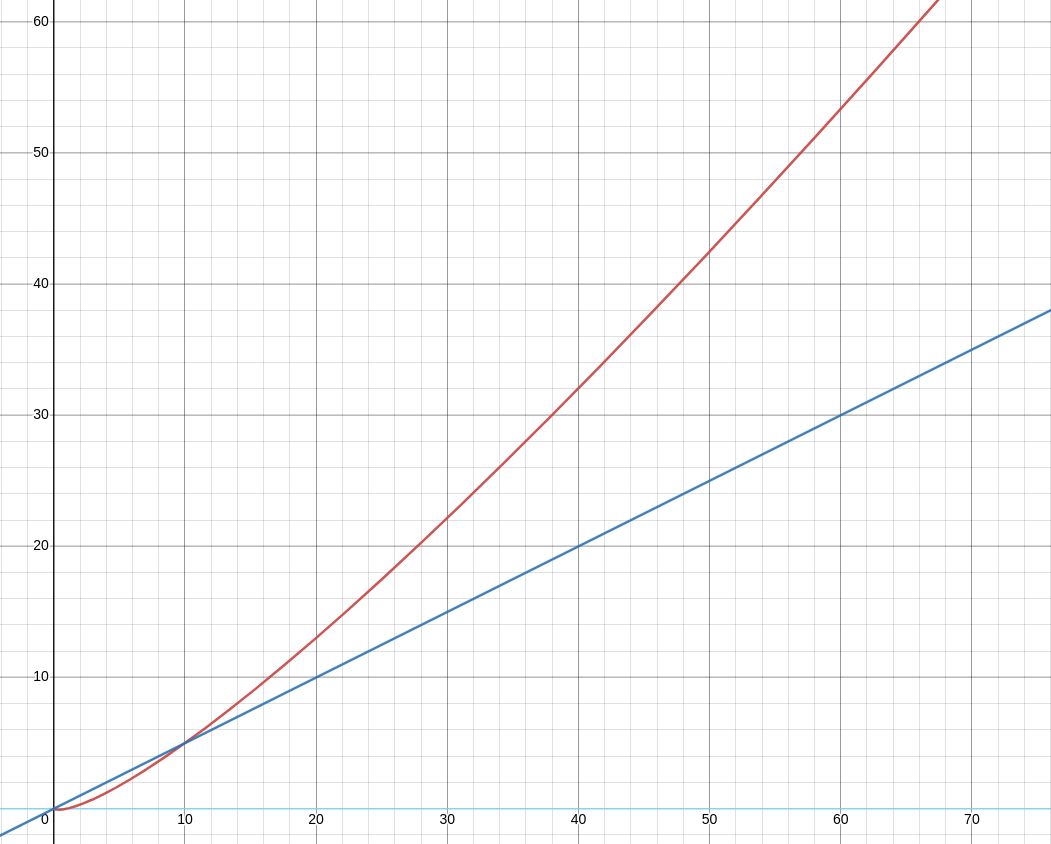
To display a topology, all the connected components, usually listed as pairs in a many-to-many foreign key table, must be joined by a complex cypher recursion. The complexity of one JOIN is O(n log(n)), and the number of recursions can grow up to k, with k being the number of hops from 2 of the most distant components in the topology, which brings us to the big O notation of O(k n log(n)). The results shown in the image below imply an extensive complexity considering the only goal is to list the whole topology without even doing any analytics. The red line, representing the time complexity of JOINs, is clearly rising steeper than the linear complexity (blue line).
This alone proves that tabular data is not optimal for analytics and queries that look for patterns in the topology. Analysis of tabular data is well-suited for aggregations and mathematical operations, however, when it comes to impact analysis, root cause analysis, or simulating new scenarios, row-based calculations perform poorly at best. They are unable to perform traversals and detect weak points which could lead to power outages (impact analysis), or analyze what has actually led to a power outage (root cause analysis). The most recent context where we could use a tool that performs well is to search for alternative topology compositions in times of political turbulences which affect energy pipelines.
What’s worrisome is that, even though these flaws are common knowledge and can lead to devastating consequences, traditional software tends to outlive the test of time. They provide information about flows, supply and demand but are becoming outdated due to the deprecated implementations for the use case. All the work on dynamic systems with a high amount of updates per second is left to the staff, and the tools they are provided with complicate their lives instead of making them easier.
The good news is that there is a technology we can turn to in order to solve these issues, and that is graph-based data representation.
Enter graphs
The problems regarding the tabular representation of topologies have been addressed with the arrival of new types of NoSQL databases, namely graph databases, which are able to store networks of data.
Networks consist of nodes (also called vertices) and relationships (also called edges), and are the first-class citizen of the graph database. This approach was constructed specifically to address the problems of JOINs in relational databases, but as we will see in the next few sections, graph databases didn’t only solve the issue of complex JOINs, but they also paved the way for graph analytics and network visualizations as well.
In a graph database, all the data is already joined the moment it arrives in the database, and relationships represent pairs of connected nodes. The result of having all the data connected immediately enables access to joined elements in constant time (O(1)). Not only that, but it also abolishes the need for foreign keys, as checking around multiple tables to search for pairs is no longer required. Everything is already paired and connected.
Here is another explanation of how this approach would work in real life. Consider that a component in your power plant is a node, and you’re looking to see what is the closest component the power plant can be connected to for energy transfer. You would probably immediately think of the neighboring power component since you probably know the outline of your power plant. There shouldn’t be any friction or complexity on the path to finding that the neighboring power component is the answer to your question. That would correspond to a graph-like approach of matching data.
In the same scenario with relational databases, you specifically need to look at the administrative center of the company (foreign-key pair table) to find the location of the power component and realize it’s the neighboring component. A conclusion you couldn’t make without having the information about what components are joined first. To visualize a whole topology of neighboring components with relational data, the JOINs become a problem, not a solution.
Let’s dive deep into how graph data representation can benefit the energy management use case.
Representation of the topology feels most natural in a graph
The advantage of being able to search neighboring nodes in constant time has already been explained in the chapter above. Let’s expand this concept to the scale of the whole energy system topology. Under the hood, a graph is modeled with adjacency lists optimized for expanding the graph to inbound or outbound nodes. Adjacency lists correspond to skip lists in the implementations using a relational database. To load the whole topology would mean using a graph traversal algorithm such as breadth-first search (BFS) or depth-first search (DFS), which are quite common traversing algorithms, to discover and visualize all the nodes and their relationships.
The time complexity of these algorithms is O(V + E) if adjacency lists are used, which increases search performance drastically as we reduce complexity to a linear scale. Furthermore, if more components are added to the topology, the time spent traversing the network is not as affected as it is in relational databases.
Another reason for improving the storage implementation is the need for dynamic systems analysis. Frequent updates of component states in the network require an efficient way of preparing the data for processing (mostly loading data into memory). In relational database systems, an average of 25 - 35% of the query processing time is spent on joining tables required for estimating flow and component states in energy networks. We can safely assume that cutting the calculation process by ~30% would greatly improve the efficiency of people using energy management tools.
A new approach to analytics
With the new way of representing highly connected data, searching for patterns and insights within the dataset changes as well. SQL databases were designed to mostly do transactional processing, and back in the day, powerful analytical tools weren’t really needed. With the need for big data analytics, new database products moved away from row-based table storage to column-based ones, called columnar storage. Columnar storages are better at analytical queries but still cannot be efficient enough to analyze connected systems, because they were not actually designed for that purpose.
But both the row and column-based databases used SQL, which cannot easily express relationships between objects in graph databases. Hence, with the introduction of graph databases new languages were developed, such as Cypher (Memgraph, Neo4j), Gremlin (Azure Cosmos DB), GSQL (TigerGraph), and others. They were designed with the main idea that patterns in the database are easily searchable by a simple pattern corresponding to a connection between the 2 nodes in the graph.
Searching through a whole electrical grid system should be as easy as thinking about it.
Examine the Cypher query below:
MATCH (n1:Generator)-[r:IS_CONNECTED_TO]->(n2:Generator) RETURN n1, n2;Without knowing any Cypher commands or syntax before reading this query, you can probably conclude it will return all the pairs of directly connected generators in the graph.
We can expand this query by traversing the graph via different paths. The query below will find all the paths from one node to another by traversing a subgraph and returning its corresponding nodes and relationships.
MATCH p=(n1:Generator)-[r:IS_CONNECTED_TO *bfs]->(n2:Generator) RETURN nodes(p), relationships(p);These queries are the simplest information we can get from a graph representing a topology. But most graph algorithms are based on this simple principle of traversing the graph and doing analysis on incoming and outgoing relationships, such as BFS, DFS, PageRank, Community Detection, and Centrality algorithms implemented in most graph databases. Graph traversals are at the heart of an analytical world unimaginable in relational databases.
But in the end, it’s not the algorithms that bring the most value but the solutions they provide for the problems in the domain. Impact and root cause analysis in case of a power outage, simulations of what-if scenarios, and flow analysis of gas pipelines can all be researched with traversals and graph algorithms since they are the perfect tools for problems in highly connected systems.
To expand on the previous thought, searching through a whole electrical grid system and analyzing patterns and gaining insights should be as easy as thinking about it!
All-in-one tool for your intelligence
As graph databases were sparsely used as a storage and analytical layer, graph database providers focused on improving processing power and exposing a different set of insights when data is represented as a graph.
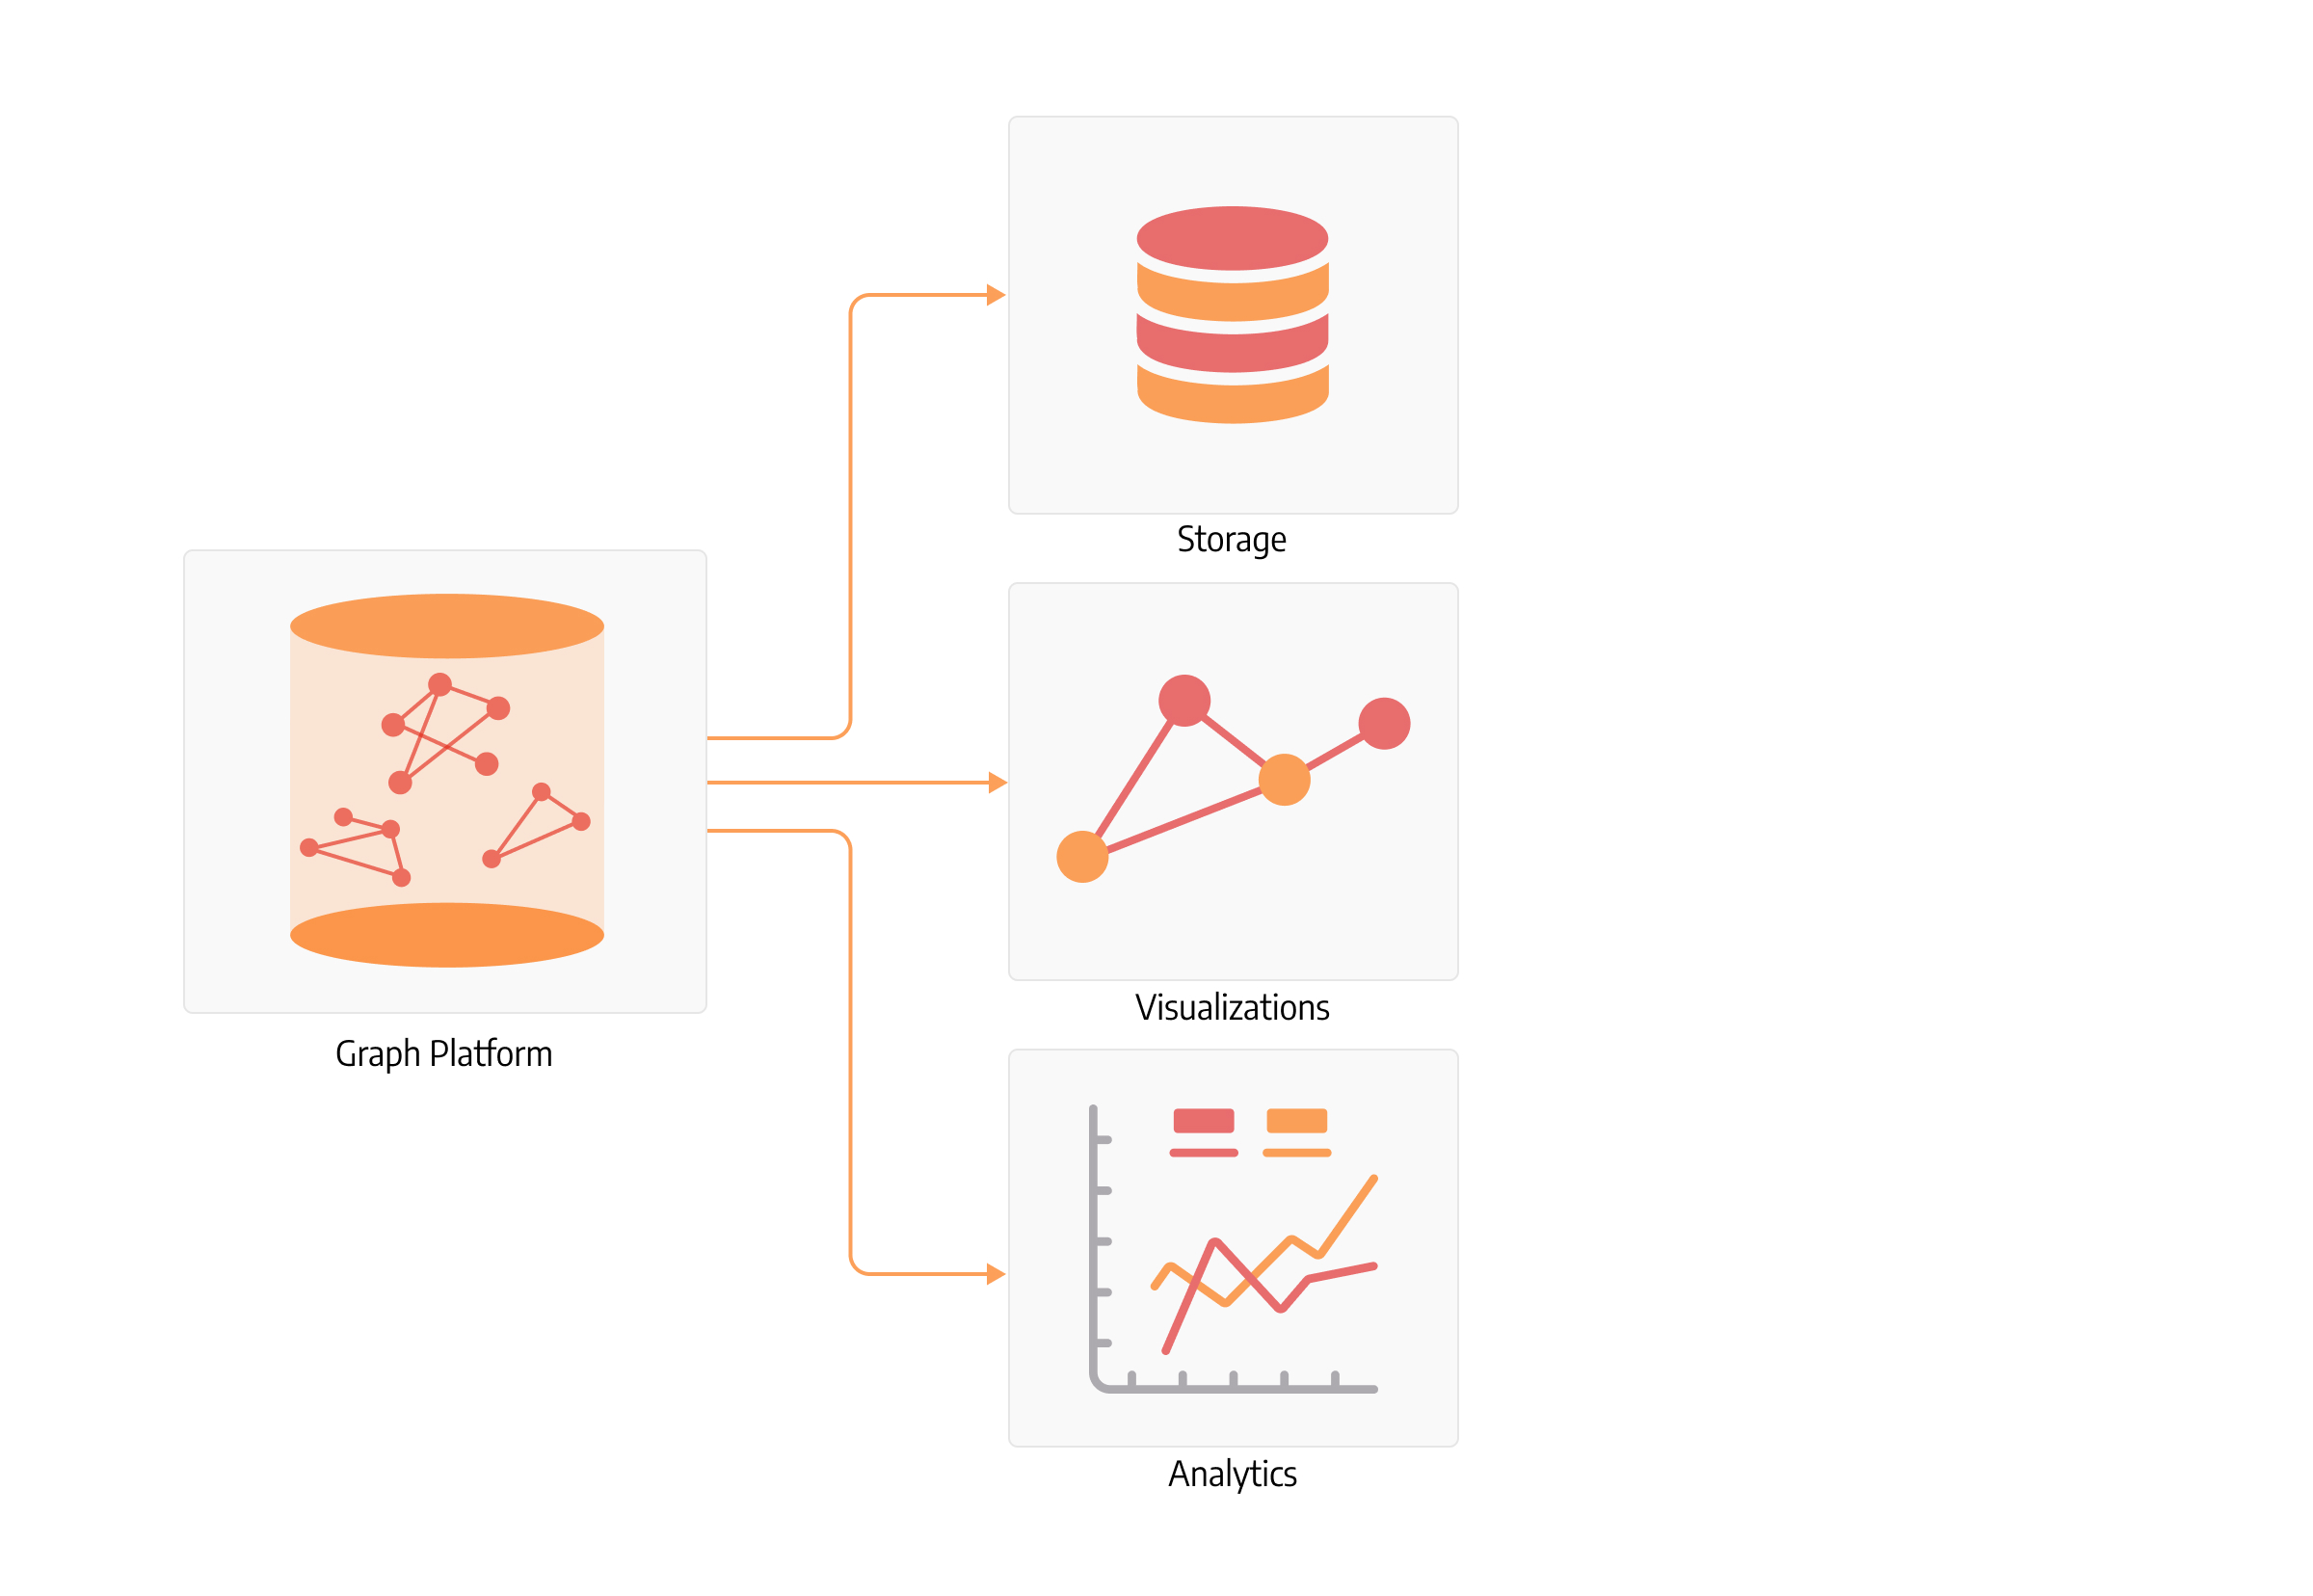
That is why graph databases are not only storage but platforms that frequently include an arsenal of graph algorithms and traversing capabilities, as well as visualization tools.
The whole idea of a centralized system that handles storage, computations and visualizations is extremely important for energy management systems since alerts, state updates and additional information on the topology can be displayed ad-hoc in one place without using a number of clunky underperforming tools that need to be somehow wired together. Additionally, it speeds up the analytics pipeline since the storage and computation power is located in one place and doesn’t need to be transported to another platform.
Conclusion
We have outlined some of the biggest advantages graphs can offer to the energy management industry. Since graph databases were first introduced, a lot of research has been done on the side of computer science, bringing graphs to machine learning spheres and making progress on detecting difficult patterns and insights. This means there are still a lot of unexplored possibilities and insights to be gained from the structures and patterns in the data networks.
All these methodologies, from simple traversals to complex algorithms and machine learning technologies, can be applied in the energy industry to make it more efficient. From the smallest applications built to uncover hidden bottlenecks, such as hubs in the energy grid that need further support with additional buses, or to estimate flow with the MaxFlow algorithm, to the large customized applications with complex logic fitting the industry and company needs.