Real-Time Graph Visualization of Bluesky
Bluesky is a relatively new social network similar to Twitter. While the project was started in 2021 and is still in its invite-only beta stage, some reports show that it already has over a million installs. Unfortunately, it currently doesn’t offer all of Twitter’s features, but it does have a cool (free) feature - custom feeds! This allows developers to write their algorithms for showcasing custom kinds of posts. You can then subscribe to the ones you consider useful and scroll through.
Memgraph has its feed called Home+. It shows those you care about while also adding interesting content from your extended social circles. The project itself is called BlueJ and has inspired the creation of real-time data visualization of Bluesky. With it, you can keep track of activity on the social network whenever you want. Be it lunchtime or 2 AM, using the newly created visualization tool, you can see new data coming from all over the world!
Using the Bluesky activity visualization
Getting started with the visualization tool is as simple as visiting the website. During development, the goal was to make the user experience as simple as possible. In this section, you will learn how to use the tool to its full potential by utilizing features such as subscribing to a user’s handle and learning more about a desired node.
Keeping track of the Bluesky activity
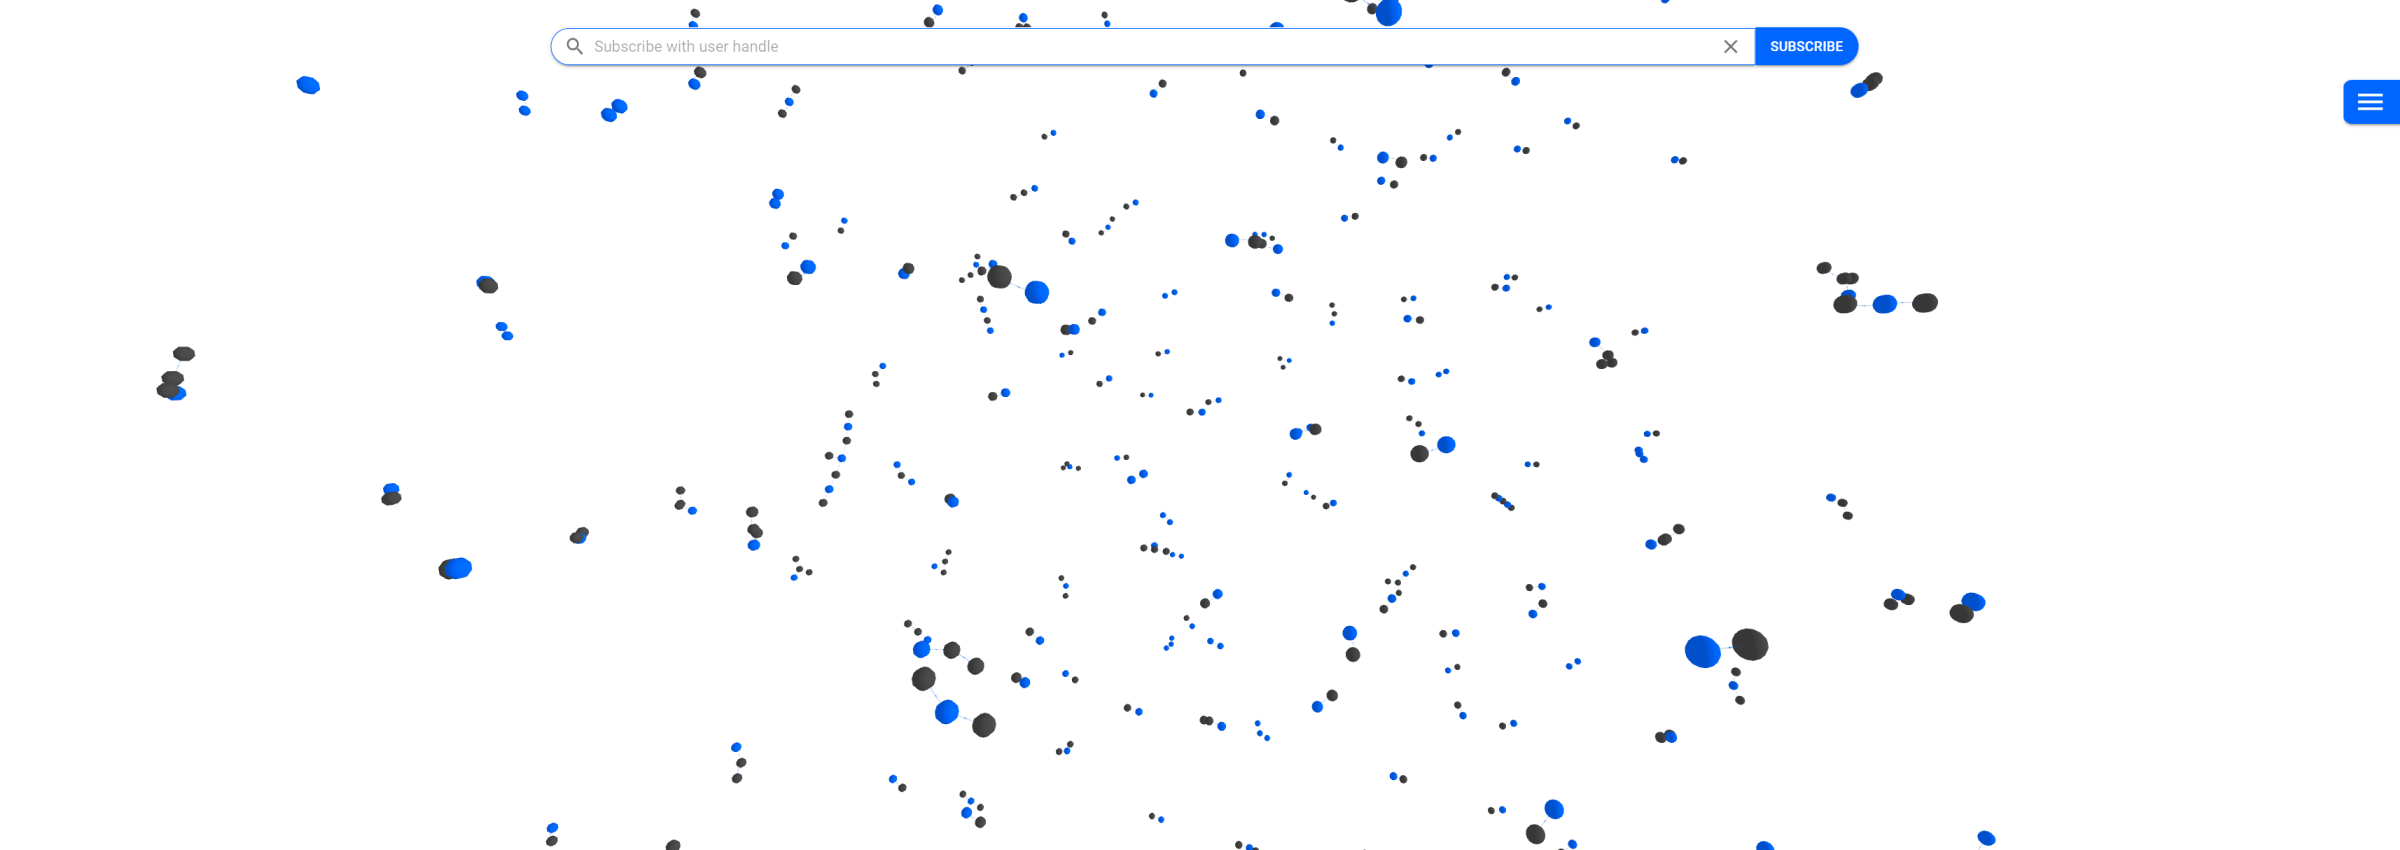
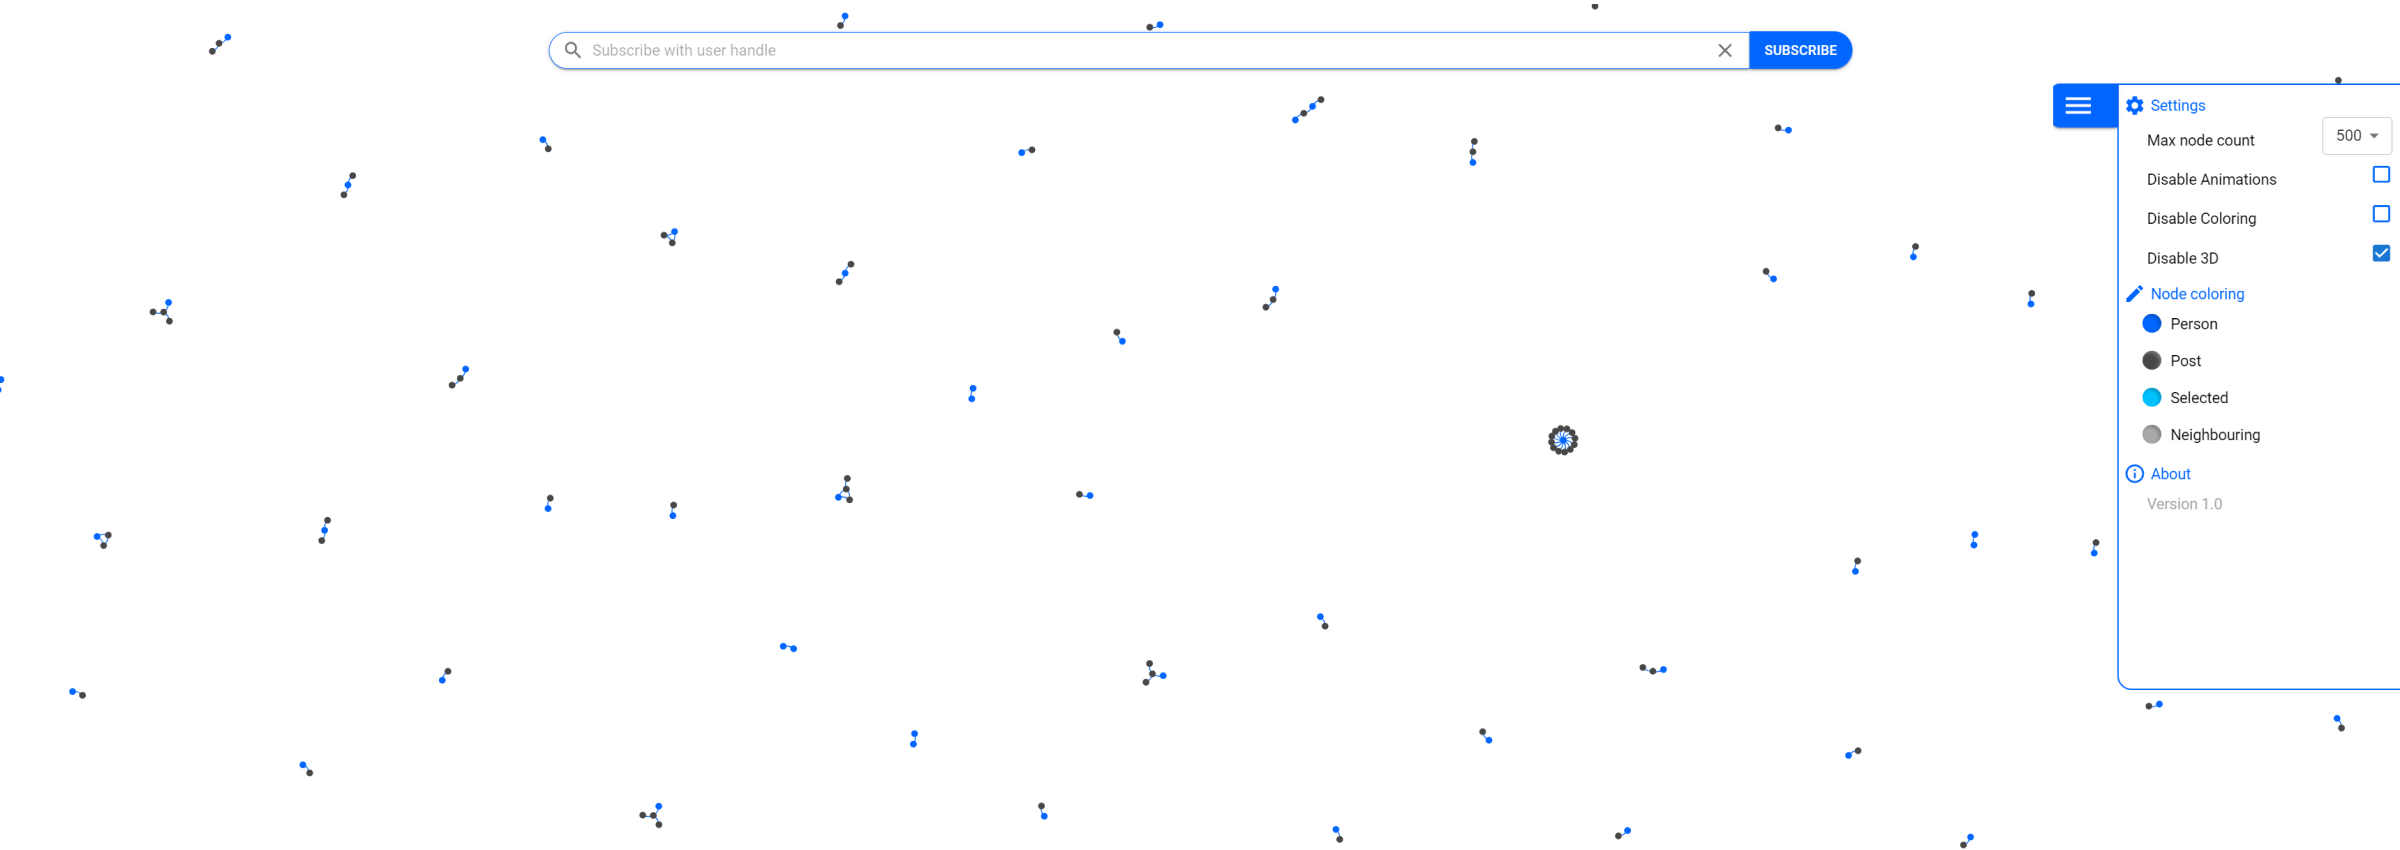
By default, the visualization shows all incoming data as nodes and relationships. For example, active people, as well as posts they create or like, are shown as nodes in the visualization. If a person has recently created a new post, those two nodes will be connected in the visualization. If you want to know what the relationship is, you can hover over it to get a short description. All nodes are color-coded - nodes representing people have a different color compared to nodes representing posts.
Getting more information about certain posts or users
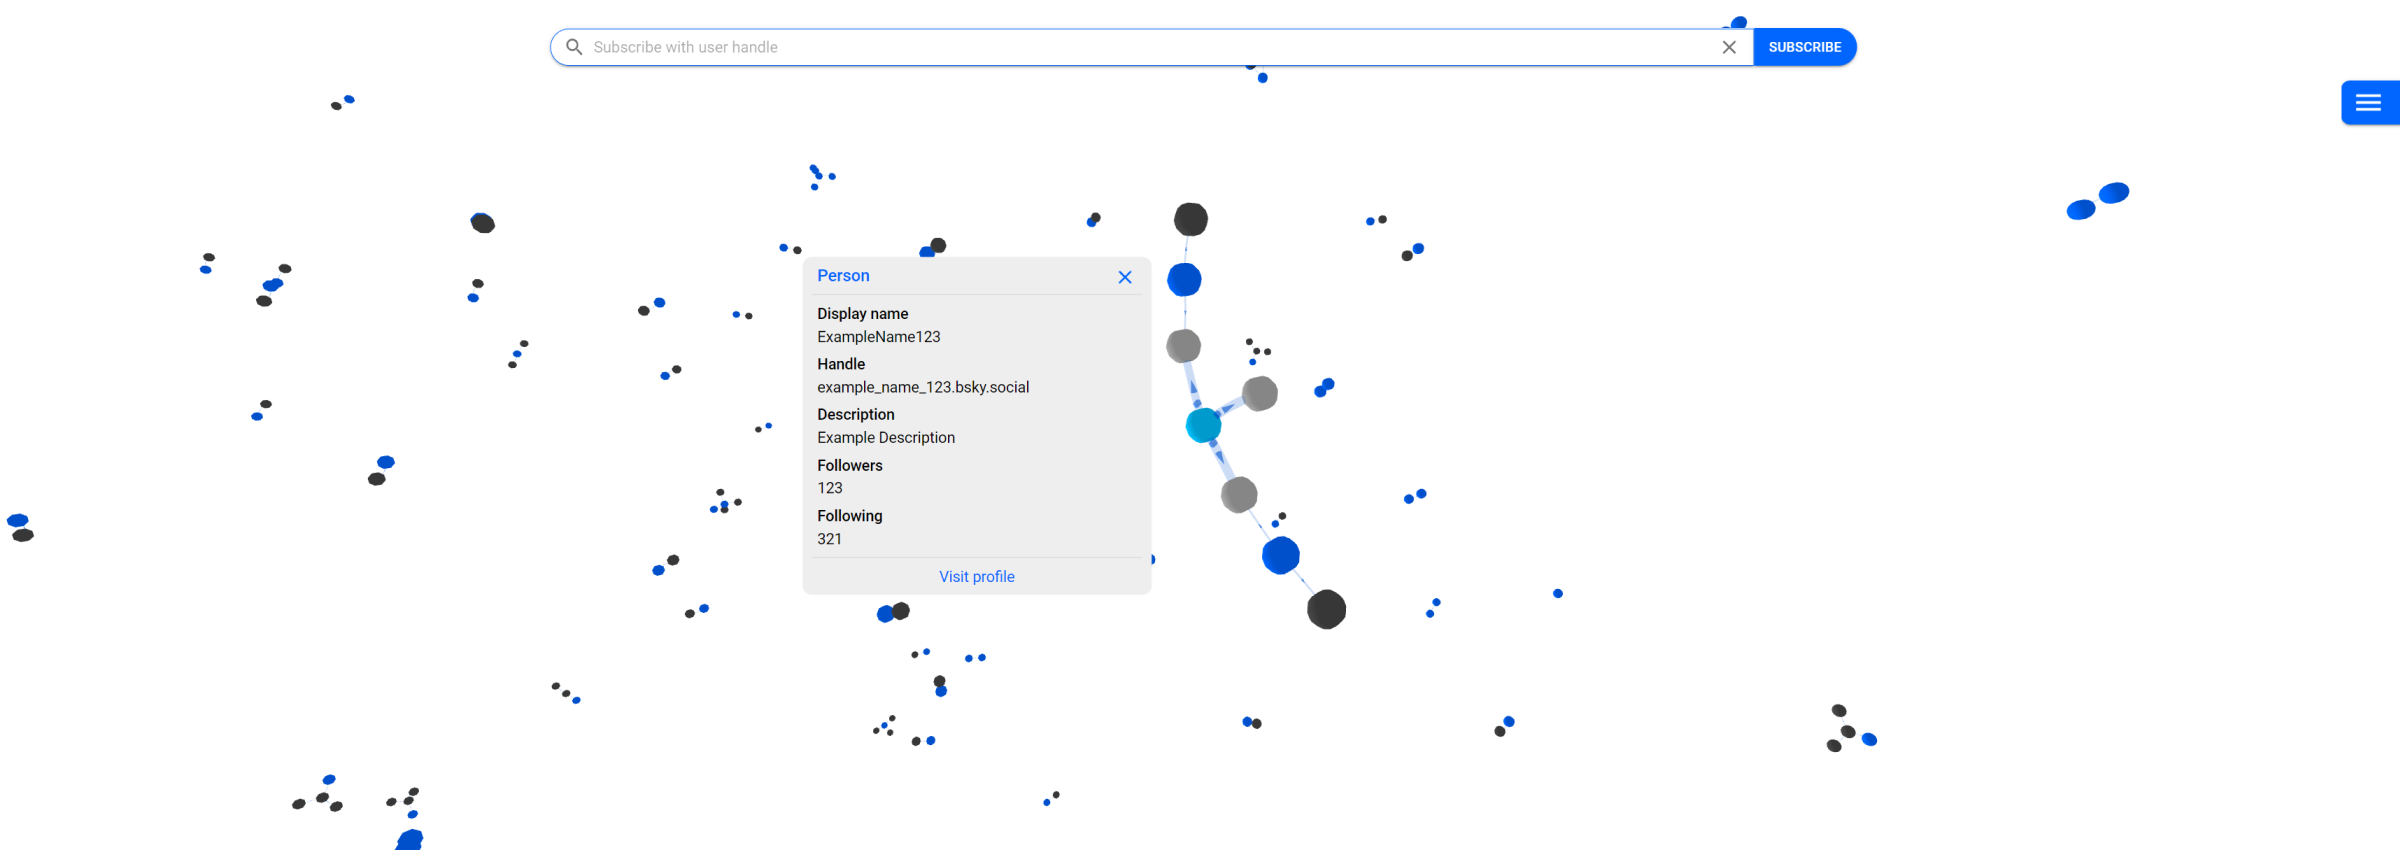
While viewing the basic visualization is a great way to get a feeling about current activity on Bluesky, it doesn’t show you much information about specific nodes. If you want to find out more about a desired node, you can simply click on it. The visualization will then focus on the node, pause all other animations, and display a more detailed description of the node to the left of it. For example, if you click on a node representing a person, you will see information such as the person’s Bluesky handle, username, and description. Clicking or hovering over a node will also change its coloring - both the focused node and all its neighbors will be colored differently to represent the change of focus.
Subscribing to certain users using Bluesky handles
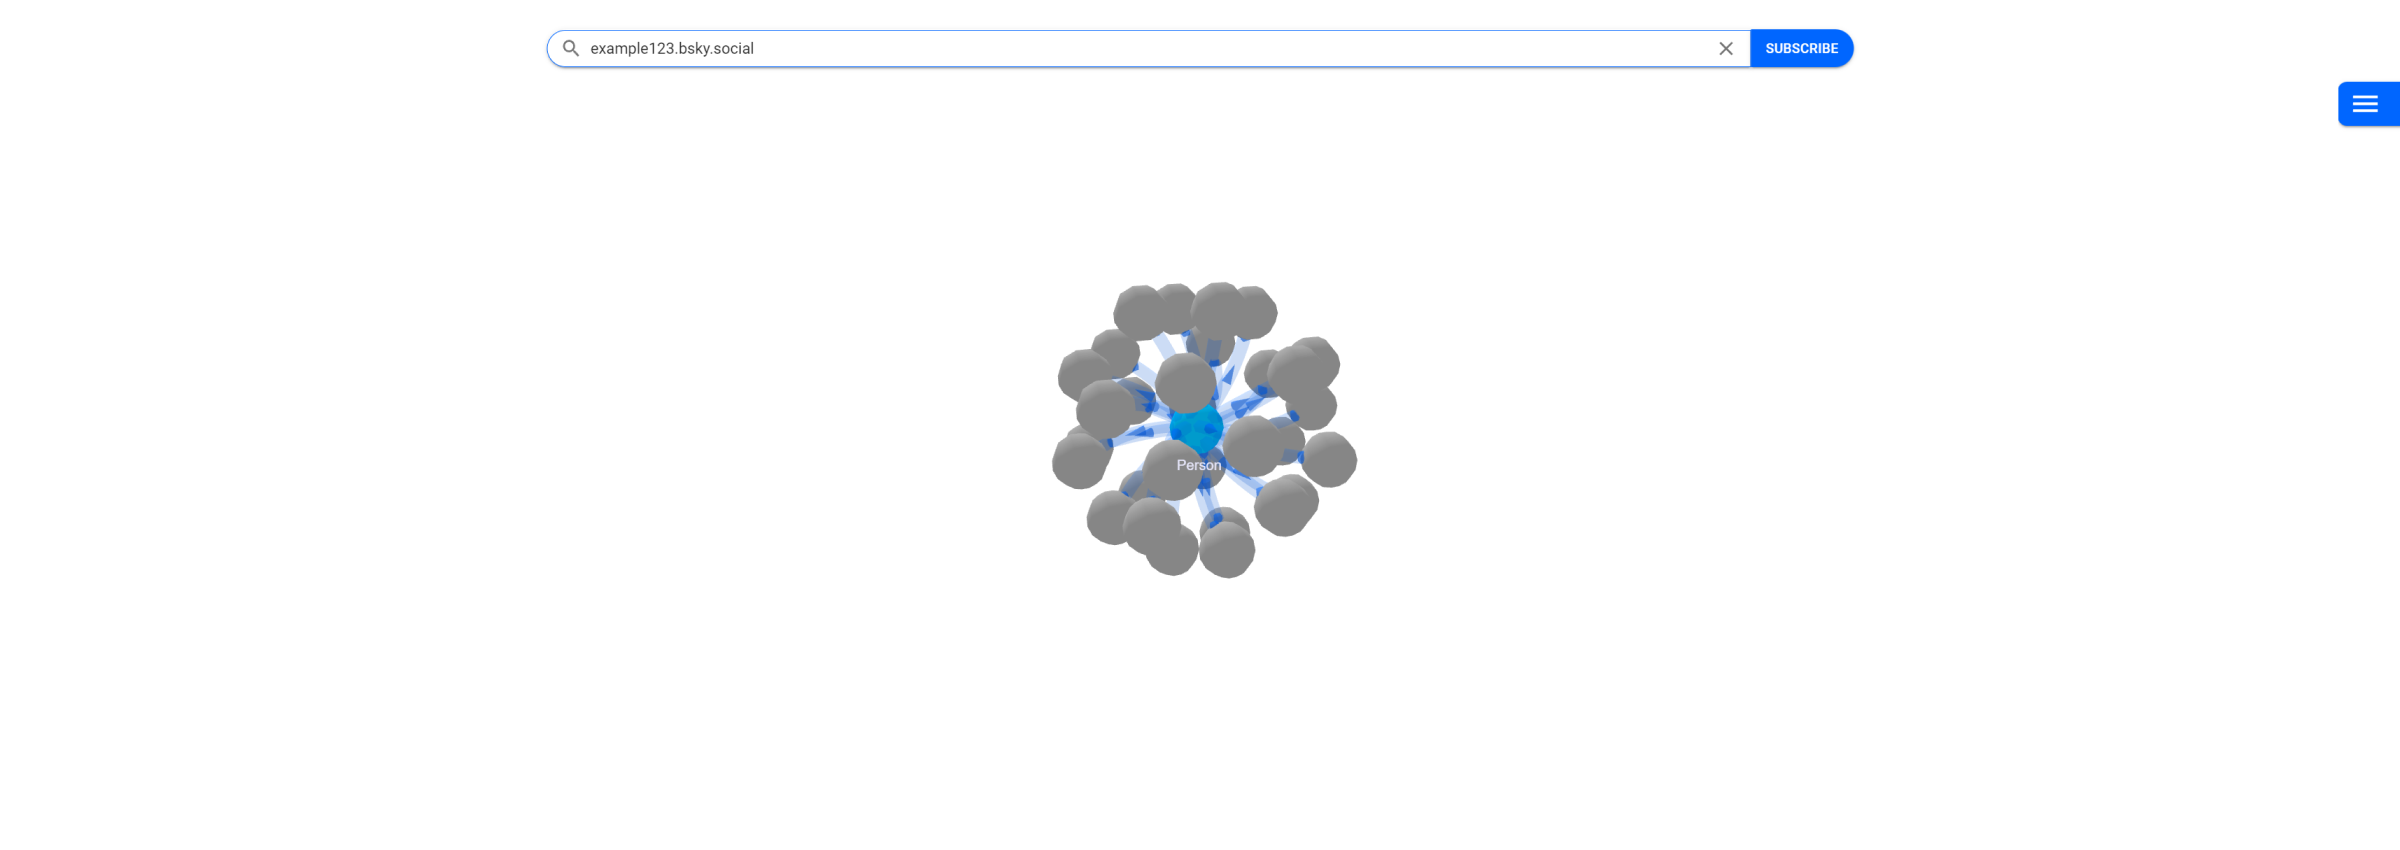
If you look at the top center of the visualization, you can see a subscribe bar. By typing a desired Bluesky user handle and clicking on the subscribe button, you can keep track of the upcoming activity of that user, as well as the most active people he is following. If you type in a user handle that doesn’t exist, the visualization will not show any activity. You can then use the clear button (represented with an x sign) to get back to the default visualization showing unfiltered activity.
Additional features
Besides the basic features described in the last few sections, the visualization also offers some performance options to help provide you with a smooth data visualization experience. If you click on the hamburger button on the right side of the visualization, a menu will appear. Currently, it offers four performance options that can be changed as you please.
If you think there are too many or too few nodes on the screen, you can change the maximum number of displayed nodes. Other than that, you can also disable click-and-hover animations or disable node and relationship coloring. The final option lets you switch between a 3D and a 2D graph visualization.
How it was created
Creating this visualization tool was an awesome journey. To give you a better understanding of how such a project is brought to life, we’ve decided to go into more detail about the process itself. If you aren’t interested in such technical details, you can skip this section and move on to the final part of the post.
Application architecture
Application architecture is a term used to describe how different parts of an application interact with each other. Having a clear understanding of how an application will be structured is a vital step in the process of developing functional software. The tool used for Bluesky data visualization consists of multiple parts working together to give you the optimal experience. If you’re more interested in a short visual description of the application architecture, we suggest skipping the next section and moving on to the image below.
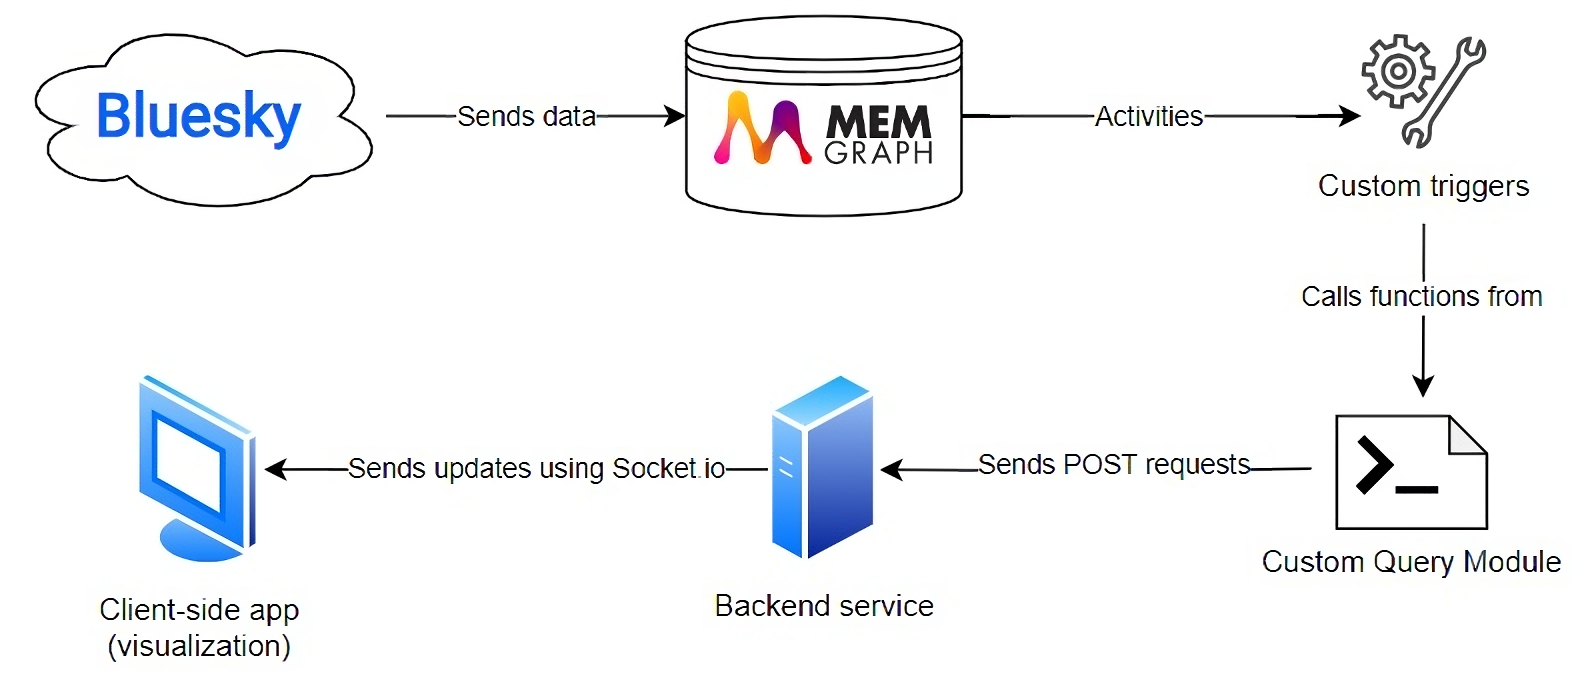
For you to be able to use the visualization tool, Bluesky updates, such as new posts, follows, and likes, have to be sent and stored in a graph database powered by Memgraph. Luckily, Memgraph’s custom feed project called BlueJ does just that! With triggers and a custom query module, all Bluesky updates get sent as HTTP POST requests to the backend service. To connect the backend service with the client-side application you see in your browser, we used Socket.IO. If you’re not familiar with any of the terms mentioned above, don’t worry. We will go into more detail in the following few sections.
Client-side application
The visualization tool you can see in your browser was created with React. React is a JavaScript library used for creating efficient dynamic user interfaces. To make development easier, React introduces components - small pieces of code, each representing a piece of the user interface. Every component can be developed independently and then later combined with others. To create this tool, we used components from react-force-graph. If you want to enrich your application with graph components, check it out!
Backend service
Features such as handling user subscriptions, filtering incoming data, and querying the graph database cannot be done efficiently by the client-side application. Because of that, we’ve created a backend service based on Express. Express is a JavaScript framework that provides many methods for handling HTTP requests, as well as middleware that can enrich your application. With it, you can easily create APIs and robust web applications.
Subscription module
BlueJ, Memgraph's custom feed project, includes a subscription module that stores updates from Bluesky to a graph database. For this visualization tool to show all kinds of updates, such as unfollows and deletes of likes, we enhanced the subscription module. Because of that, the Home+ custom feed should also work better by correctly removing unliked posts and more from the user's custom feed!
Database expansion
Unfortunately, Bluesky doesn’t send much information about users participating in certain activities. Since the visualization tool needs to show additional information about nodes, be it nodes representing posts or people, we needed a way to expand the database used by both the Home+ custom feed and the visualization tool. For that, we created a new script that can be run separately to expand the database with more information about Bluesky users, such as usernames, descriptions, etc.
To achieve backward compatibility with the existing database filled with lots of real-time data from Bluesky, we created a second script that enables correct tracking of unfollows and deletes of likes for people and posts whose information was in the database before the update of the subscription module.
Connecting the parts
While each of the previously described parts has its features, they aren’t useful by themselves. Instead, they have to be connected to form a fully functioning application. Once BlueJ gets information about new activity on Bluesky, it sends that information to the graph database using Cypher queries. If you aren’t familiar with Cypher, you can learn more about it on Memgraph’s documentation page, but it isn’t necessary to understand this section.
Once data is stored or updated in the graph database, triggers are activated. Triggers are small pieces of procedural code that get automatically executed in response to events such as the creation of new posts, people following others, and more. In our case, triggers call query module functions that send HTTP POST requests to the backend service. Query modules extend the query language with new functionality often related to graph algorithms. You can write your custom query modules using C, C++, Python, or Rust.
After receiving POST requests, the backend service sends updates to the client-side application using Socket.IO. Now, Socket.IO is a library that provides fast, bidirectional, and event-based communication. Without it, features such as subscribing to a user handle, as well as getting real-time updates in general, would have a much higher latency. Finally, the client-side application you see in your browser shows real-time updates as nodes and relationships, thanks to all previously described parts working together.
Final thoughts
These days, we’re surrounded by tons of information. Trying to make sense of it and connecting different pieces can be a daunting task. Luckily, tools such as the new real-time graph visualization of Bluesky can help you do just that! With features such as subscribing to a desired user and getting more information about nodes, we hope this tool helps visualize how different people interact with each other on social networks. Without graphs and graph databases, this task would be much more difficult.
Of course, since the project is open-source, anyone can contribute to make it even better! We would love to hear from you, so if you have any questions or features you think would be a great addition to this visualization, feel free to check out the project’s repository. And if you like it, perhaps even give it a star.