What Is Real-Time Graph Analytics?
As a powerful technology used to analyze relationships in complex data, graph analytics is consistently gaining momentum because of the need for more efficient data processing.
Real-time graph analytics combines streaming data technology, graph databases, and graph algorithms to tackle problems not suited for relational databases and batch processing. It works best for complex social network analysis, fraud detection in large systems with big data, and recommendation engines for social media and e-commerce platforms.
Let's start with real-time analytics
Real-time analytics is the process of preparing and measuring data as it arrives in the system and offers low response times that can deal with large amounts of data with high velocity. It can answer queries within seconds, enabling data scientists to understand complex relationships, automate processes, and make predictions immediately.
There are a lot of data types businesses analyze in real-time. The most common examples include the following:
- Customer relationship management (CRM) data: customer-related personal information, demographic and psychographic data, number of purchases, and general interest cues.
- Enterprise resource management (ERP) data: Transactional data, analytical data, master data.
- Third-party SaaS vendors' or solution providers' data: Account balance and transaction.
- Website and application data: Web pages, number of users, bounce rate, and top traffic source.
- Customer support system data: Customer's ticket type, satisfaction level, and personal information.
A little bit about graph databases
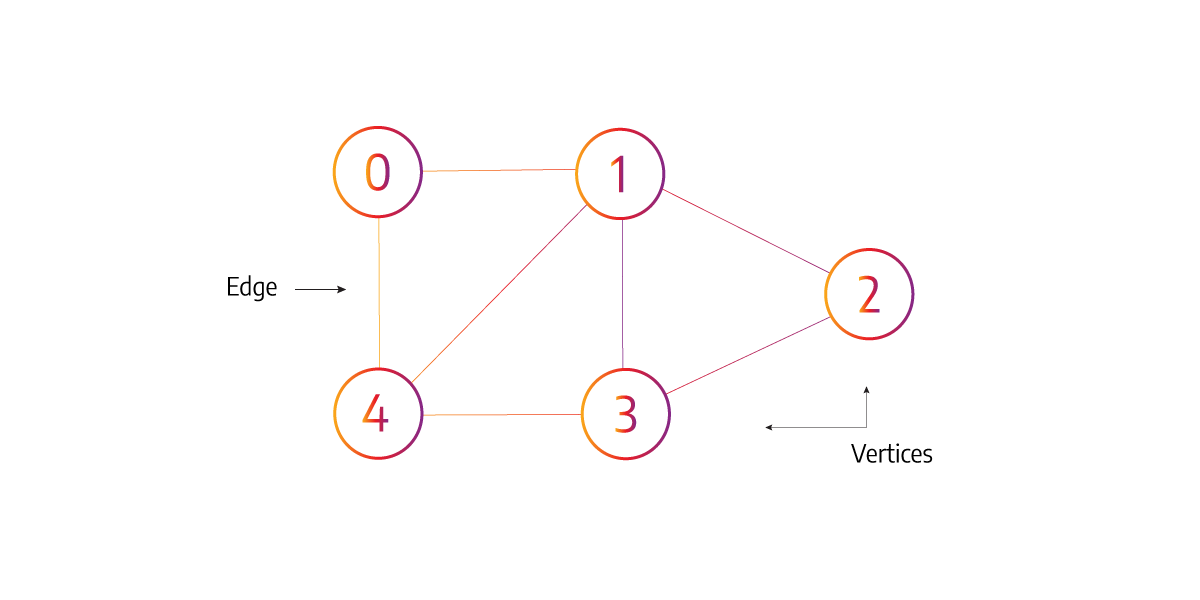
In graph databases, complex relationships between nodes are represented by graph models. Users can apply machine learning algorithms and other statistical techniques to these models, allowing for more efficient data analysis at scale across large volumes of specific data types. When it comes to graph analytics, we use graph algorithms that look at the distances between two nodes (or more), and perform path analysis and clustering of the nodes. To assist in evaluating the importance of the nodes, the algorithms will frequently check incoming edges and the relevance of adjacent two nodes.
Graph algorithms are employed to model data connections, and they allow for querying and data analytics, taking those relationships into account. To illustrate, a property graph is made up of nodes that hold specific information about a subject, as well as edges that show how the nodes are related.
Graph databases explicitly capture the relationship between data points, allowing the various algorithms (pathfinding, community detection, etc.) and queries to run in milliseconds compared to the previous several hours (in the case of relational databases and relational database management systems).
Challenges in graph analytics
As beneficial as it sounds for many industries, graph analytics has its challenges you should be aware of from an early stage. Below are mentioned several of them:
Data volume
One of the key challenges of real-time graph analytics is the sheer volume of data that needs to be processed. In order to analyze data in real time, it is necessary to have a highly scalable and performant infrastructure that can handle large volumes of data and process it quickly.
The complexity of graph algorithms
Another challenge is the complexity of graph algorithms. Real-time graph analytics requires highly specialized knowledge and expertise in graph algorithms and data structures. This can make it difficult to find qualified experts who can implement and maintain real-time graph analytics systems.
Graph data formats
Another challenge is the lack of standardization in graph data formats and storage systems. Graph data can be stored in a variety of formats, including XML, JSON, and RDF, and there is no single standard for how this data should be stored or accessed. This can make it difficult to integrate data from different sources and develop applications that can work with multiple types of graph data.
Organizational setup
In addition to these technical challenges, there are also organizational challenges that organizations must overcome in order to successfully implement graph analytics. For example, many organizations may not have the expertise or resources needed to develop and maintain a graph analytics infrastructure. This can make it difficult to attract and retain skilled data scientists and engineers who can implement and maintain these systems.
Cultural challenges
Another cultural challenge is the resistance to change that can often accompany the implementation of new technologies. Graph analytics requires a different mindset and approach to data analysis than traditional methods, and organizations may need to overcome cultural barriers in order to embrace graph analytics fully.
Despite these challenges, real-time graph analytics has become an essential tool for many organizations that need to monitor complex networks of data in real time.
Use cases for real-time graph analytics market
Real-time graph analytics can help turn data into insights immediately after it's collected.
Real-time analytics in e-commerce
E-commerce businesses are using real-time analytics to personalize the user experience and boost the number of sales. They utilize specific techniques to assess the user's activity over the last five minutes. Based on the analysis, e-commerce websites recommend the items to the buyers that they have been looking for. Ritual, a health tech company, generated a huge number of sales from the new product lines by implementing personalized banner ads, targeted bundled offers, and email campaigns.
Social network analysis
One of the most well-known use cases of graph analytics is in social networks. Graph algorithms can be used to analyze social media networks, such as Facebook and Twitter, to identify patterns of behavior and cyber threats, aid in fraud detection, and make personalized content recommendations. Graph analytics can also be used in influencer marketing, where organizations can identify key influencers and engage with them to reach a wider audience.
Financial data graph analytics
In the finance industry, graph analytics can be used to detect fraud, analyze risk, and optimize investment portfolios. Additionally, graph algorithms can be utilized to analyze financial transactions and identify patterns that may indicate fraudulent activity.
Some graph database providers can help companies utilize real-time graph analytics to detect and prevent credit card fraud even before the transaction is completed. Graph databases ensure that relationship-oriented queries are conducted in real time; representing a series of credit card transactions as a graph allows for fraud detection before it's too late.
Transportation and supply chain management
In the transportation industry, graph analytics are used to optimize logistics and improve supply chain management. Here, graph algorithms come in to analyze transportation networks and identify the most efficient (shortest path) routes for shipping and delivery. Graphs can also be applied to optimize inventory management and reduce transportation costs.
Patient data analysis
In the healthcare industry, graph analytics can improve patient outcomes by analyzing patient data and identifying patterns that indicate disease risk or treatment efficacy. They can also be introduced to build predictive models to help healthcare providers make more informed decisions about patient care.
Wrapping up graph analytics
Overall, graph analytics has a wide range of use cases in many different industries. Its ability to provide insights into complex networks of data has led to many innovative applications that can improve efficiency and reduce costs in the long run. As the volume and complexity of data continue to grow, graph analytics will likely become an even more pivotal tool for organizations looking to make data-driven decisions.
