Graphs Databases Are the Future for Network Resource Optimization
Networks could be considered one of the easiest concepts for humans to understand. In school, teachers encourage drawing networks on a certain subject, making everything accessible at first glance. Memorizing patterns is easier than reading a textbook with highlighted facts. When designing sketches of processing jobs that need to be carried out, we draw jobs as nodes and connections between them as relationships that signify precedence of execution. If networks are a concept that’s easy to understand and handle, how come the following industries, which resources are networks in their nature, are managed badly? Here are a few examples.
In cloud computing, the network of provisioned resources with vast numbers of inputs and outputs (i.e., databases, cloud storage, server instances, etc.) is often over-provisioned due to the dynamic demand of processing power during the day. One study shows that over 84% of companies use over-provisioned cloud resources, which is a staggering amount.
Chemical plants are also affected by various costly optimizations, and in need of improving the chemical topology (i.e., addition or removal of plant components in the network), a thorough impact analysis with minimal risk needs to be conducted. In many chemical engineering companies, this is still done without reliable software tools to perform network analysis on the topology.
In supply chain management, a network of process steps is drawn to minimize the time of product delivery from production to shipping. Up to this day, optimizations in process steps are mostly carried out by staff members, who can be prone to errors and under-optimized solutions. Moreover, it takes them a good amount of time to design an optimal schedule when in fact, they could have been utilized for processes that require more expertise and knowledge with an automated process scheduling the supply chain.
In telecommunications and power grid systems, networks are often affected by power outages due to disconnection between neighbouring components. If the outage happens in a critical place (e.g., an airport), it could mean millions of losses for the business. To make sure power outages are prevented, a system of redundant components can be built to guarantee high availability of power. However, the process is more expensive, and some companies are willing to take that risk. What are the alternatives to make sure the probability of these events is dropped to a minimum?
All these industries and the different problems that arrive with them have one thing in common - their structure of main entities is a network and its data should be represented and analyzed like one. But, more often than not, inadequate tools and solutions are used for their management, such as relational databases. In this article, we will take a look at why relational databases are unequipped to handle these use cases as opposed to graph databases that, thanks to the natural representation of data as a network, handle network analytics and solve the above-mentioned problems with ease.
The issue with relational databases
The advances in technology and processing power created a necessity for storage that would store data and information. Relational databases arrived as the first and optimal solution at the time because of their simplicity. With tabular storage, it wasn’t difficult to analyze and aggregate data, and it was well suited for all use cases in all industries. If the database performance degraded, a simple solution was to buy a new, more performant computer.
With the emergence of big data, vertical scaling (upgrading a single machine, adding CPU cores and RAM) became a problem since that kind of scaling is much more expensive than horizontal scaling. What’s even worse, in most cases, it doesn’t effectively optimize the resources. IT experts began to question whether relational databases are the optimal storage for some use cases, and as a result, NoSQL databases were created, with document (e.g. MongoDB), columnar (e.g. Cassandra) and graph storages (e.g. Memgraph).
So, why are relational databases not performant enough for the use cases mentioned in the introduction? Let’s dissect them one by one, keeping in mind that the topology of the data looks like a network when drawn on a piece of paper.
Visualizing the topology takes around a third of the processing time
In the energy network use case, on average, 25 - 35% of processing time is spent on loading the topology in memory and getting it ready for analysis. The numbers are actually quite similar in other industries as well. If looked under the hood, we can see that in relational databases, components are commonly stored in tables, and to join all the components, the database needs to create as many recursive joins as there are hops between the farthest two components in the network. The complexity of one JOIN is O(n log(n)), and the number of recursions can grow up to k, with k being the number of hops from 2 of the most distant components in the topology, which brings us to the big* O *notation of O(k n log(n)).
If we look at the graph below, it shows a much steeper rise in the logarithmic complexity of loading the topology (red line), with respect to the linear complexity (blue). Performance gets worse as the number of components in the network increases.
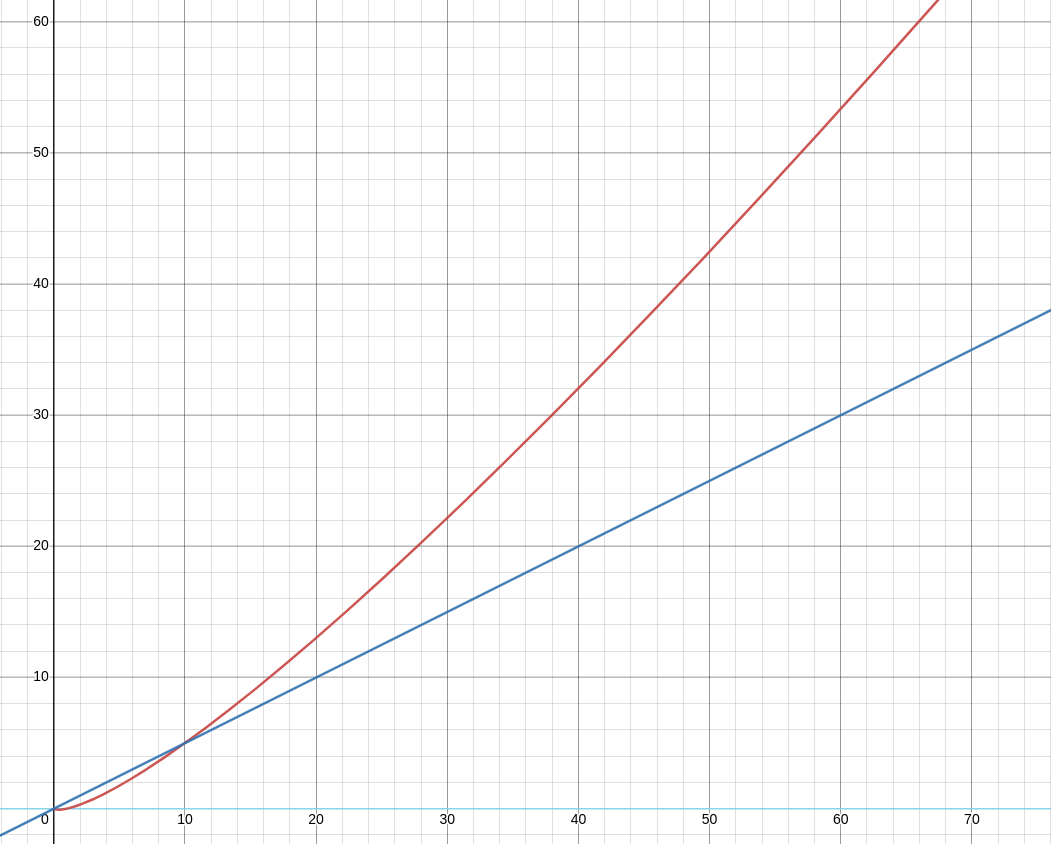
This graph alone shows storing entities as rows on a disk in tabular storage is not optimal for network data such as connected chemical plants, power grids, mobile stations, cloud resources or supply chain pipelines.
Tabular data cannot answer questions related to network analytics
Relational databases were originally developed to retrieve a single piece of information from one point of an application. They are excellent for providing profile information, order information and similar questions that need to fetch one piece of data or combine them with one other piece of information by using a single JOIN. With big data, big aggregation functions were considered a problem, which was solved by transposing rows into columnar storages (Cassandra, Scylla), capable of processing a large number of numerical information at a time and providing statistics for grouped entities.
However, they still come up short when addressing the following questions:
What are the first N jobs in my supply chain that can be executed first to resolve blockers in production? What is the shortest path between 2 of my chemical plant components? If I remove this power grid component, what would be the consequences of removal? Is my graph disconnected, and does that mean there is a network outage? By how much do I need to adjust my resource allocation during the non-busy part of the day, based on the current numbers? What is the topology in my supply chain that yields the maximum production of resources?
Any of these questions translated into SQL would generate an extremely complex query. But most importantly, it would not be an optimized query, as it requires network traversals, as well as identifying dependencies and local neighborhoods of the network components. Network analytics mostly consist of structure analysis and less about analyzing information stored as components’ properties.
Enter graph databases, a natural storage for networks
So why are graph databases optimal for network analysis and resource optimization? The answer lies in their structure. The first class entities of graph databases are nodes (also called vertices) and relationships (also called edges). A correspondent mapping for nodes would be rows in a relational table, whereas relationships would map to foreign keys used for joining the data in tables.
The main conceptual difference is that data is automatically joined as it is stored in the graph database, making sure traversing the graph is done in constant time. The article explains the benefit of having all the data joined from the start. Imagine you have a network of connected components in your chemical plant. It should be quite easy to get information on where the outputs of a chemical reactor go next since you can see its pipes and the component next to it. When using relational databases, the process can be described as going to the central registry in your company (many-to-many table) to check information about the connected components, coming back and realizing that the component connected is actually right next to it. Graphs instantly show the connection.
The time complexity of traversing the whole graph and displaying a network is O(V + E), where V + E is the joined number of nodes and relationships in the graph. It equals the linear complexity (the blue line in the chart above) with respect to number of entities in the graph, which offers much better performance compared to logarithmic complexity of relational databases.
Graph representation of data allows new analytical queries
How can graph storage be utilized for companies' benefits? As a language, SQL was not a good fit for graph databases, so a new query language was designed to manage network traversals - openCypher. Let’s see a few examples of its syntax. Below is a query that returns the whole database:
MATCH (n:Component)-[r]->(m:Component) RETURN n, r, m;In the query,(n:Component) and (m:Component) represent nodes of Component type and [r] is the relationship between them. The language of openCypher is designed to match patterns in the graph, and from there expand to the whole graph or a subgraph. Seems pretty straightforward and without any need for recursions, the SQL would require.
Let’s say that we want to find the shortest path between 2 components in a graph. It can be easily done with:
MATCH p=(n1:Component {id:1})-[r:IS_CONNECTED_TO *wShortest]->(n2:Component {id:2}) RETURN p;The built-in function of graph databases, wShortest, yields the shortest path between 2 components with corresponding IDs. But that’s not the only traversing possibility in a graph database. Many algorithms, such as depth-first search, breadth-first search, and more complex graph algorithms, such as PageRank and Community Detection, were intertwined with the core of graph databases to provide industries with a different kind of analytics that will result in discovering new information and insights.
This draws to the final thought - querying and traversing a network and inferring new knowledge from it should be as easy as thinking about it!
All-in-one tool for your intelligence
Graph database providers have made an effort, not only to make a good representation of storage but also to include various graph algorithms and analytics possibilities, as well as visualization tools. What use is optimal storage if the results are displayed as rows and not rendered as a network in front of you? It’s just an optimal storage, without the ability to clearly see and infer patterns yourself about possible bottlenecks in the graph. Moreover, graph analytics and algorithms could be used in a way to highlight and customize your view of the network to detect problems and solve them with ease.
All this makes graph databases not just a storage but a platform for graph analytics. Questions tied to impact analysis, root cause analysis, dependency analysis, simulation of digital twins, and many more, can now be applied in industries consisting of highly connected network data to infer new intelligence and provide value to the business. It’s also cost-efficient to use only one component, and not a complex system of connected tools.
Conclusion
We have highlighted one of the main reasons why graph databases might be a good fit for your network resource analytics. There is always a tradeoff when migrating your current solution to new technologies, and if your current system is behaving without friction (mostly when having a small dataset), it might be okay to stick to your current tools. As new data arrives and your network becomes more complex and connected, it’s a good time to check out graph databases and ease your life with higher performance and additional analytics!
Memgraph is a graph database platform that offers a full-fledged solution for graph analytics. If you want to know which graph algorithms and extendable analytics are available in Memgraph, check out MAGE library (Memgraph Advanced Graph Extensions) and you can visualize your whole topology using Memgraph’s graph visualization tool Memgraph Lab.