Memgraph vs. Neo4j: A Performance Comparison
This blog post is outdated. For the most current Memgraph benchmarking results, please visit Memgraph benchmarking results.
Over the past few weeks, we have been benchmarking Memgraph 2.4 and Neo4j 5.1 community editions. Graph databases with similar capabilities, but architecturally completely different systems. What distinguishes them the most is that Neo4j is based on the JVM, while Memgraph is written in native C++. To understand both databases' performance limits, we executed a wide variety of concurrent Cypher queries in different combinations.
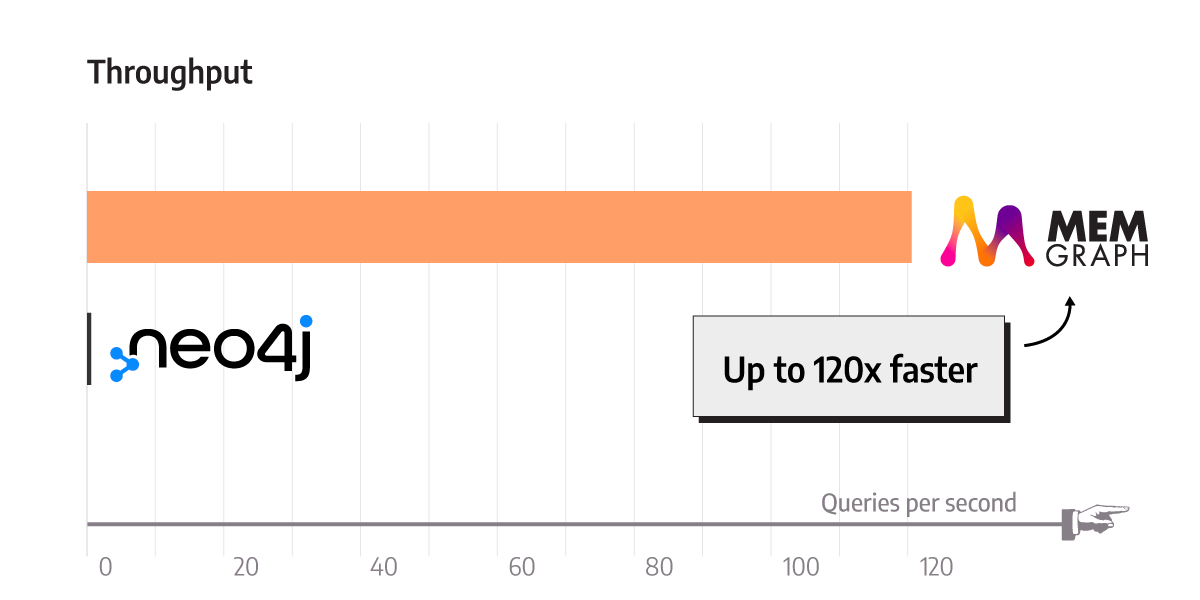
If you prefer a TL;DR, here it is: Memgraph is up to 120 times faster than Neo4j, all while consuming one quarter of the memory and providing snapshot isolation instead of Neo4j’s default of read-committed.
Benchmarking is subtle and must be performed carefully. So, if you are interested in the nuts and bolts of it, see the full benchmark results or dive straight into the methodology or read on for the summary of results between Memgraph and Neo4j.
Keep in mind that results you are about to see in the blog post are based on previous benchmark configurations (v1). So the results currently available on benchgraph are results from latest configuration. This does not mean the results below are invalid, it is just a different benchmark configuration. To understand what has changed, see the methodology changelog or read in the blog post about the latest benchmark configuration.
The raw results from the blog post can be found in the appropriate JSON files in the benchgraph repository. There are summary results for both small and medium Pokec dataset.
Benchmark Overview
In its early stages, mgBench was developed to test and maintain Memgraph performance. Upon changing Memgraph’s code, a performance test is run on CI/CD infrastructure to ensure no degradation. Since we already had a full testing infrastructure in place, we thought it would be interesting to run a performance test on various graph databases. Due to its compatibility, Neo4j was first on the integration list.
Benchmarks are hard to create and often biased, so it’s good practice to understand the benchmark’s main goals and technical details before diving deeper into the results. The primary goal of the benchmark is to measure the performance of any database “out of the box”, that is, without fine-tuning the database. Configuring databases can introduce bias, and we wanted to do a fair comparison.
To run benchmarks, tested systems needed to support the Bolt protocol and the Cypher query language. So, both databases were queried over the Bolt protocol using a low-overhead C++ client, stabilizing and minimizing the measurement overhead. The shared Cypher query language enables executing the same queries on both databases, but as mgBench evolves and more vendors are added to the benchmark, this requirement will be modified.
Performance and memory tests can be run by executing three different workloads:
- Isolated - Concurrent execution of a single type of query.
- Mixed - Concurrent execution of a single type of query mixed with a certain percentage of queries from a designated query group..
- Realistic - Concurrent execution of queries from write, read, update and analyze groups.
In our test, all benchmark workloads were executed on a mid-range HP DL360 G6 server, with a 2 x Intel Xeon X5650 6C12T @ 2.67GHz and 144 GB of 1333 MHz DDR3 memory, running Debian 4.19.
Each workload was executed with 12 concurrent clients querying the database. All results were acquired in both cold and hot run. When performing a hot run, the database was pre-queried before executing any benchmark queries and taking measurements.
To get the full scope of the benchmark’s technical details, take a look at our methodology. It contains details such as queries performed, the benchmark’s limitations and plans for the future. You can also find reproduction steps to validate the results independently.
Results
The whole benchmark executes 23 representative workloads, each consisting of a write, read, update, aggregate or analytical query. Write, read, update, and aggregate queries are fairly simple and deal with nodes and edges properties, while analytical queries are more complex.
The key values mgBench measures are latency, throughput and memory. Each of these measurements is vital when deciding what database to use for a certain use case. The results shown below have been acquired by executing queries on a small dataset on a cold run.
Latency
Latency is easy to measure and is therefore included in almost every benchmark. It’s a base performance metric representing how long a query takes to execute in milliseconds. Query complexity presents an important factor in absolute values of query latency. Therefore, executing complex analytical queries will take more time and latency will be higher, while more straightforward queries will execute faster, thus having lower latency.
The latency of the same queries can vary due to query caching. It is expected that running the same query for the first time will result in a higher latency than on the second run. Because of the variable latency, it is necessary to execute a query several times to approximate its latency better. We pay particular attention to the 99th percentile, representing the latency measurement that 99% of all measurements are faster than. This might sound as though we are focusing on outliers, but in practice it is vital to understand the “tail latency” for any system that you will build reliable systems on top of.
One of the most interesting queries in any graph analytical workload is the expansion or K-hop queries. Expansion queries start from the target node and return all the connected nodes that are a defined number of hops away. Depending on the dataset, expanding several hops away from the target will probably cause the query to touch most of the nodes in the dataset. Expansion queries are data intensive and pose a challenge to databases. In mgBench, there are expansion queries with hops from 1 to 4. Probably the most used expansion query is the one with a single hop. It is an analytical query that is fairly cheap to execute and used a lot:
MATCH (s:User {id: $id})-->(n:User) RETURN n.id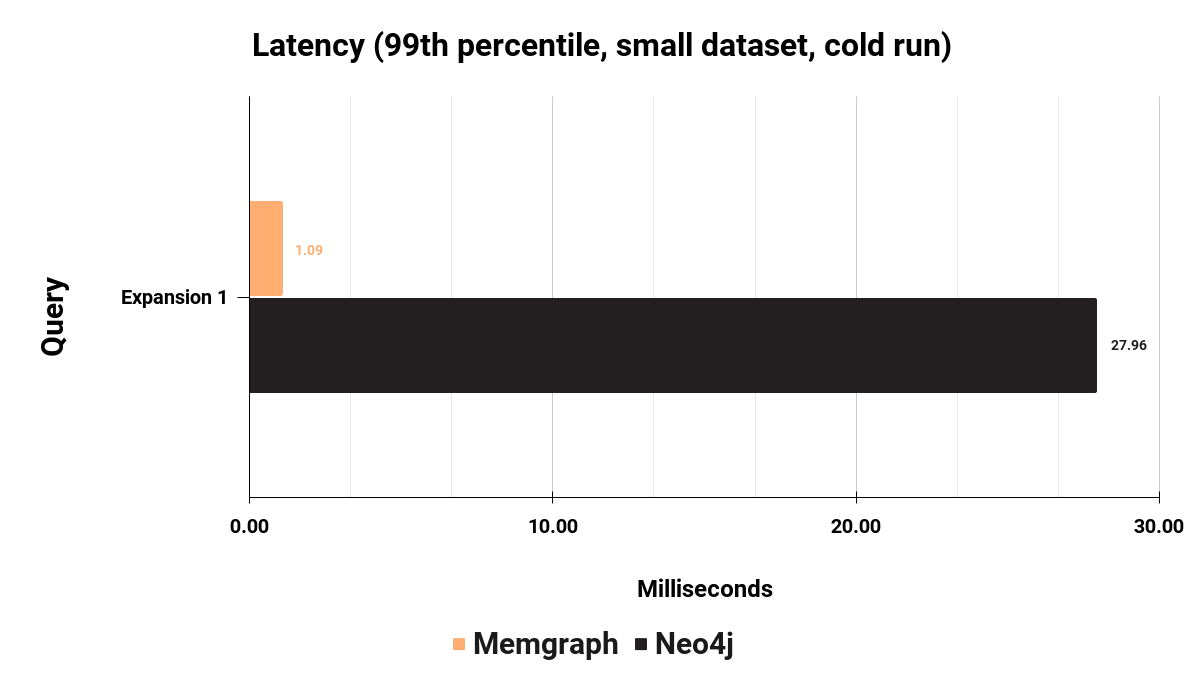
As the bar chart above shows, it takes Memgraph 1.09 milliseconds to execute Expansion 1 query, while it takes Neo4j 27.96 milliseconds. On this particular query, Memgraph is 25 times faster. But this is just one sample on a single query. To get a complete picture of latency performance, here is the latency measured across 23 different queries.
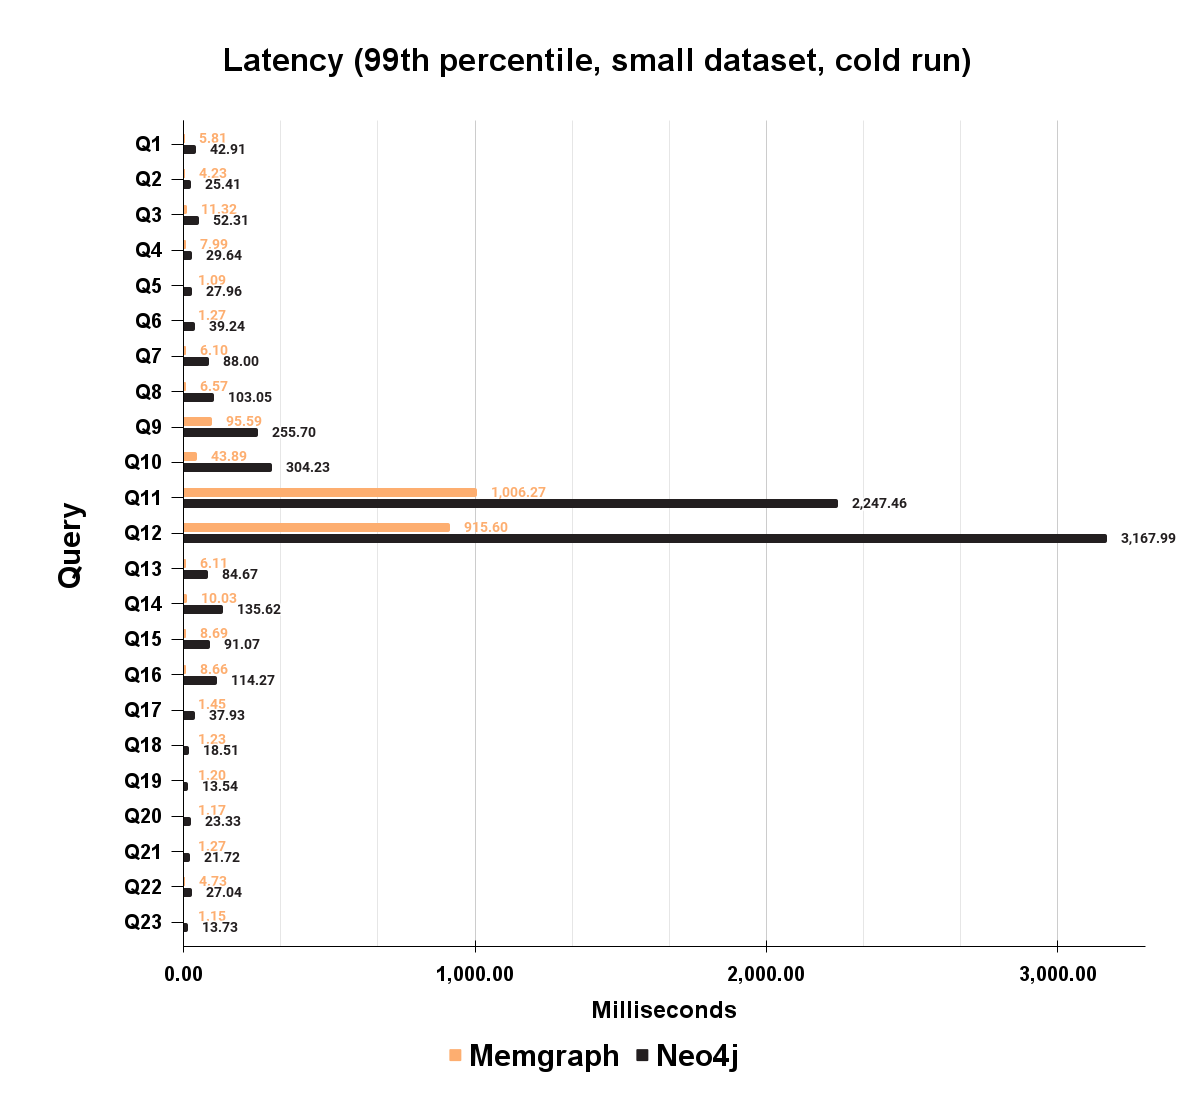
As you can see, Memgraph latency is multiple times lower compared to Neo4j on each of the 23 queries. A full query list is available in the methodology section. In Memgraph, latency ranges from 1.07 milliseconds to one second on a Q11, Expansion 4 query, the most challenging one in mgBench. Neo4j ranges from 13.73 milliseconds to 3.1 seconds. Lower query latency across the board brings a great head start, but it is not the complete picture of the performance difference between databases.
Latency is just an end result that can depend on various things, such as query complexity, database workload, query cache, dataset, query, etc. The database needs to be tested under concurrent load to understand the database performance limits since it imitates the production environment better.
Throughput
Throughput represents how many queries you can execute per fixed time frame, expressed in queries per second (QPS). To measure throughput on an isolated workload, each of the 23 queries is executed in isolation concurrently, a fixed number of times, and divided by the total duration of execution. The number of queries executed depends on query latency. If latency is low, more queries are executed. If latency is high, fewer queries are executed. In this case, the number of executed queries is equivalent to an approximation of 10 seconds worth of single-threaded workload.
More throughput means the database can handle more workload. Let's look at the results of the Expansion 1 query mentioned earlier:
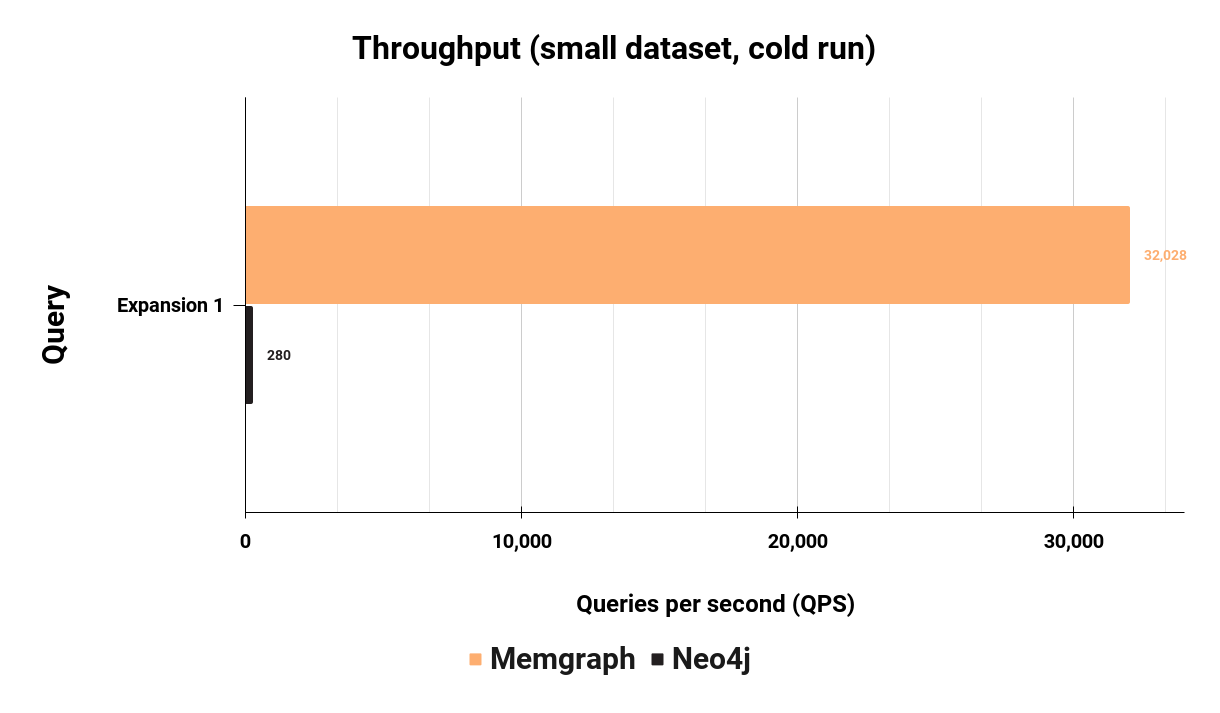
Memgraph has a concurrent throughput of 32,028 queries per second on Expansion 1, while Neo4j can handle 280 queries per second, which means Memgraph is 114 times faster than Neo4j on this query. But again, this is throughput for just one query. Let's look at all 23 queries in an isolated workload:
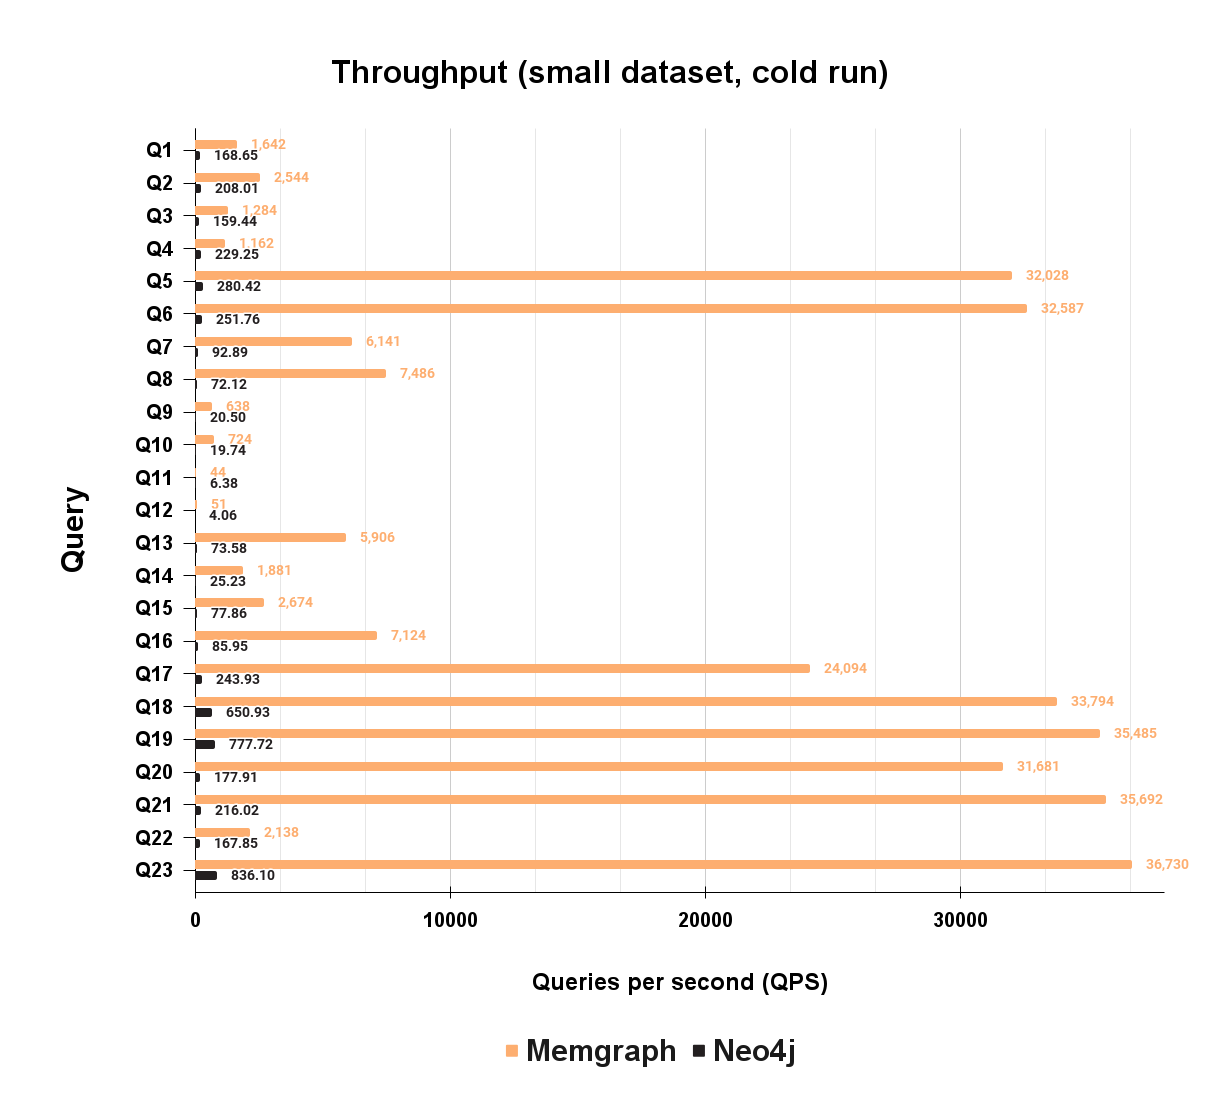
As you can see on the bar chart above, Memgraph has significantly higher throughput on each of the 23 queries. Since the difference in throughput is huge for some queries, it is best to focus on the absolute number for each query. The worst case scenario for Memgraph and the best case scenario for Neo4j is Q4, where Memgraph is “just” 5.1 times faster than Neo4j.
Database latency and throughput can be significantly influenced by result caching. Executing identical queries several times in a row can yield a superficial latency and throughput. In the production environment, the database is constantly executing write and read queries. Writing into a database can trigger the invalidation of the cache. Writing can become a bottleneck for the database and deteriorate latency and throughput.
Measuring throughput while writing into the database will yield a more accurate result that reflects realistic caching behavior while serving mixed workloads. To simulate that scenario, a mixed workload executes a fixed number of queries that read, update, aggregate or analyze the data concurrently with a certain percentage of write queries.
The Expansion 1 query executed before is now concurrently executed mixed with 30% of write queries:
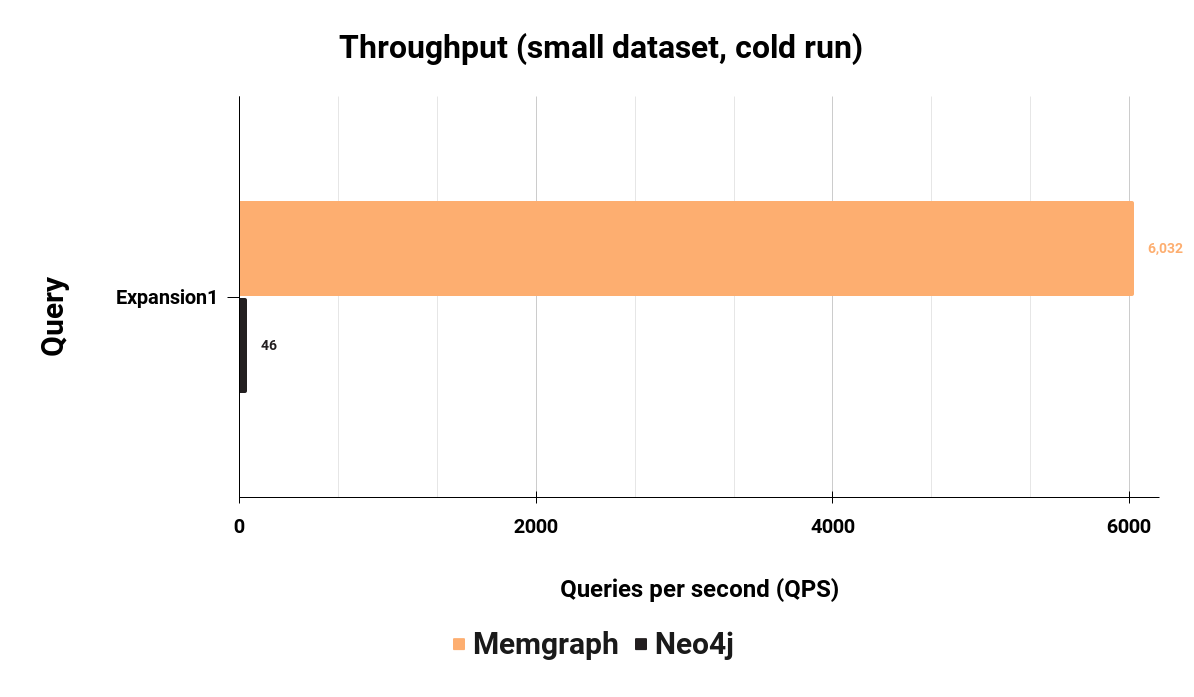
As you can see, Memgraph has maintained its performance in a mixed workload and has a 132 times higher throughput executing a mixed workload than Neo4j. Here are the full throughput results for the mixed workload:
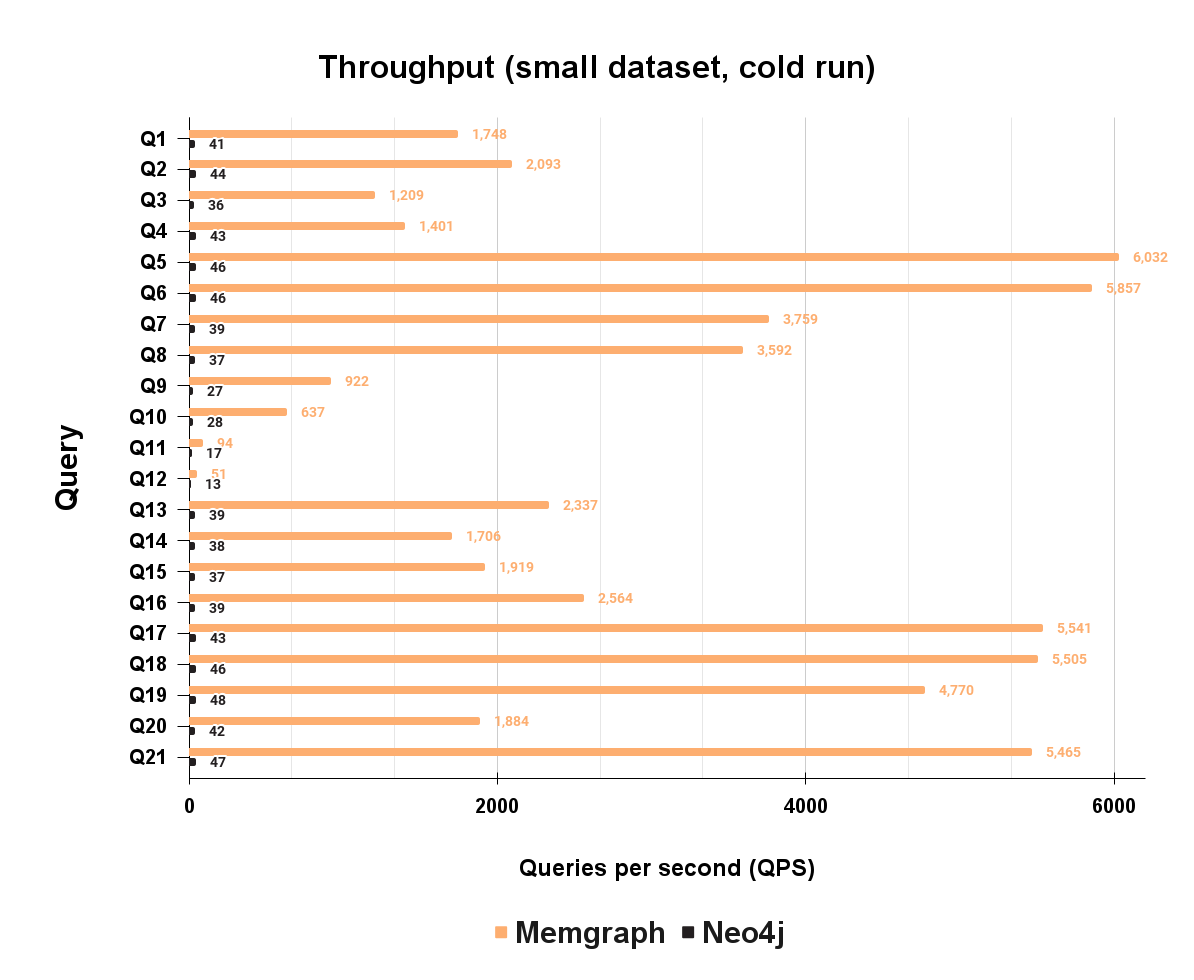
The total mixed workload didn’t impact overall Memgraph's performance, it is still performing very well on each of the 21 queries. Two write queries used for creating mixed workload are not tested, since it would not be mixed workload.
Both isolated and mixed workloads have given a glimpse of the possible production performance of the database, while each of the previous measurements can have limitations. Realistic workload is the most challenging test of database performance. Most of the databases in production execute a wide range of queries that differ in complexity, order, and type. The realistic workload consists of writing, reading, updating, and doing analytical work concurrently on the database. The workload is defined by the percentage of each operation. Each workload is generated non-randomly for each vendor and is identical on each run. Currently, there are 4 realistic workload distributions:
- W1 - 20% Analytical, 40% Read, 10% Update and 30% Write
- W2 - 70 % Read and 30 % Write
- W3 - 50 % Read and 50 % Write
- W4 - 30 % Read and 70 % Write
Take a look at the throughput results for each workload:
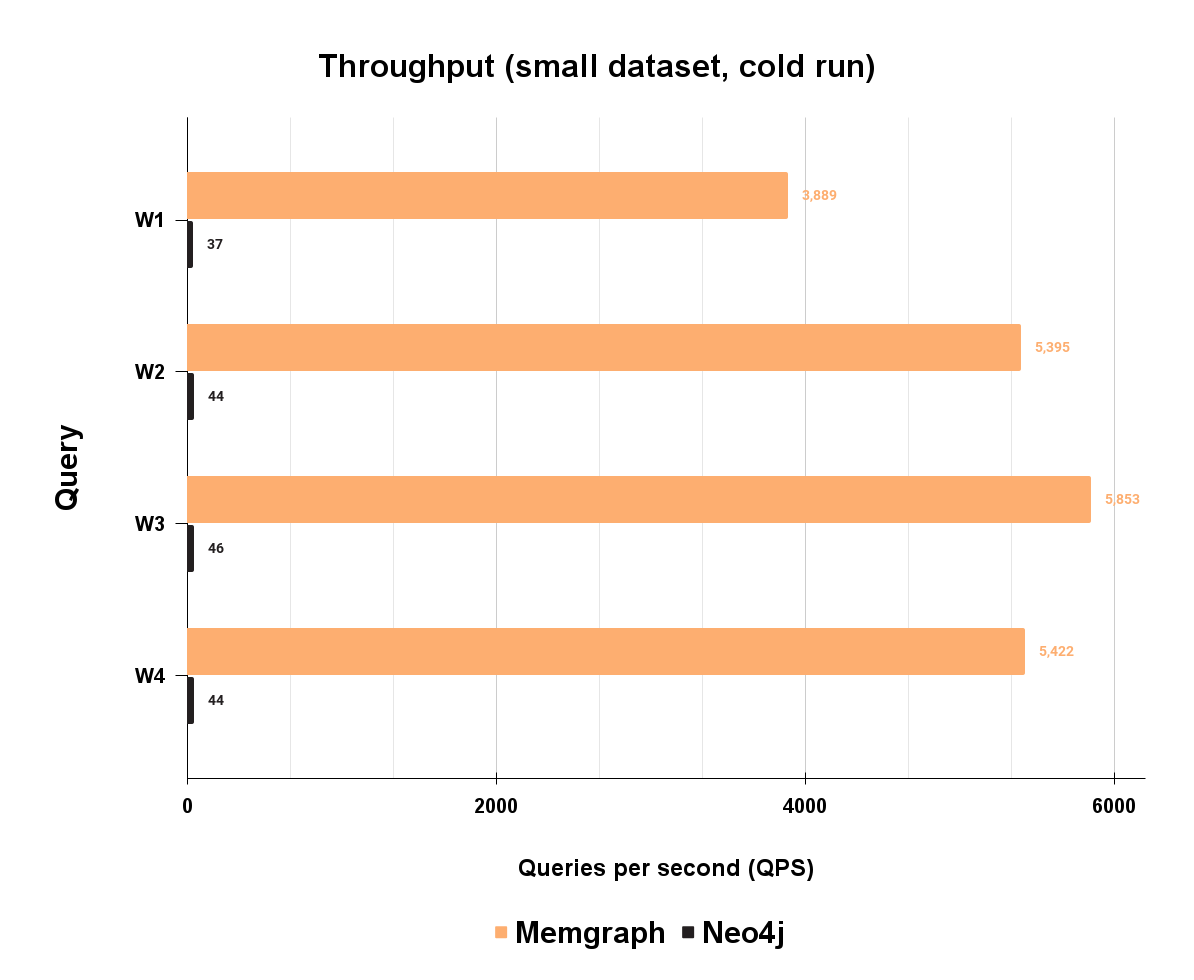
Memgraph performs well on the mixed workload, with 102 times higher throughput on W1, 122 times higher on W2, 125 times higher on W3, and 121 times higher on W4. Overall, Memgraph is approximately 120 times faster than Neo4j.
Memory usage
The performance of the database is one of many factors that define which database is appropriate for which use case. However, memory usage is one of the factors that can really make a difference in choosing a database, as it significantly impacts the cost-to-performance ratio. Memory usage in mgBench is calculated as peak RES (resident size) memory for each query or workload execution. The result includes starting the database, executing the query or workload, and stopping the database. The peak RES is extracted from process PID as VmHVM (peak resident set size) before the process is stopped. Peak memory usage defines the worst-case scenario for a given query or workload, while RAM footprint is lower on average. Since Memgraph is an in-memory graph database, some cost must be attached to that performance. Well, this is where things get interesting. Take a look at the memory usage of realistic workloads:
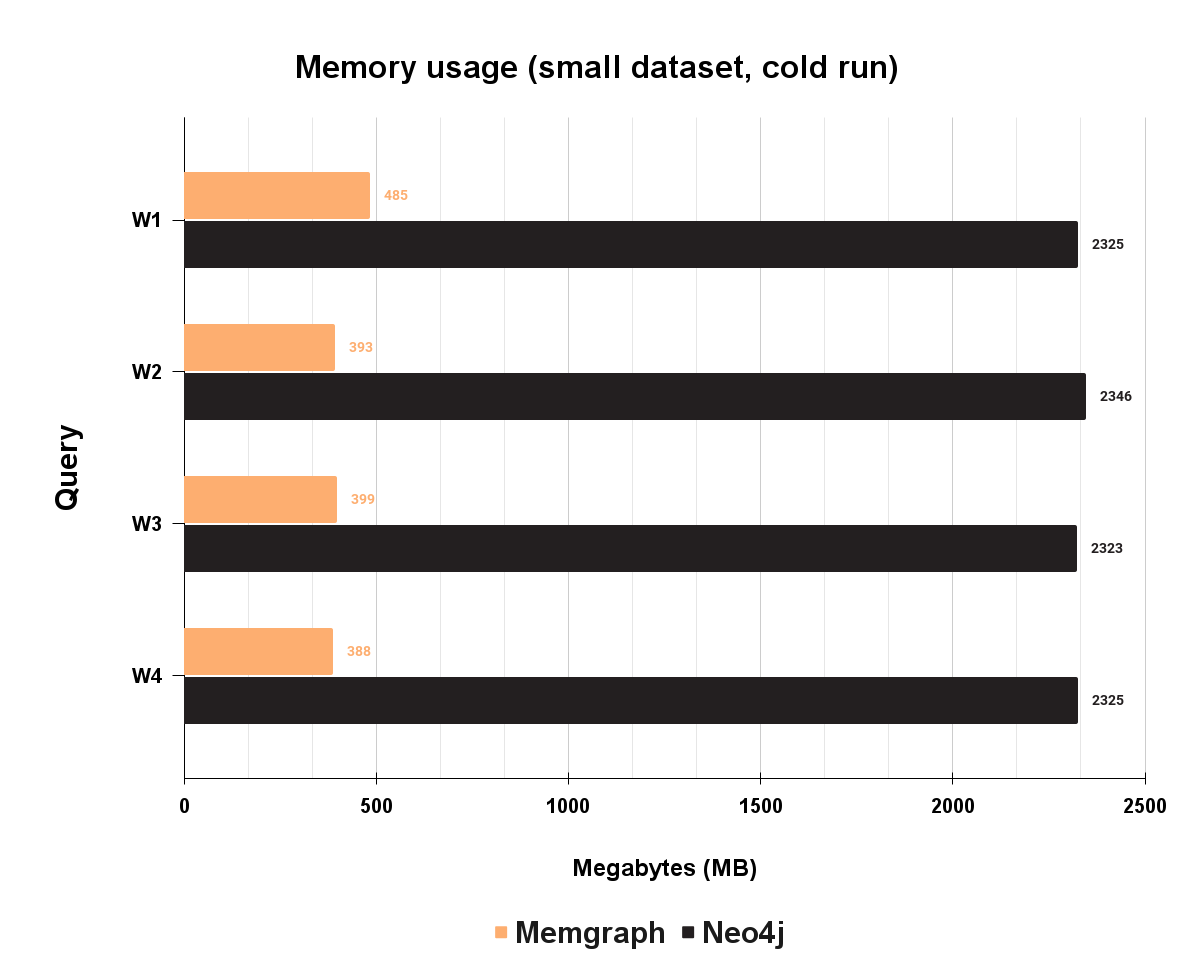
As you can see, Memgraph uses approximately a quarter of the Neo4j memory. Since Neo4j is JVM based, it is paying the price for the JVM overhead.
Consistency
While it is beyond the scope of this blog post to cover the implications of database isolation levels and how weaker isolation levels prevent broad classes of applications from being correctly built on top of them at all, the high-level picture is that Memgraph supports snapshot isolation out of the box, while Neo4j provides a much weaker read-committed isolation level by default. Neo4j does support optional manual locking, but this does not protect all queries by default. In general, it is not practical for most engineers to reason about the subtleties of transaction concurrency control by requiring them to implement their own database locking protocol on top of the application that they are responsible for building and operating.
In practice, this means that a far broader class of applications may be correctly implemented on top of Memgraph out-of-the-box without requiring engineers to understand highly subtle concurrency control semantics. The modern database ecosystem includes many examples of systems that perform extremely well without giving up correctness guarantees from a stronger isolation level, and Memgraph demonstrates that it is simply not necessary to give up the benefits of Snapshot Isolation while achieving great performance for the workloads that we specialize in. In the future we intend to push our correctness guarantees even farther.
Conclusion
As the benchmark shows, Memgraph is performing an order of magnitudes faster in concurrent workload than Neo4j, which can be crucial for running any real-time analytics that relies on getting the correct information exactly when needed.
Benchmark can be found here and all the code used for running these benchmarks is publicly available so if you want to reproduce and validate the results by yourself, you can do it by following the instructions from the methodology. Otherwise, we would love to see what you could do with Memgraph. Take it for a test drive, check out our documentation to understand the nuts and bolts of how it works or read more blogs to see a plethora of use cases using Memgraph. If you have any questions for our engineers or want to interact with other Memgraph users, join the Memgraph Community on Discord!