Benchgraph Backstory: The Untapped Potential
This blog post is outdated. For the most current Memgraph benchmarking results, please visit Memgraph benchmarking results.
A few months ago, we launched Benchgraph, the platform for comparing the performance of graph databases. We tweaked our in-house benchmarking tool a bit and started benchmarking Neo4j since Memgraph is highly compatible with Neo4j. There were definitely things we did right and some others that we did wrong, but after a few months, we decided to update a few things based on community feedback making the overall benchmark much efficient and valuable to the community.
Let’s take a look at the things that have been improved in the benchmark and what has changed.
New bigger datasets
During the run of a typical benchmark, you can run specific queries for a fixed period of time or take a chunk of queries, execute them, and measure elapsed time. Either way, you need a decent amount of queries (same query with different arguments), and for that, you need a bigger dataset. On top of that, testing performance on the more extensive scaled datasets is necessary. To put things into perspective for query requirements, on some of the queries that are being run, the database executes up to 300k queries or less, depending on the query complexity. For a detailed look into statistics, take a look at the benchmark.json file that holds all the results from the benchmarks. There you can see how many specific queries were executed per particular test.
To get back to the point of the bigger dataset, Pokec was an initial dataset that was used for running benchmarks. It is still there, but it is also a bit limited in size; the tests were executed on 100k nodes and 1.7M edges (medium size). So it is not overly large and has quite a simple structure.
Because of the size, complexity, and feedback from the community, we decided to add a larger dataset. So the next dataset should be large, more complex, and recognizable. The choice was easy here; the industry-leading benchmark group Linked Data Benchmark Council (LDBC), which Memgraph is a part of, has open-sourced the datasets for benchmarking. The exact dataset is the social network dataset. It is a synthetically generated dataset representing a social network. It is being used in LDBC audited benchmarks, SNB interactive, and SNB Buissines intelligence benchmarks. Keep in mind that this is NOT an official implementation of an LDBC benchmark, the open-source dataset is being used as a basis for benchmarks, and it will be used for our in-house testing process and improving Memgraph.
The good thing about the LDBC SNB dataset is that it has a specific set of prefix sizes. For example, the SF1 tier of the LDBC SNB dataset has approximately 3M nodes and 17M edges. SF3 is 3 times the size of SF1, with approximately 9M nodes, and 52M edges. The scale sizes go up to SF1000, which is quite a big graph. The test was run on SF1, which is fairly small for the datasets available in the wild, but tests will be executed on the bigger sizes soon (such as SF3 and SF10).
Both LDBC SNB interactive and LDBC SNB business intelligence operate on the schematically same graph, the social network, but it is being generated a bit differently.
More complex queries
Queries used for benchmarking on the Pokec dataset in the first iteration of the Benchgraph were quite general. They did cover most of the basic operations such as aggregations, writes, reads, updates, and graph analytical queries. But overall, the queries were not too complex and provided insight into how good transactional workloads can be in Memgraph and Neo4j. Despite being generic, those queries were picked by us, so again, based on the feedback from the community, more complex queries were added to the Benchgraph.
At first, the plan was to use only the LDBC dataset and write different queries for the dataset, but LDBC has a set of well-designed queries that were specifically prepared to stress the database. Each query targets a special scenario, also called “chock point.” Not to be mistaken, they do not have deep graph traversal doing around 100 hops, but they are definitely more complex than the ones written for the Pokec dataset. There are two sets of queries for the LDBC SNB: interactive and business intelligence. LDBC provides a reference Cypher implementation for both of these queries for Neo4j. We took those queries, tweaked the data types, and made the queries work on Memgraph. Again, to be perfectly clear, this is NOT an official implementation of an LDBC Benchmark; this goes for both interactive and business intelligence queries. The queries were used as the basis for running the benchmark.
Update to the benchmark procedure
The dataset and queries were not the only things that received an update. The process of running benchmarks has been updated, and the full technical details can be found in the methodology. However apart from that, here is a short overview of what has changed.
Tests on multiple concurrent clients
Running a database in production environments does not mean you will execute queries in isolation with a single connection to the database. The database can be used by multiple users and applications, which means it will have multiple connections concurrently. During that connection period, they would query the database system, and the database would need to respond to all the queries hitting them as fast as possible. Obviously, there will be noticeable differences in running this test on multiple worker threads. To test this, the tests were executed by using different numbers of worker threads that simulate that scenario; going to the Benchgraph, you will see the option Number of workers.
As you can see, the test is currently executed on 12, 24, and 48 worker threads. In the last iteration, the tests were run by using only 12 threads. But this will change in the future, and the number of workers will probably increase even further to show different levels of performance.
New volcanic warm-up
One of the things we did notice in the first run of the Benchgraph is that Neo4j benefits a lot when identical queries are being executed multiple times. We were not aware of the extent to which Neo4j can benefit from it. Although being an excellent database feature, it comes with a few downsides, but more on that later. There were previously cold and hot database conditions, as described in the methodology, but now, vulcanic is introduced.
In the Vulcanic database warm-up, the bulk of workload queries are executed first as a warm-up, and after that, all the queries are re-running it again. The second run is where the results are collected. This adds a bit of clarity on potential Neo4j performance. Keep in mind that volcanic warm-up tests database caching performance. Vulcanic warm-up is not applicable to the highly volatile dataset, which has a tendency to change drastically on a daily basis.
Hardware
As in the previous iteration, the tests were executed on identical hardware for both Memgraph and Neo4j. Due to the fact that our Intel HP server is a bit dusty and has a few years on its transistors the tests were executed on a newer AMD platform. There is a plan to expand this a bit further, potentially to AWS instances, since these things are standardized and people use them these days to deploy most of the applications.
Running configuration changes
There have been a few changes in the running setup. The first and obvious one is that database versions are bumped up: the database version, community editions Neo4j 5.6, and Memgraph 2.7.
Due to Neo4j's different architecture (on disk, while Memgraph being in-memory), Neo4j needs a lot more time to warm up and to record better slower performance on the smaller number of queries executed. Hence, the duration has increased for each test. Since a predefined set of queries for running a benchmark is generated before the test, the actual number of predefined queries has increased from 3 times to 10 times. On top of that, the previously mentioned vulcanic run was introduced to show the performance of repeated execution.
For the isolated workload, the flag that defines the duration of execution --single-threaded-runtime was set to 30 seconds (previously, it was 10 seconds). The lower bound for query execution was raised from 30 to 300 queries. This means that for slowest queries that took a few seconds to execute, at least 300 of those are being executed per test. Also, now each of the vendors executes an identical number of queries for each test.
For the mixed and realistic workloads, the number of executed queries has been bumped up from 100 to 500. Also, Memgraph got a label index in the Pokec dataset since those are not set automatically by Memgraph.
The exact running configuration and the rest of the details can be found in the methodology mentioned earlier.
Results
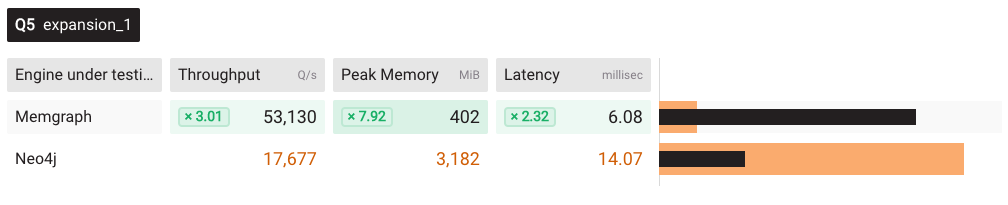
Let’s take a look at the Pokec dataset. For each of the results below, you can visit here. Or if you select: INTEL, cold run, 12 workers, pokec, medium dataset, isolated workload, and go to detailed results for Q5, you will see this:
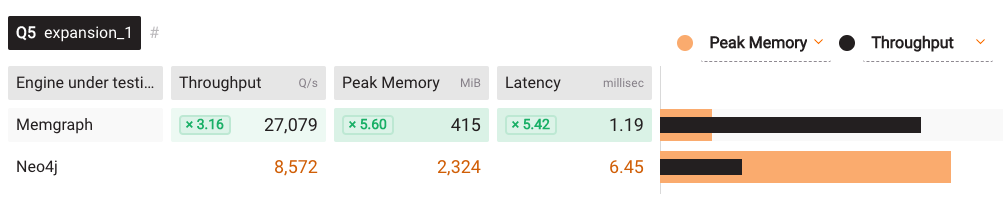
This expansion 1 query has been executed 170996 times (this is visible in raw JSON results) on both vendors with identical arguments. During the test, three main metrics were measured: peak memory, throughput, and latency. In the previous iteration of the benchmark, it was dynamically decided to execute a predefined number of queries based on the duration, which resulted in different query counts for Memgraph and Neo4j, but this is not the case anymore. After 170996 queries, Memgraph proves to be faster 3.16 times faster and has a 5.42 times lower p99 latency. This is a simple single-hop query used quite often in graph analytical workloads.
Trying out these 170996 queries on 48 threads, the following results were measured:
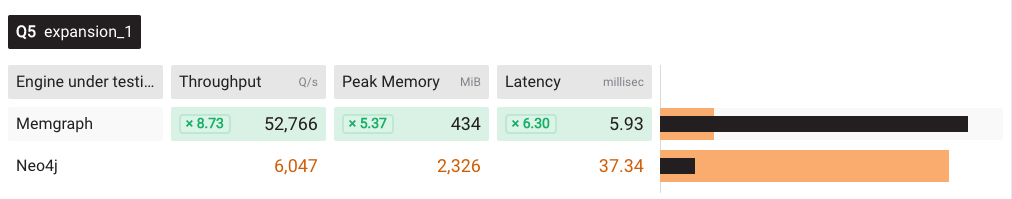
Memgraph’s performance easily doubled with 48 threads, while Neo4j’s performance got worse. It looks like the Neo4j community edition has some multithreaded limits. P99 latency value has increased for both, which is a bit expected, but Memgraph is 8.73 times faster in this concurrent workload.
Moving back now to the new Vulcanic run, and back to 12 threads, the 170966 queries were executed, and after that, the same set of 170966 queries was executed to get the measurement.
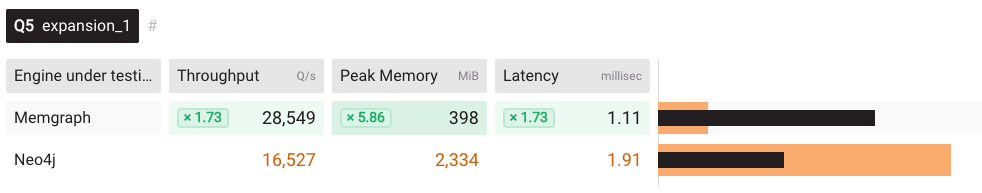
Again, Neo4j improves on the stronger warm-up setting. Though it can be seen that p99 latency has dropped from 6.45 to 1.91 in Neo4j’s case.So, Memgraph is the stable one here.
The image below is again a vulcanic run, but this time under 48 threads.
Even in the vulcanic run, where identical queries have been executed twice, Memgraph proved to be 3 times faster than Neo4j on 48 concurrent threads. Takeaways: the Memgraph community edition can handle the concurrent workloads better than the Neo4j community edition.
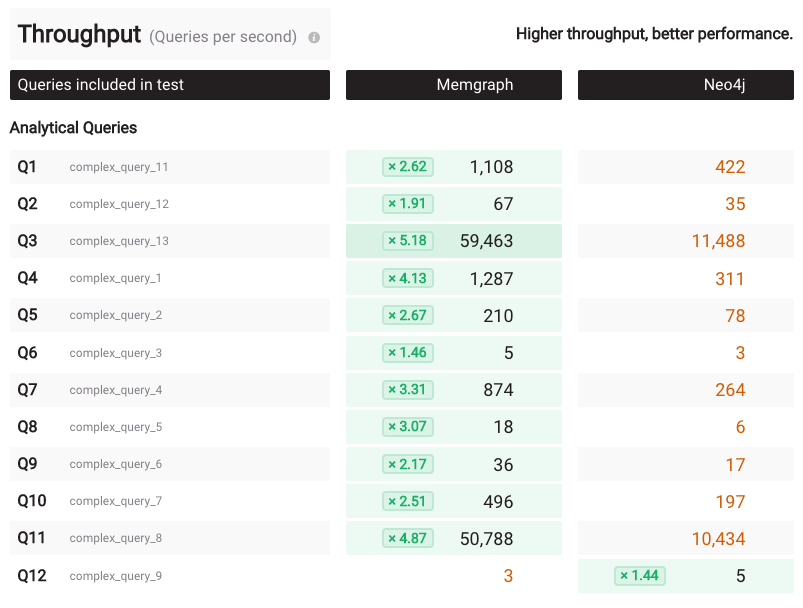
What about LDBC interactive queries? Things are a bit more complicated here: On the AMD platform, cold run, 48 workers, ldbc_interactive dataset, and sf1 dataset size, Memgraph is faster than Neo4j on all the queries, except the interactive query 9. It looks like Memgraph has an issue with that query. Take a look into the peak memory that jumped to a big 16GB. This will be investigated further.
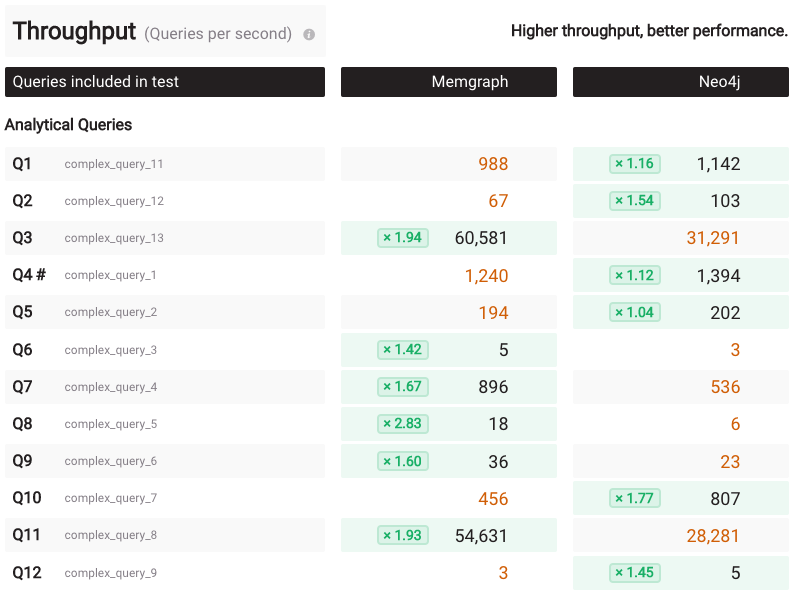
Moving back to the Vulcanic warm-up, Neo4j performs much better here than on the cold run.
But looking at the p99 latency on the cold run also tells an interesting story: Memgraph has 5 queries where p99 latency is over a second, while Neo4j has 10 of those.
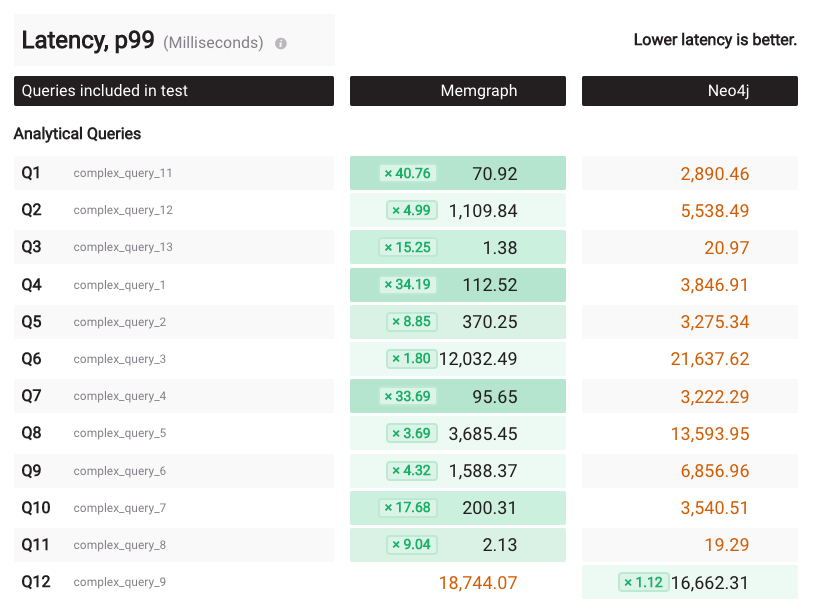
This is somewhat expected, as mentioned before, due to the different database architectures. The situation in the BI run appears to be similar:
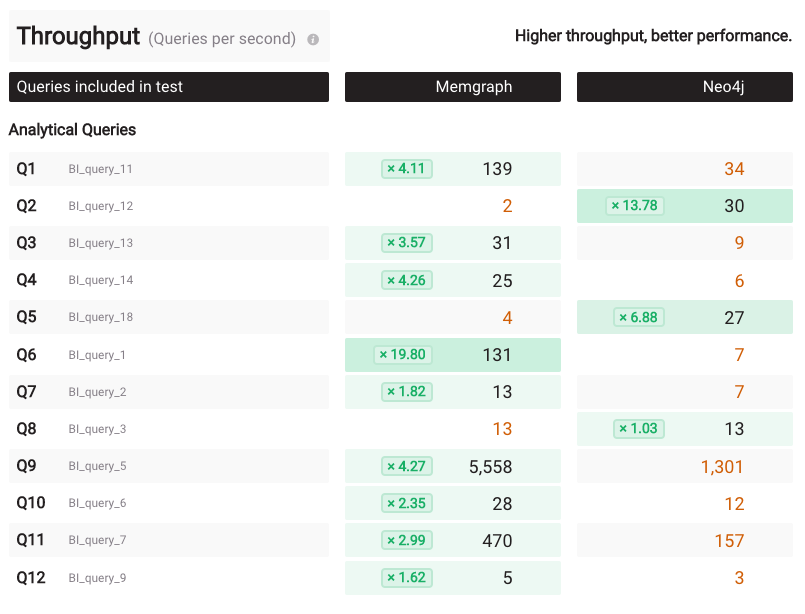
Memgraph is a step ahead on the cold runs. On the vulcanic run, Neo4j improves quite a bit. Looks like Memgraph has a fundamental issue with handling BI_query_12. Again, we’ll investigate it further.
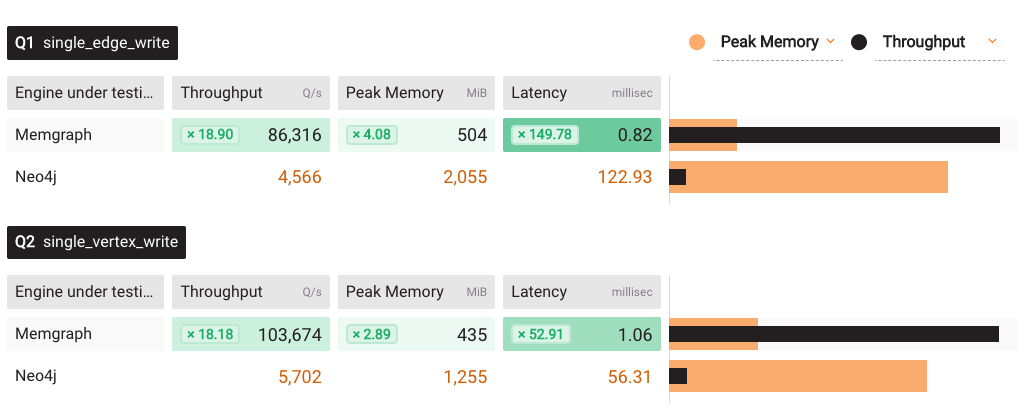
All of the above, brings us to the potential issues of write performance; caches often get invalidated during the write performance of the database. And on that front, the situation is quite clear. Memgraph in-memory writes will be faster than Neo4j on disk writes:
There are a lot more results out there on Benchgraph; change different configurations and take a look at the results. If you want to check the full results yourself, go to the raw JSON files with the results in this iteration. Benchgraph provides just a subset of data, but more relevant data will be added, such as p95 latency, query counts, etc.
You can run benchmarks on your workload!
Benchgraph workloads and queries are here to give you a glimpse of the potential performance you can expect for each database. That being said, it does not mean you will have the same situation on your workload. Running benchmarks on your specific dataset and on your specific queries will show performance that matters to you. Database tends to evolve; something that was 10x slower and faster changes with newer versions of databases, so make sure to run your own tests.
But developing and running benchmarks is hard and time-consuming. That is the reason why we made Benchgraph simple to run. You can do it yourself by following the tutorial on running your own benchmarks via Benchgraph.
Next steps
How did you like the updates? Anything in particular that caught your attention?
Benchmarks can be configured in various ways. Tiny details can have an impact on the results, but either way Memgraph offers much more perspective for speed improvement compared to Neo4j.
From now on, Benchgraph will be at your disposal to unlock the untapped potential of your database, get performance insights, and make more informed decisions moving ahead. Looks like it’s time to add a new database to Benchgraph! As always, don’t hesitate to give us a shout if we can be of further assistance.