
LLM Throws a Syntax Error Tantrum: Teaching AI to Craft Graph Style Scripts
Large Language Models (LLM) are getting a lot of traction lately. Many industries are influenced by the power of LLM and how we can use it to improve various processes and make decisions more effective. This blog post focuses on the usage of LLM to learn and help out with the generation of the custom CSS-like language to generate rules for graph styling.
Introduction
Graph style script (GSS) is a language for customizing the visual display of graphs. It was developed in-house and we use it in Memgraph Lab. GSS provides the capability to create custom rules on how to style graphs depending on the use case. This includes changing the colors, size, text, and behavior of nodes and edges upon defined rules. Rules can be simple as "Let the color of the node be RED." or complex like "Make the size of each node as a sum of sizes of neighboring nodes to indicate most influential nodes.”
For an LLM, learning a new language depends on how different it is from the ones the LLM is already aware of.
Start with GSS on Memgraph docs. Our docs contain a quick start and a full reference guide with all built-in functions, objects, and directives.
Setup
Follow these instructions on how to download and start Memgraph and Memgraph Lab using Docker, including options for setting up the environment on different operating systems.
Start Memgraph
For this tutorial, I’ve used Memgraph 2.16.0 with MAGE (Memgraph Advanced Graph Extensions) installed and Memgraph Lab 2.13.0. Then I’ve used Memgraph Lab to set up the dataset and test the GSS code generated by the LLM.
You can download and run docker-compose with the following script:
Linux/macOS
$ curl https://install.memgraph.com | sh
Windows
$ iwr https://windows.memgraph.com | iex
Or, if you wish, you can download each product separately and run them with the following commands:
Download and run Memgraph with MAGE
$ docker run -p 7687:7687 -p 7444:7444 memgraph/memgraph-mage:1.16-memgraph-2.16 --log-level=INFO
--also-log-to-stderr
Download and run Memgraph Lab
$ docker run -p 3000:3000 -e QUICK_CONNECT_MG_HOST=host.docker.internal memgraph/lab:2.13.0
Set Up the Dataset
The dataset I’ve used is a sample of the Pandora Papers containing offshore entities, world leaders, and public officials.
-
Launch Memgraph and Memgraph Lab on your system. After starting, open Memgraph Lab by navigating to http://localhost:3000 in your web browser.
-
In the sidebar of Memgraph Lab, click Datasets. From the options available, select and load the Pandora Papers dataset.
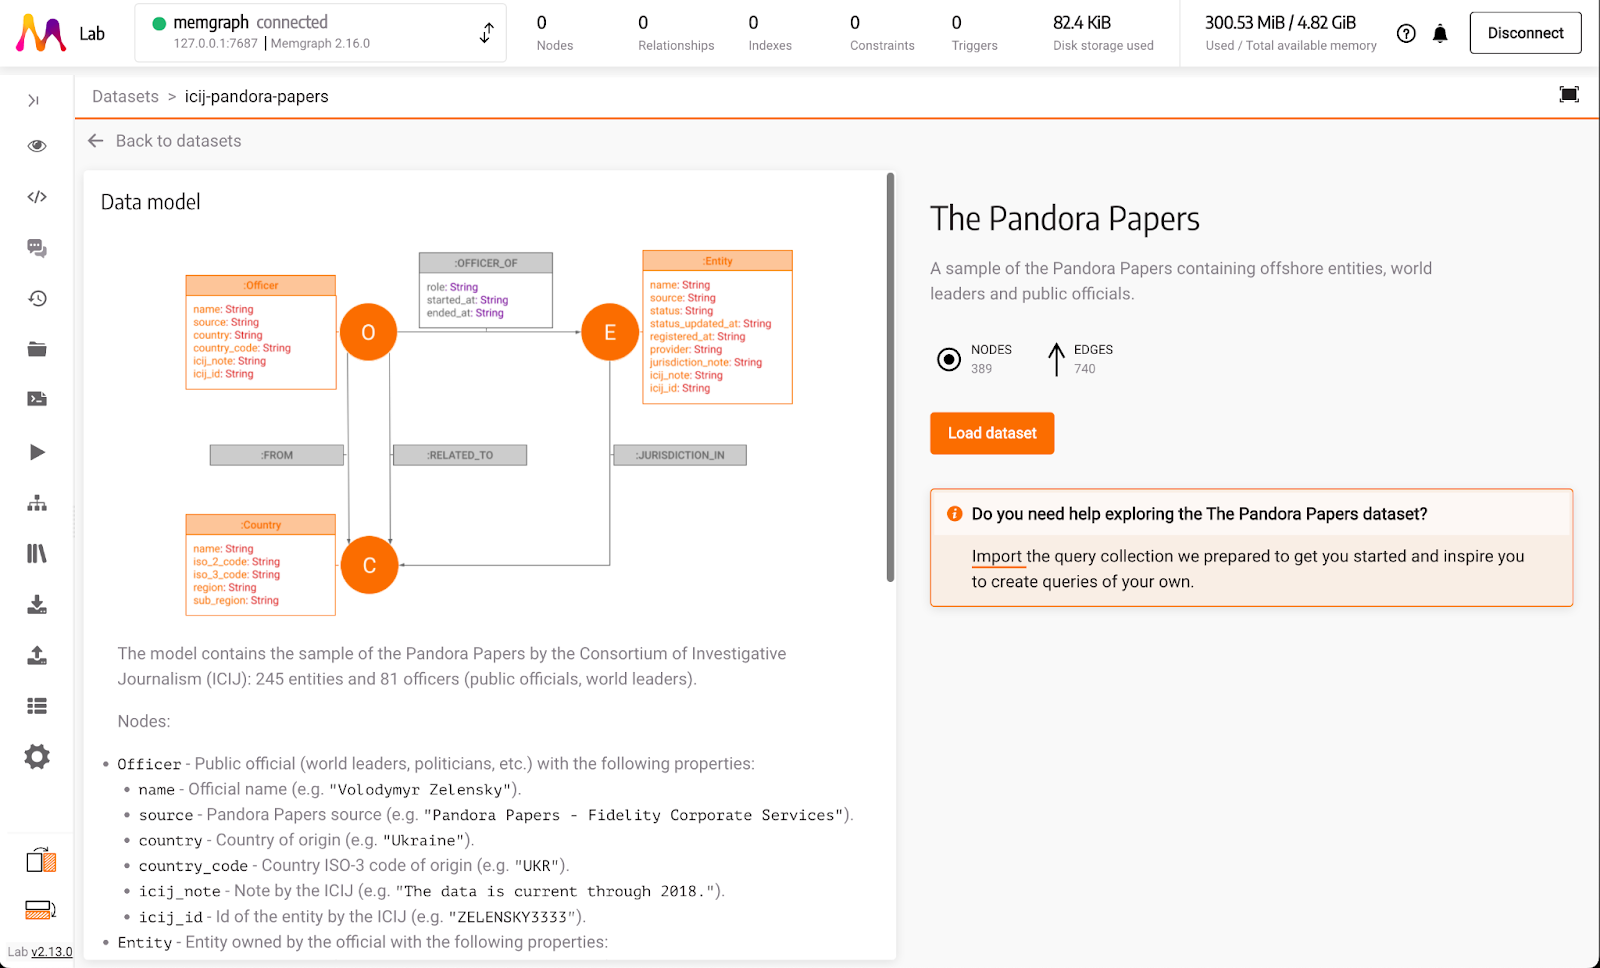
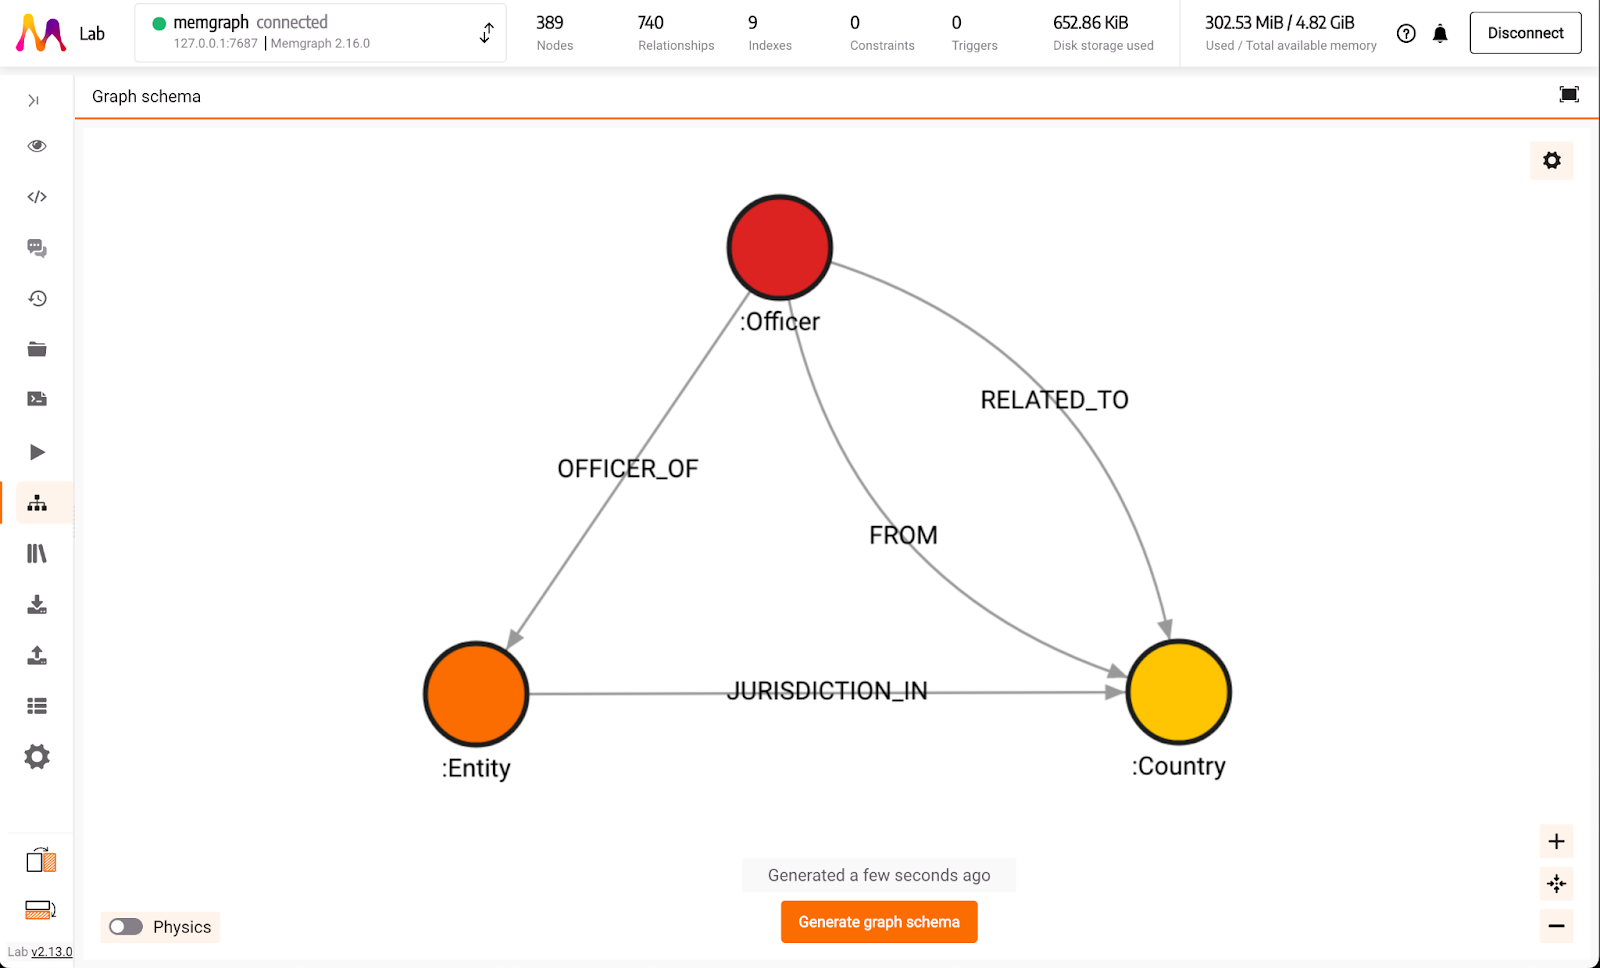
- Find the graph schema of the dataset. It contains
Officers(public figures) who have connections to variousEntities(companies and organizations) from differentCountries.
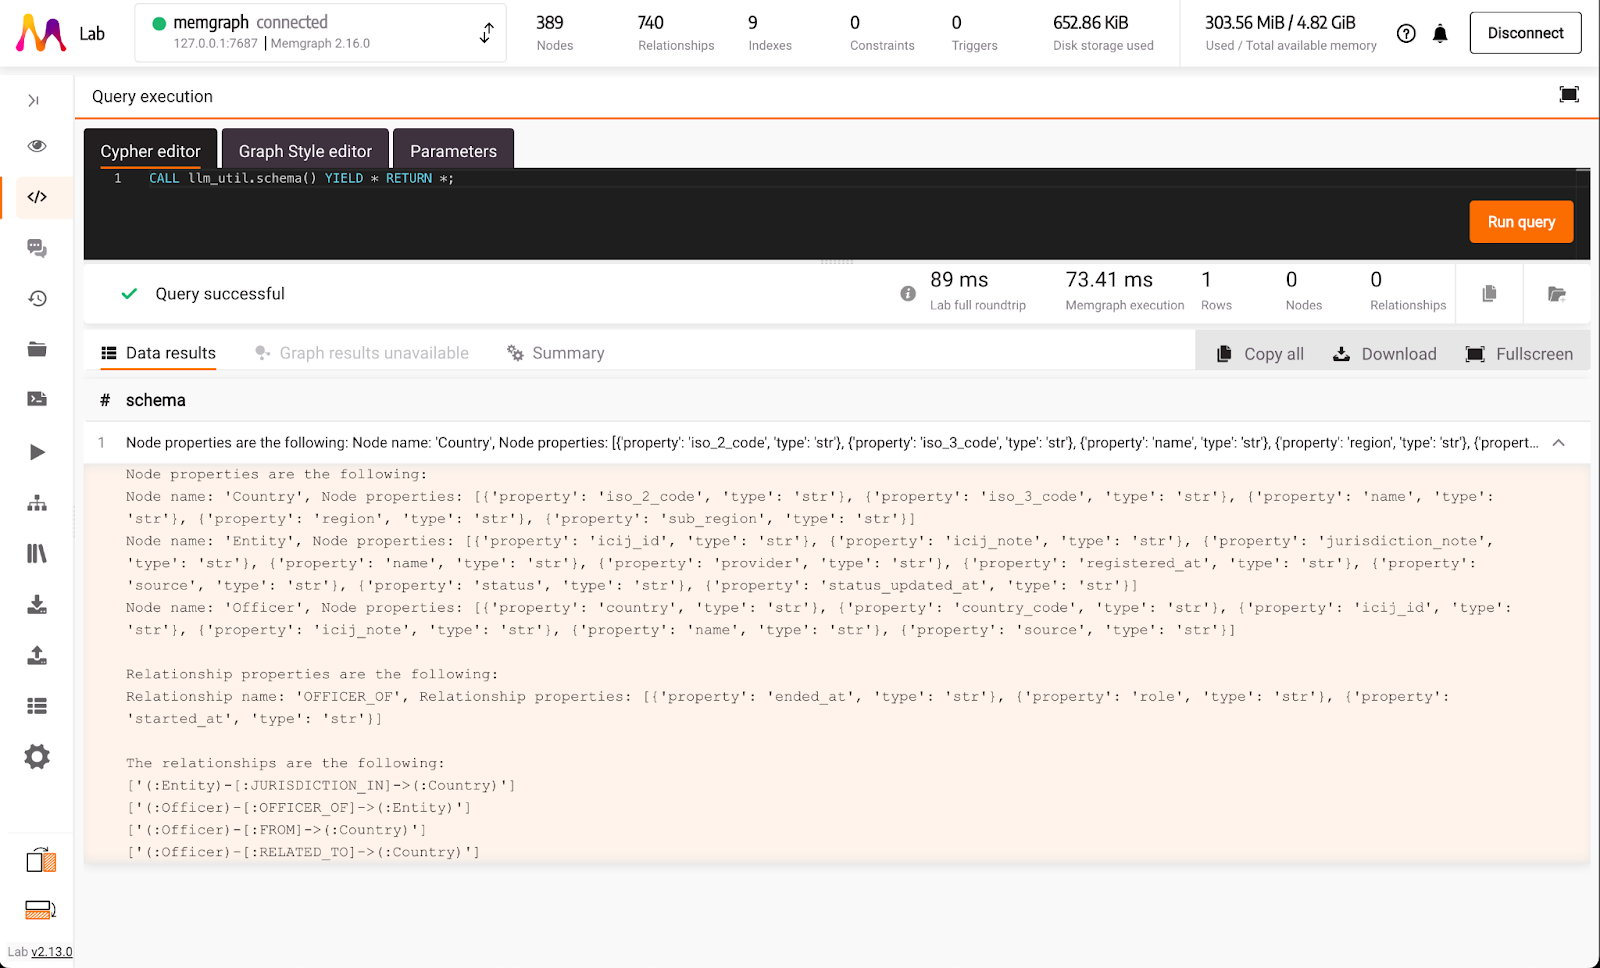
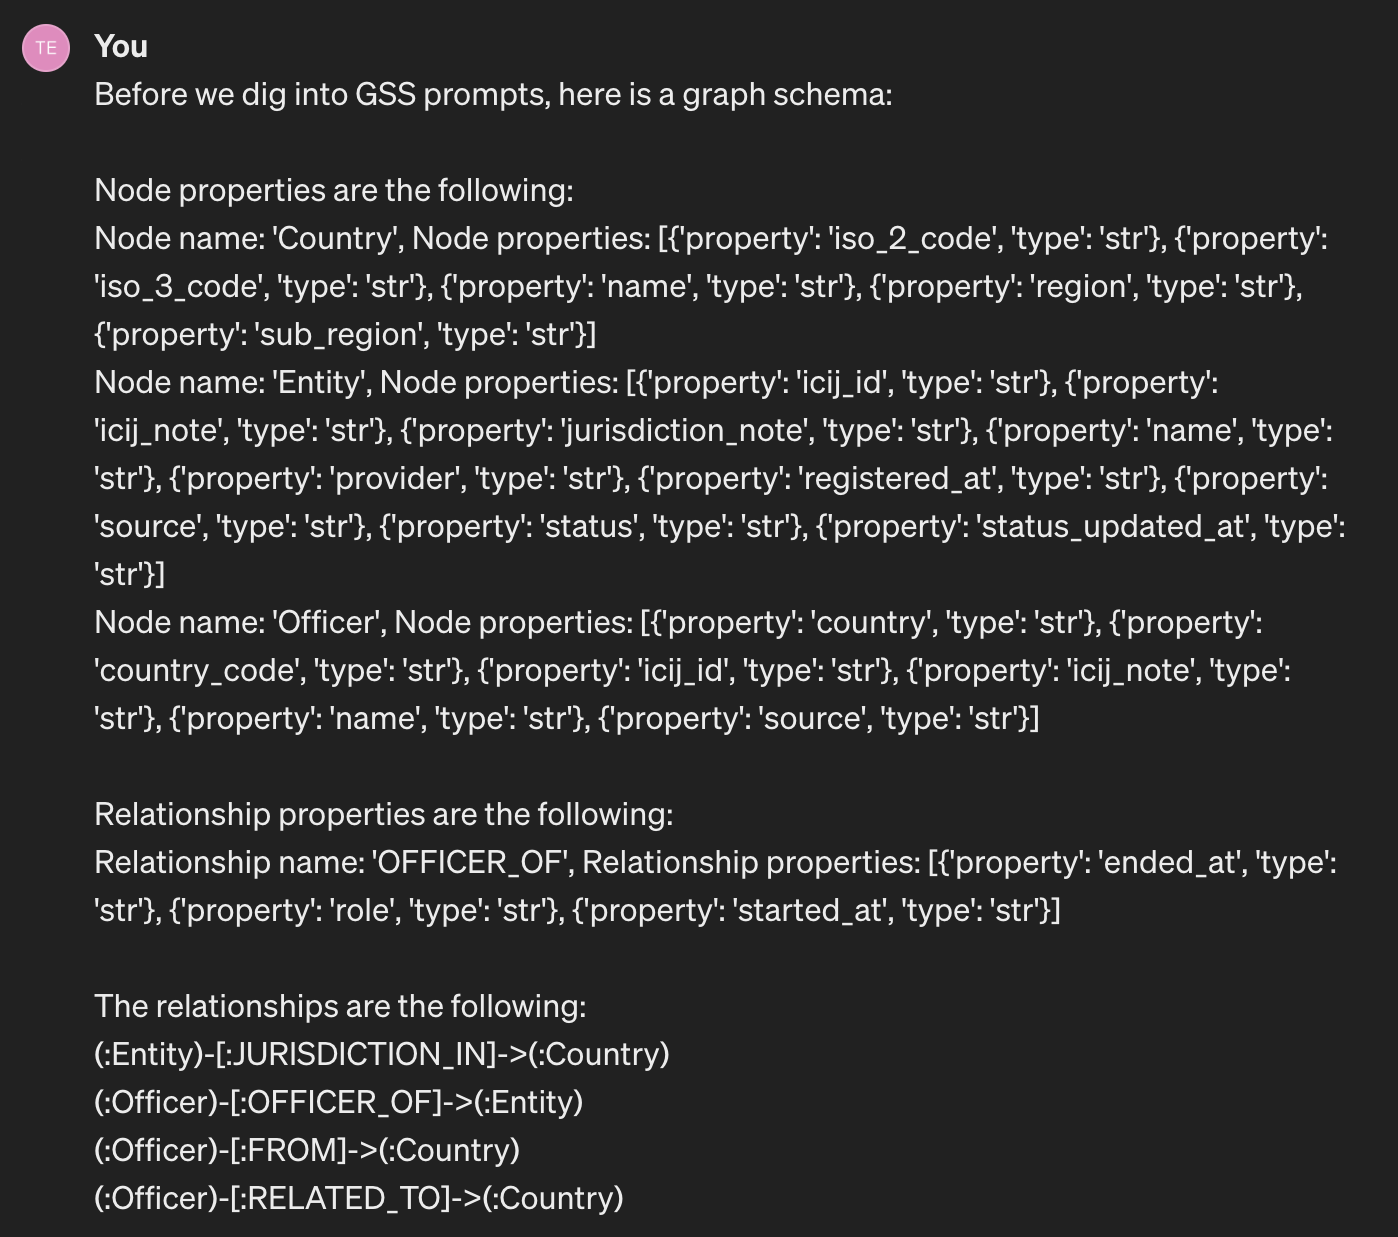
- Prepare the graph schema in textual format. To make the dataset's structure comprehensible to the Large Language Model (LLM), you need to generate a textual format of the graph schema. Luckily, there is a MAGE utility module llm_util that is super helpful for such requests. Open the query execution view in Memgraph Lab and execute the following Cypher query to obtain the graph schema in textual format:
CALL llm_util.schema() YIELD * RETURN *;Response example:
Node properties are the following:

Node name: 'Country', Node properties: [{'property': 'iso_2_code', 'type': 'str'}, {'property': 'iso_3_code', 'type': 'str'}, {'property': 'name', 'type': 'str'}, {'property': 'region', 'type': 'str'}, {'property': 'sub_region', 'type': 'str'}]

Node name: 'Entity', Node properties: [{'property': 'icij_id', 'type': 'str'}, {'property': 'icij_note', 'type': 'str'}, {'property': 'jurisdiction_note', 'type': 'str'}, {'property': 'name', 'type': 'str'}, {'property': 'provider', 'type': 'str'}, {'property': 'registered_at', 'type': 'str'}, {'property': 'source', 'type': 'str'}, {'property': 'status', 'type': 'str'}, {'property': 'status_updated_at', 'type': 'str'}]

Node name: 'Officer', Node properties: [{'property': 'country', 'type': 'str'}, {'property': 'country_code', 'type': 'str'}, {'property': 'icij_id', 'type': 'str'}, {'property': 'icij_note', 'type': 'str'}, {'property': 'name', 'type': 'str'}, {'property':

'source', 'type': 'str'}]


Relationship properties are the following:

Relationship name: 'OFFICER_OF', Relationship properties: [{'property': 'ended_at', 'type': 'str'}, {'property': 'role', 'type': 'str'}, {'property': 'started_at', 'type': 'str'}]


The relationships are the following:

(:Entity)-[:JURISDICTION_IN]->(:Country)

(:Officer)-[:OFFICER_OF]->(:Entity)

(:Officer)-[:FROM]->(:Country)

(:Officer)-[:RELATED_TO]->(:Country)
Prepare the LLM
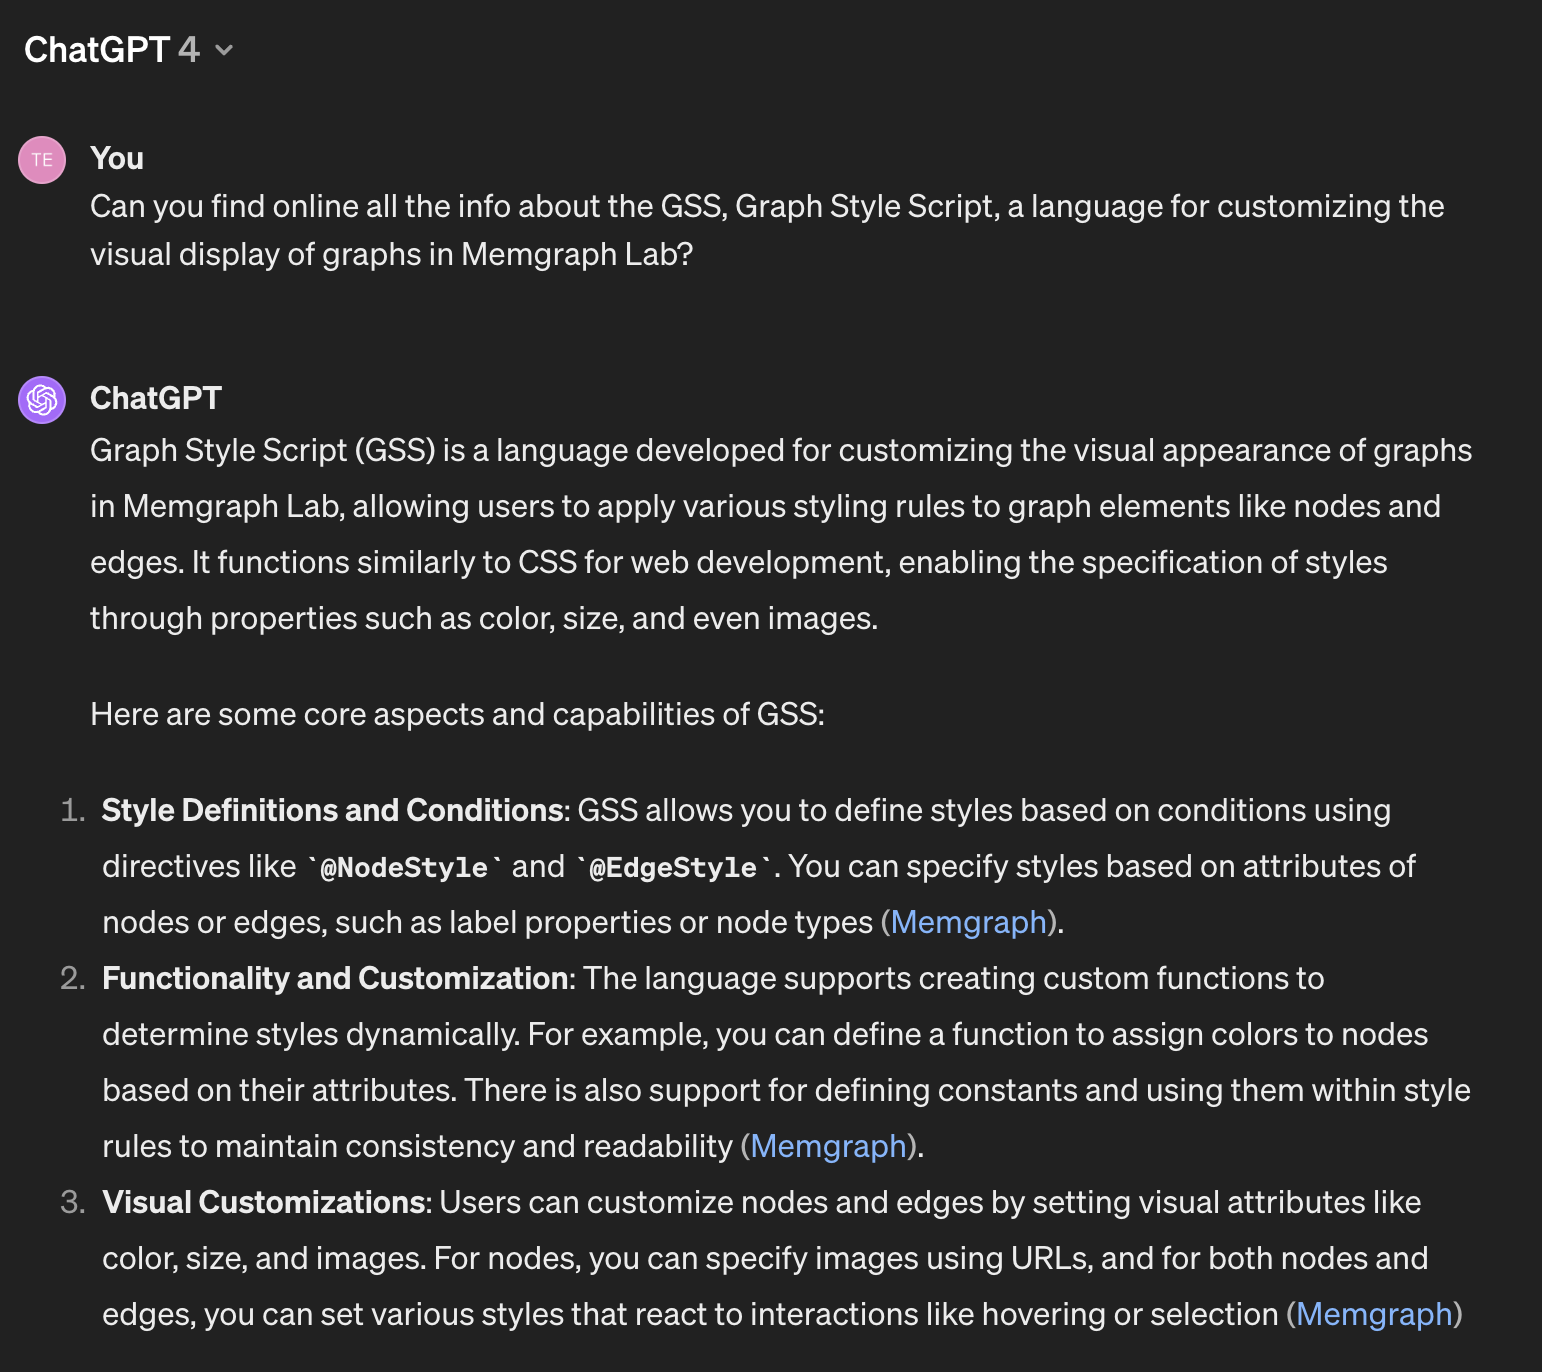
I’ve used OpenAI GPTv4 because it can get all the available documentation on GSS in real time by searching Memgraph docs. To prepare such a context, I’ve asked the GPTv4 model to learn about GSS online. In the screenshot below, you’ll notice the sources from where the LLM picked the info, and most of it is Memgraph docs.
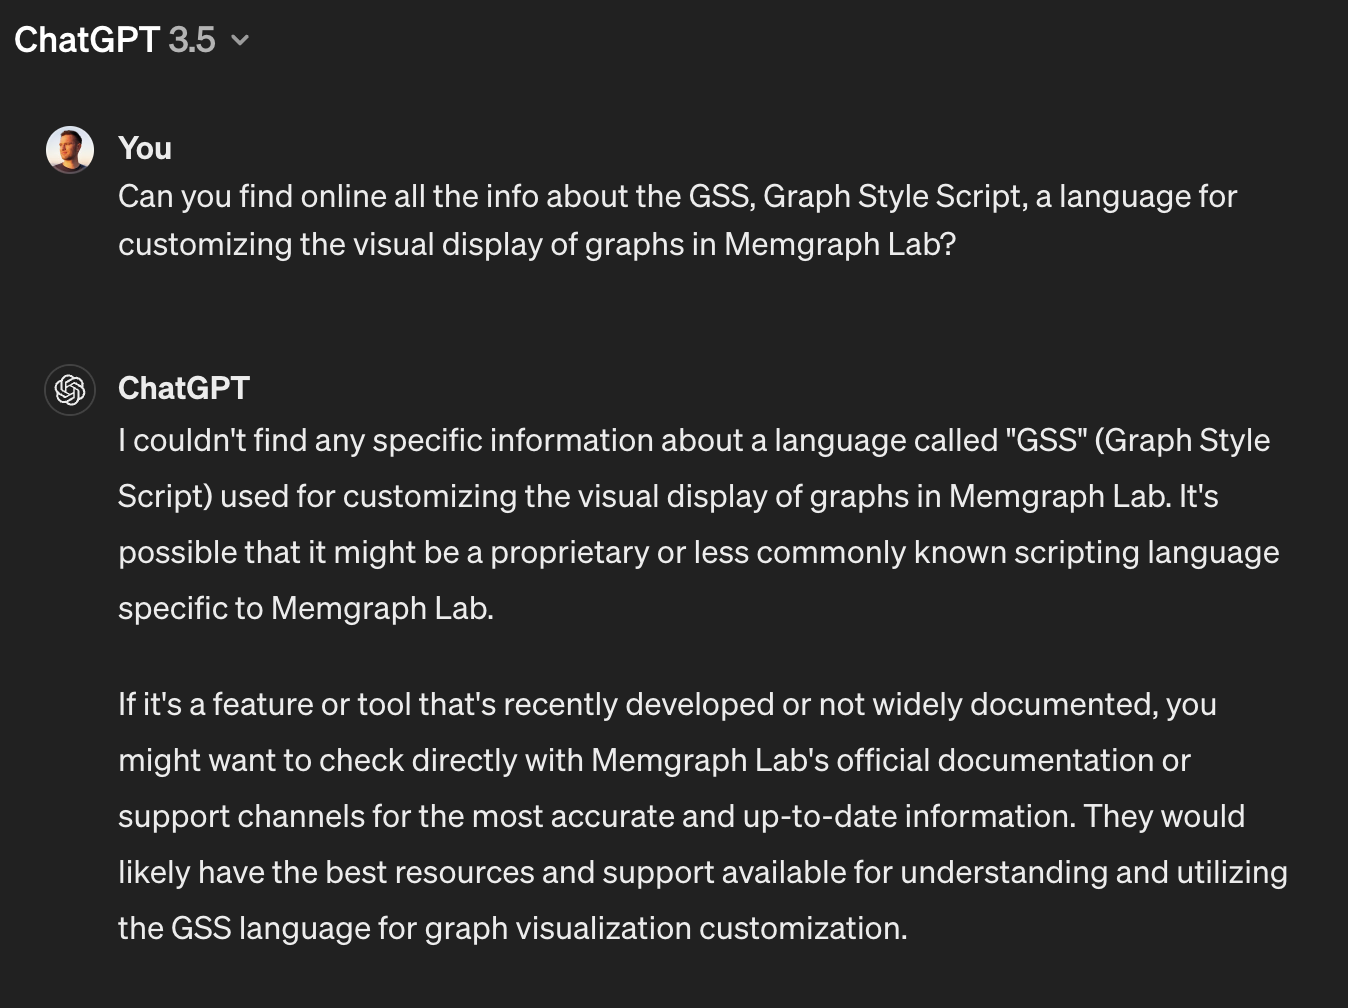
If you're working with OpenAI GPTv3.5 or any other LLM that can't search online, you must provide it with all the available GSS documentation. I’ve prepared 15 messages from Memgraph docs to equip the LLM with the necessary GSS baseline context. You need to send all these messages to your model to prepare the context.
In the rest of the blog post, I’ll focus only on the responses from the GPTv4 model. If you wish to check the full conversation used in this blog post, you can check it out here.
Testing the Code Generation
Before we begin testing GSS code generation by the LLM, we need to ensure that the LLM understands the graph schema model and the type of data it contains. This will help it generate accurate GSS. To do this, we will share the textual form of the graph schema that was created during the first "Set up the dataset" step.
The LLM quickly produced several GSS code snippets for each node and relationship. The code was generally okay, but it included a syntax error—a semicolon (;) at the end of each line, which is invalid in GSS. When we pointed out the syntax error to the LLM, it corrected the GSS code and avoided making the same error in any subsequent code.
With everything ready to go, it is time to test code generation. I’ve covered three use cases: one simple and two complex.
Simple Request
Let's start with a simple request to see how LLM generates simple GSS code.
Prompt:
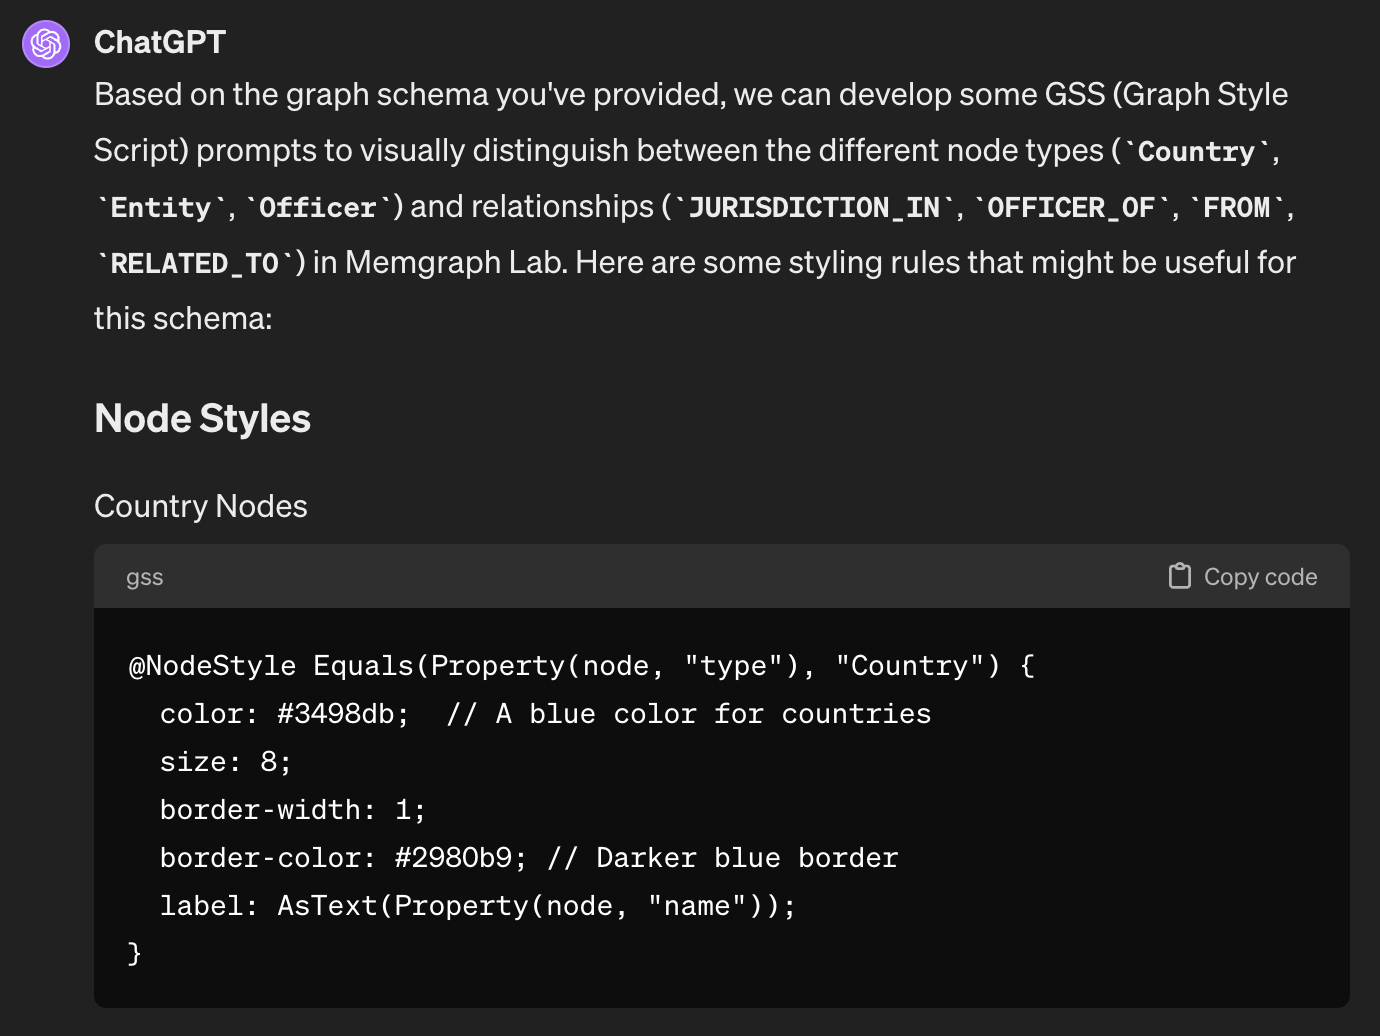
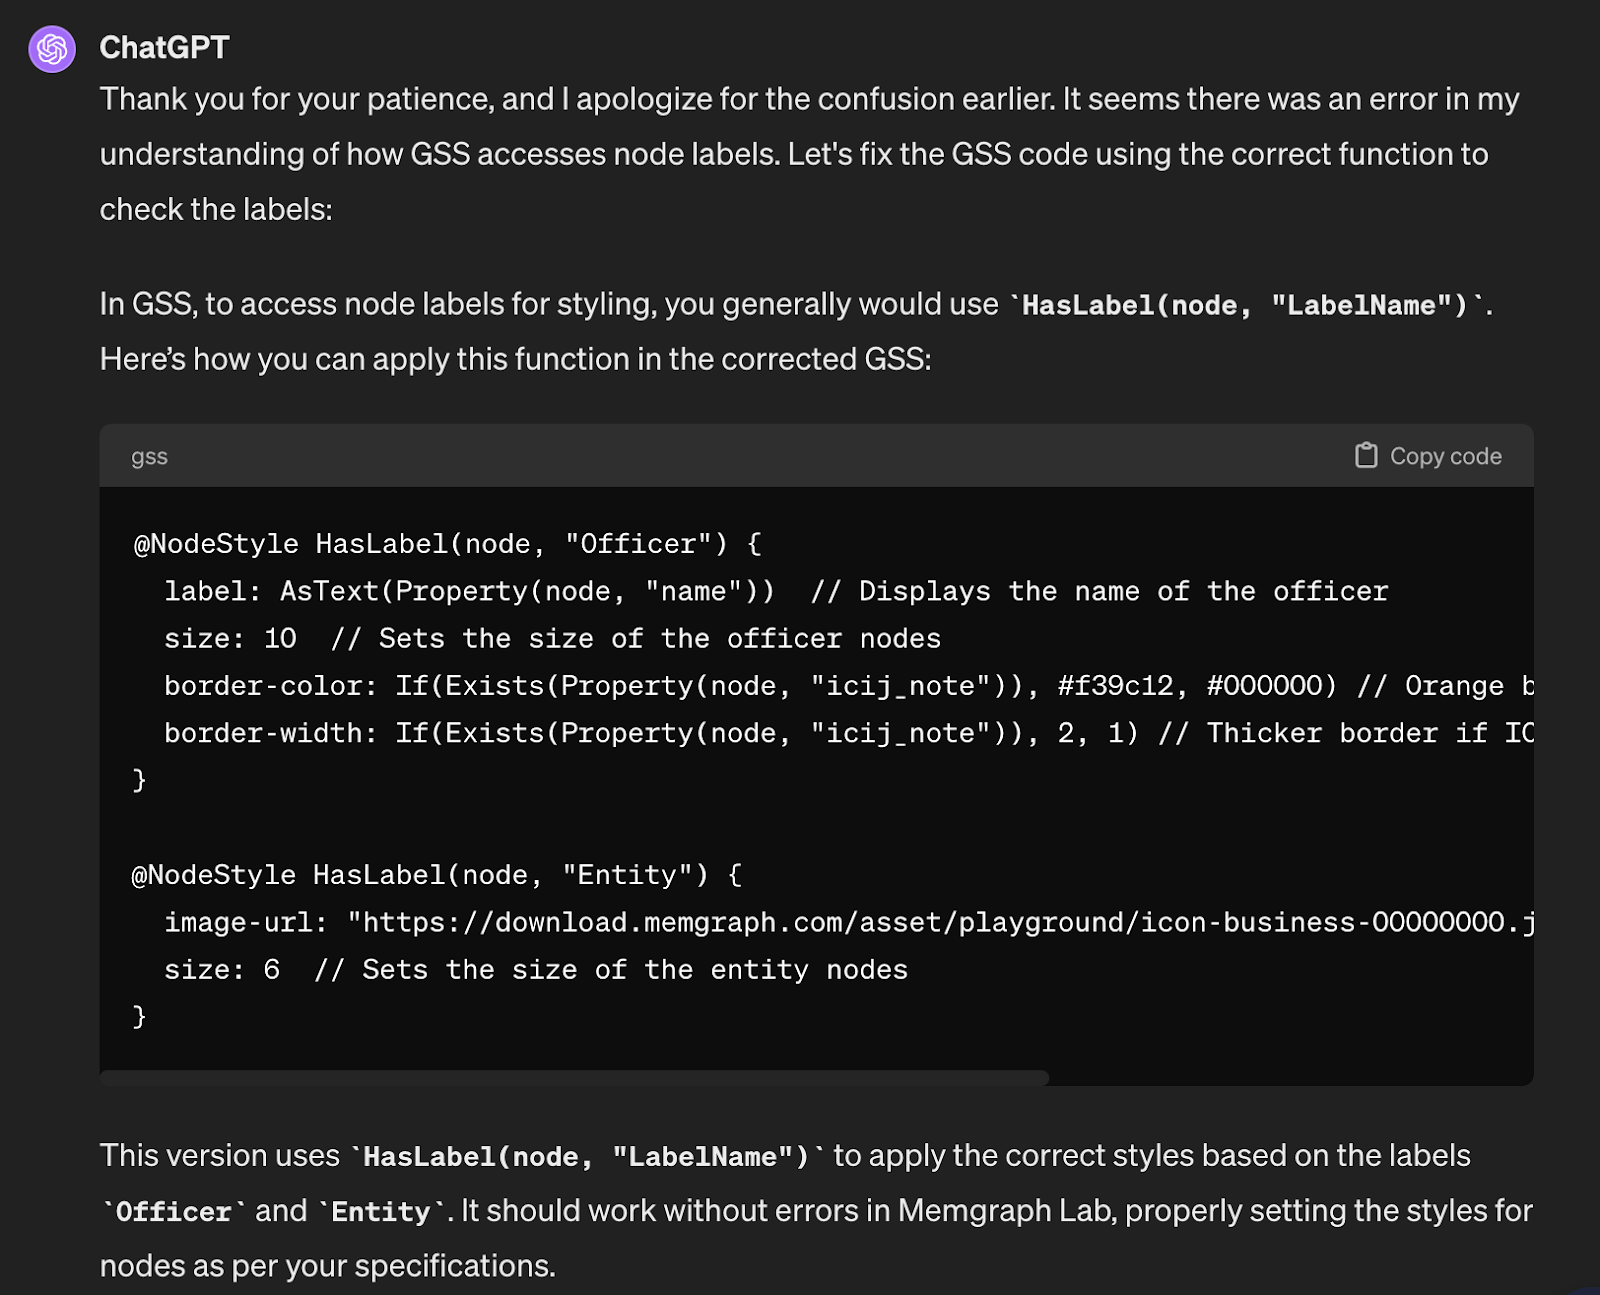
"Create a GSS code where nodes with the label
Officerwill show a name. If there is an ICIJ note content, a node should have a border in orange color. Nodes with the labelEntityshould have a background image "https://download.memgraph.com/asset/playground/icon-business-00000000.jpg" with size 6. Officer nodes should have a size 10."
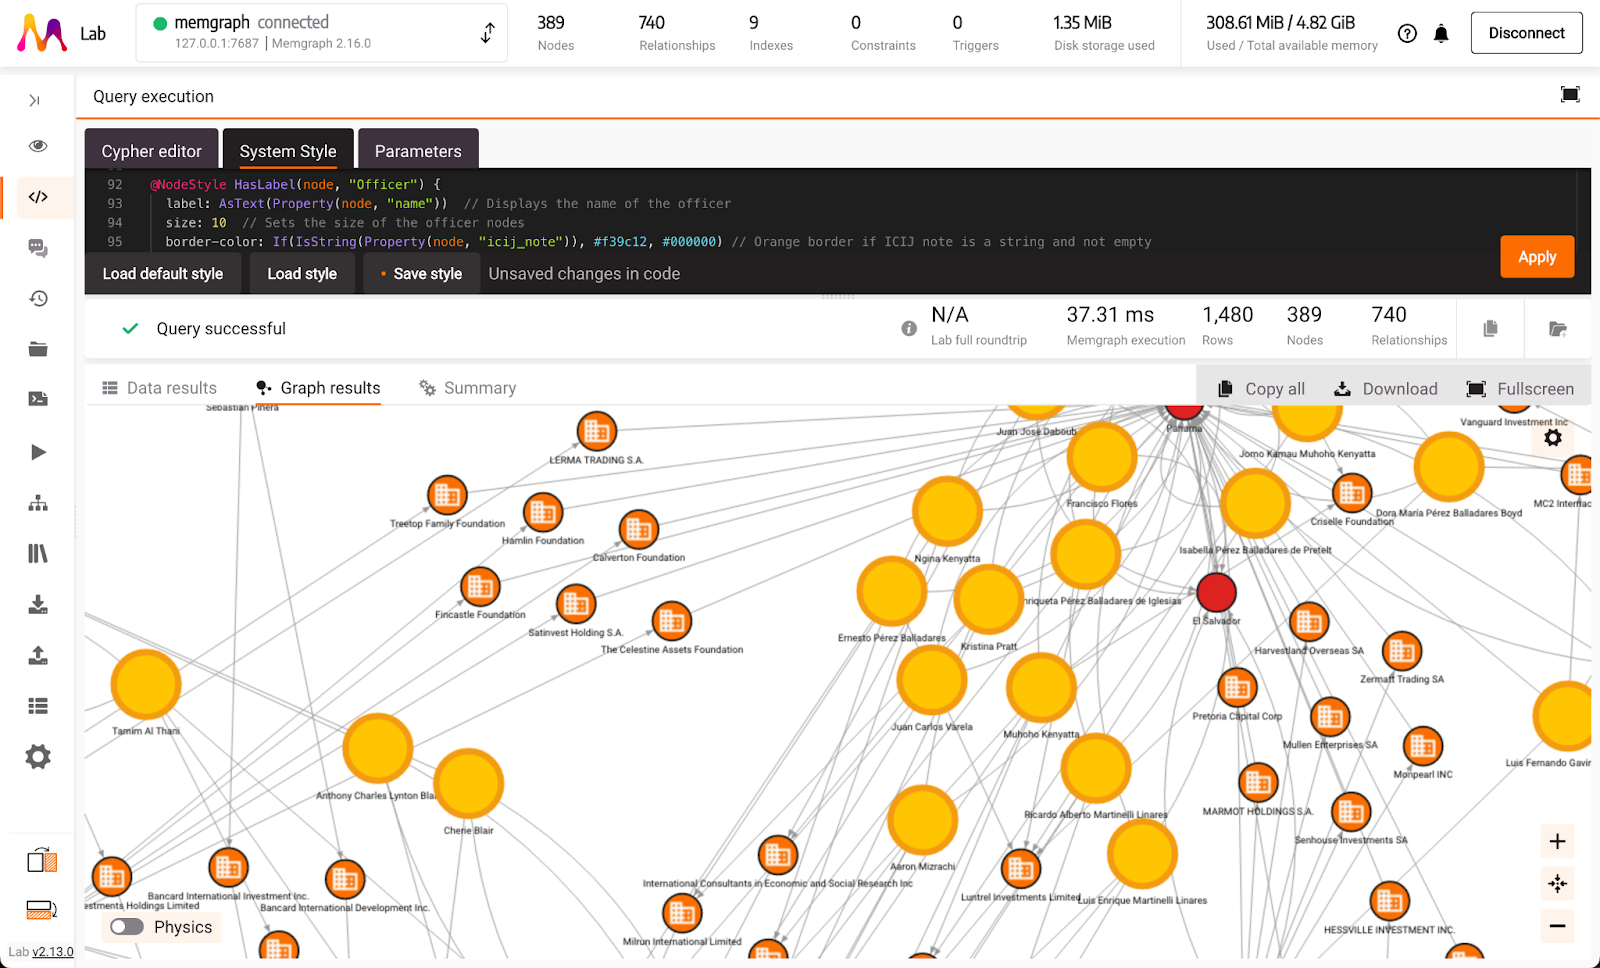
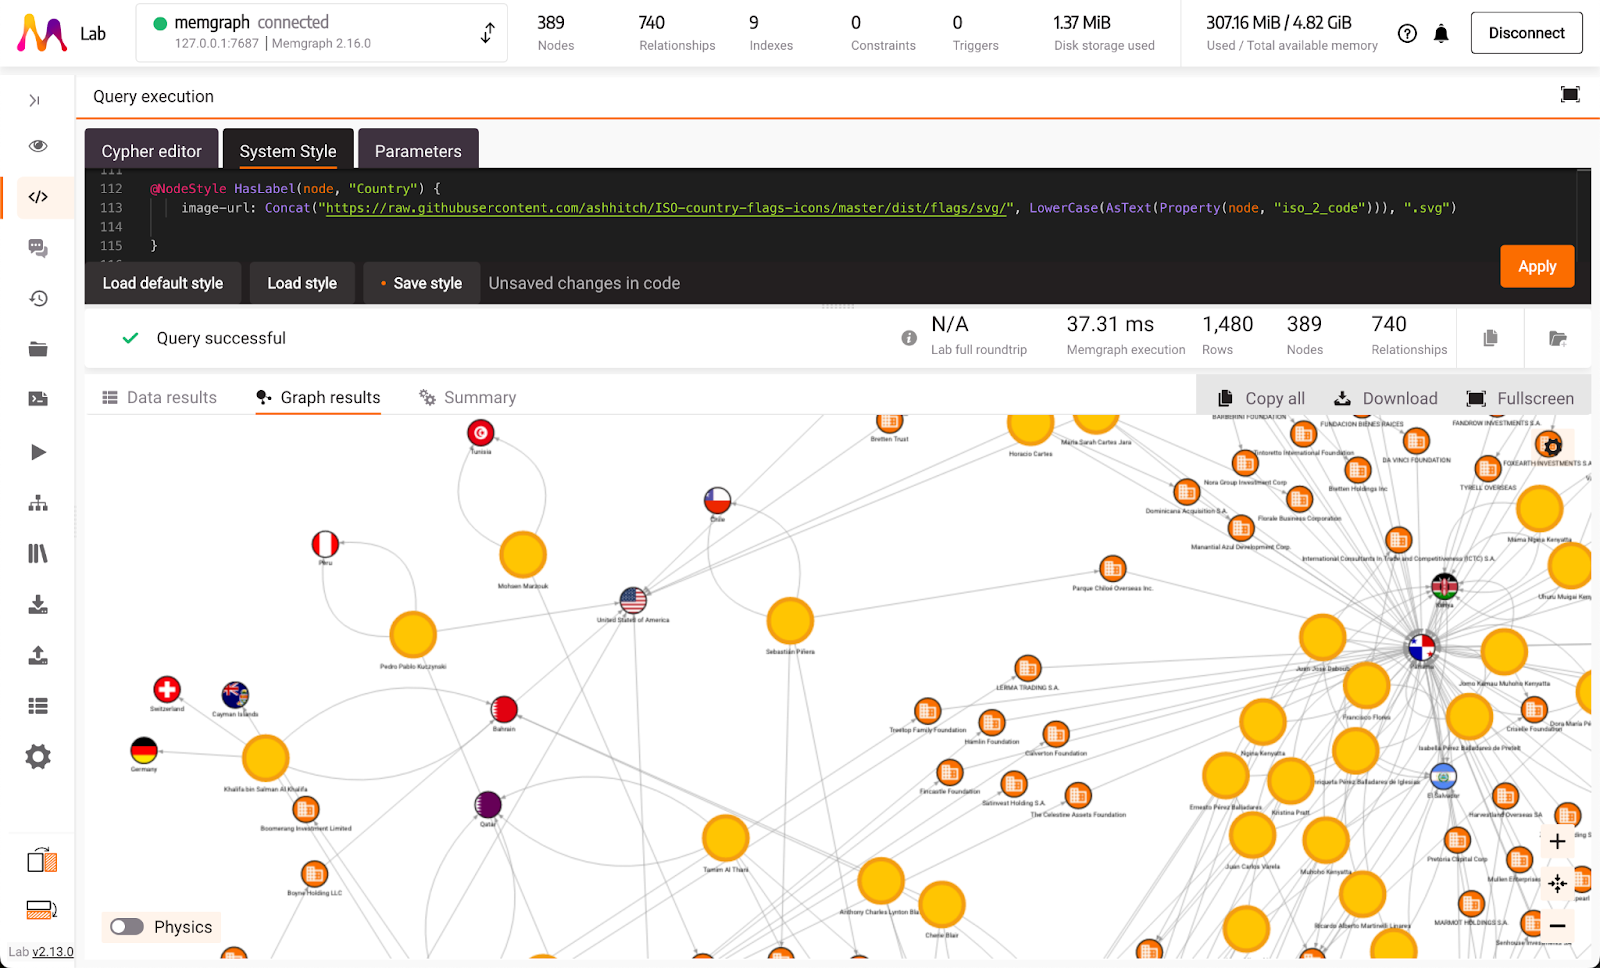
After working with the language model several times and sharing any mistakes it made, I finally got the correct GSS code. The picture below shows how this GSS code looks in Memgraph Lab. You'll see big yellow circles with orange edges labeled Officer; these circles have a special note if they contain complete ICIJ information. The Entity nodes in the graph have a background image that was specified earlier.
In each iteration, LLM used unknown GSS functions like Label, Exists, and Ne. With just the error message content, LLM was able to locate and find the correct combination of GSS built-in functions without any help or direction on which functions to look after. All built-in functions are listed in the GSS reference guide which is a source material for the LLM.
If you are interested in the whole conversation used in this blog post, feel free to check it out here.
Complex Request
GSS can be very powerful with a little piece of code. Let's test that use case.
Prompt:
"Create a GSS code where each node with the label
Countrywill have a country flag as a background image. There is a link "https://raw.githubusercontent.com/ashhitch/ISO-country-flags-icons/master/dist/flags/svg/XX.svg" that contains all country flags where XX.svg should match the country iso 2 code in lowercase. Let the size of nodes with the labelCountrybe a distribution from 1 to 10 depending on the count of inboundJURISDICTION_INedges: nodes with the minimum number of edges should have size 1, and nodes with the maximum number of those edges should have size 10."
Country Flags
The code for country flags was correct immediately. You can check what it looks like in the Memgraph Lab when the GSS code is applied—each node Country has a background image that matches the country flag.
The correct piece of GSS code that LLM generated for country flags is:
@NodeStyle HasLabel(node, "Country") {
  image-url: Concat(
    "https://raw.githubusercontent.com/ashhitch/ISO-country-flags-icons/master/dist/flags/svg/",
    LowerCase(AsText(Property(node, "iso_2_code"))),
    ".svg"
  )
}
Linear Node Size Scaling
The GSS code that should handle linear node size scaling was invalid. It was an interesting idea, similar to if you were to ask LLM to solve the meaning of life, and it would respond with the code: SolveMeaning(life). The initial code that LLM generated was:
// Adjust size from 1 to 10 based on the count of inbound JURISDICTION_IN edges
size: Linear(CountInEdges(node, "JURISDICTION_IN"), 1, 10);
The problem with the above code is that GSS doesn’t have built-in functions Linear and CountInEdges. GSS language offers a way to define those functions using Define, but LLM hasn’t done that. When an error “Linear is not defined” was shared with the LLM, the model did a fallback to the correct GSS code, but without any linear scaling capability. LLM added a note that the user should precalculate linear distribution beforehand, update the nodes, and save the value in the property called scaled_size. Nice try, but not what we want.
// Directly use the pre-calculated size
size: AsNumber(Property(node, "scaled_size"));
After sharing information that there is no way to create new properties in the database and to make the generation of the scaling code more straightforward to use static value 1 as minimum and static value 200 as maximum, the response from the LLM was close to the actual code, but it was still using the unknown function CountInEdges. It used math operators -, /, and + which are not supported in GSS.
GSS uses Sub, Div, Mul, and Add for math operations.
// Manual scaling calculation
size: Min(10, Max(1, (CountInEdges(node, "JURISDICTION_IN") - 1) / 20 + 1));
When an error that the function "CountInEdges is not defined" was shared with the LLM, the model simply stopped new attempts and generated a code with the static size value and a note: "A static size due to limitations in dynamic sizing via GSS".
// A static size due to limitations in dynamic sizing via GSS
size: 5;
With the above code, all nodes would have a static size of 5. No linear scaling. If the model had emotions, it would be something like this:
Linear Size Scalling with GSS?
Is linear size scaling even possible with GSS?
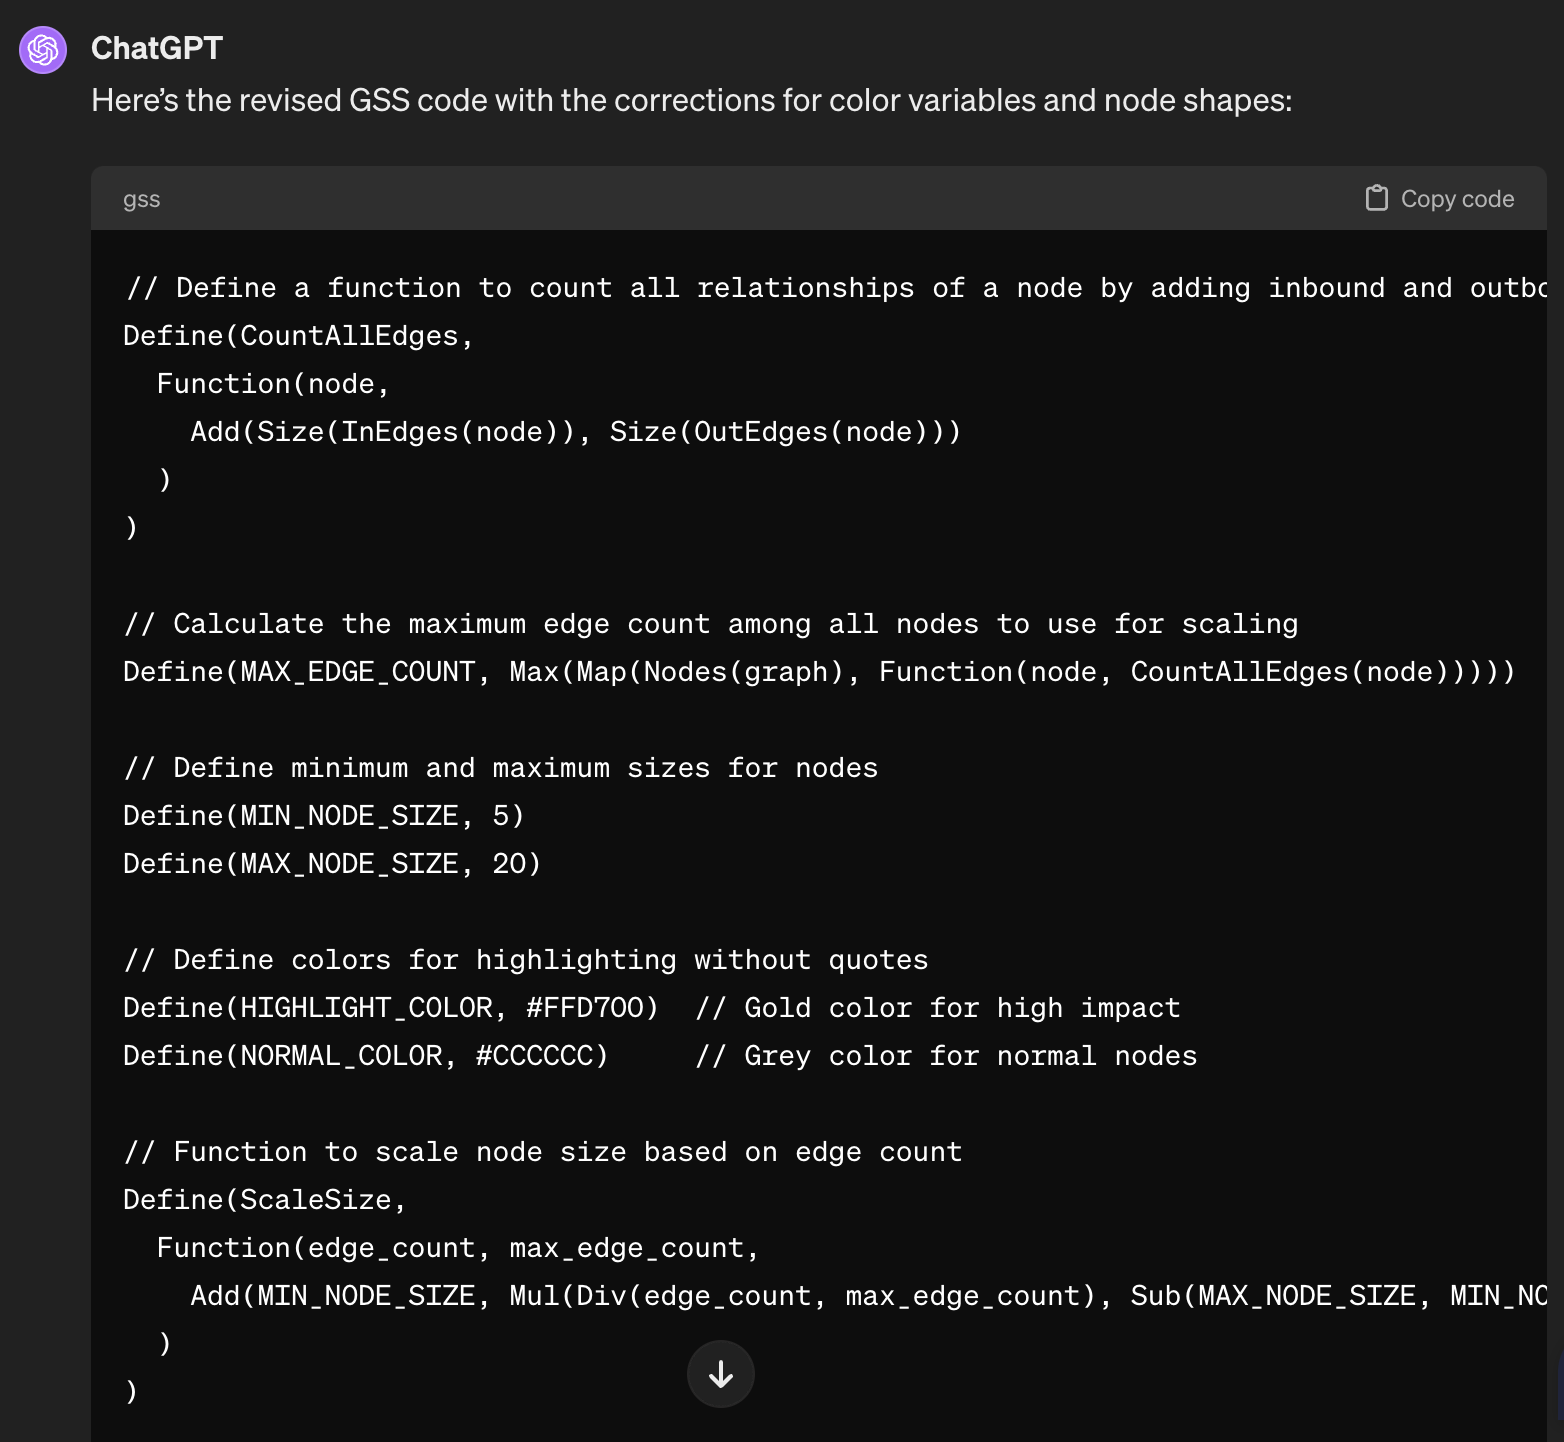
Linear size scaling is possible in GSS, but it is not trivial to create it. Here is the dynamic code, which depends on the graph shown in the user interface. The code uses the Define function which is useful when creating custom functions and custom variables.
Size scaling is done only on nodes with the label Country, so a variable COUNTRIES is defined that contains all nodes from a graph that have the label “Country”.
An additional utility function FilterInEdgeTypes is created that will filter out inbound relationships that match the input relationship type from an input node.
Down below, a size range is defined with a MIN variable being value 0, and a MAX value being dynamically calculated from all the nodes with the label Country. This is the dynamic part that LLM had problems with. The MAX value will be equal to the Country node that has the most inbound relationships with type “JURISDICTION_IN”. The rest of the code is a creation of a scaling function and applying the scale to the node size.
// Variable `COUNTRIES` will hold all the nodes that
// have label `Country`
Define(COUNTRIES,
Filter(Nodes(graph), Function(node, HasLabel(node, "Country")))
)
// Utility function `FilterInEdgeTypes` takes two arguments
// node and edge_type and it will filter out all inbound
// edges with matching edge type
Define(FilterInEdgeTypes,
Function(node, edge_type,
Filter(InEdges(node), Function(e, Equals(Type(e), edge_type)))
)
)
// Minimum for linear scaling
Define(MIN_COUNT, 0)
// Maximum for linear scaling - takes all country nodes
// and finds the one with most inbound edges "JURISDICTION_IN"
Define(MAX_COUNT,
Max(Map(COUNTRIES, Function(country, Size(FilterInEdgeTypes(country, "JURISDICTION_IN")))))
)
Define(MIN_SIZE, 1)
Define(MAX_SIZE, 10)
// Let's also create a function Linear that LLM suggested, but
// it doesn't exist in the built-in GSS functions so we need to
// create it
// It will do: minA + (X - minB) / (maxB - minB) * (maxA - minA).
Define(Linear,
Function(count, min_count, max_count, min_value, max_value,
Add(Mul(Div(Sub(count, min_count), Sub(max_count, min_count)), Sub(max_value, min_value)), min_value)
)
)
@NodeStyle HasLabel(node, "Country") {
size: Linear(
Size(FilterInEdgeTypes(node, "JURISDICTION_IN")),
MIN_COUNT,
MAX_COUNT,
MIN_SIZE,
MAX_SIZE
)
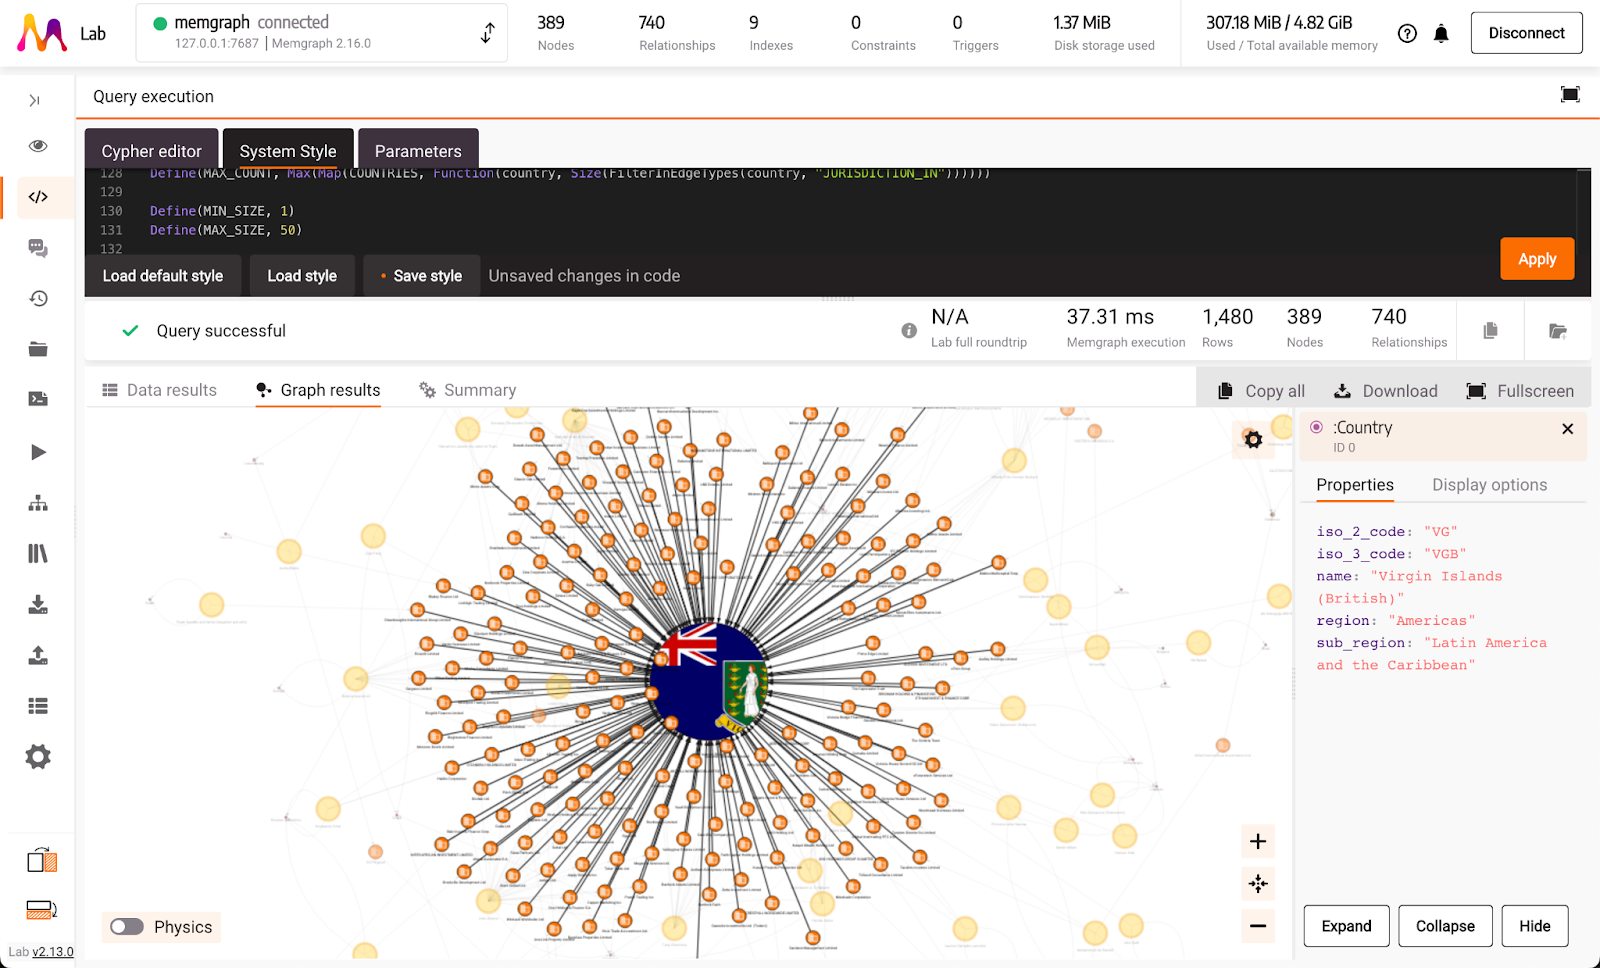
}In the above code, we even used the same function name that LLM used in the first try, called Linear, but now it has a defined function body. The code is also generic enough to easily change the maximum size to 50 instead of 10 for easier visual difference.
In the image below you can find what it looks like on the dataset where "Virgin Islands (British)" is the largest one because it has the maximum number of entities connected to the country node.
If you share the code from above code with the LLM, and the model will respond:
…
It looks like you’ve crafted a complex set of GSS functions that work around the limitations we encountered earlier. Here’s a breakdown of what you’ve done, which is quite ingenious.
…
[GPTv4]
This one felt like:
If you are curious to see the full conversation, feel free to check it out here.
Generic Request
The most complex request would be the one that is in a generic form. When styling graphs, what you want to achieve is to create style rules that will help emphasize important information visually. It should draw attention to important information and important relations. That's the reason why GSS is usually used to magnify the important nodes, make the width of important edges larger with significant colors, etc.
A prompt like that would be:
"Create a GSS that will show significant Officers, Entities, and Countries depending on their network connectivity and impact analysis".
It was cool to see how LMM uses Define to create custom utility functions after seeing a similar example in the previous prompt:
After a few iterations of fixes, LLM was able to generate a valid GSS code. Running it in the Lab results in:
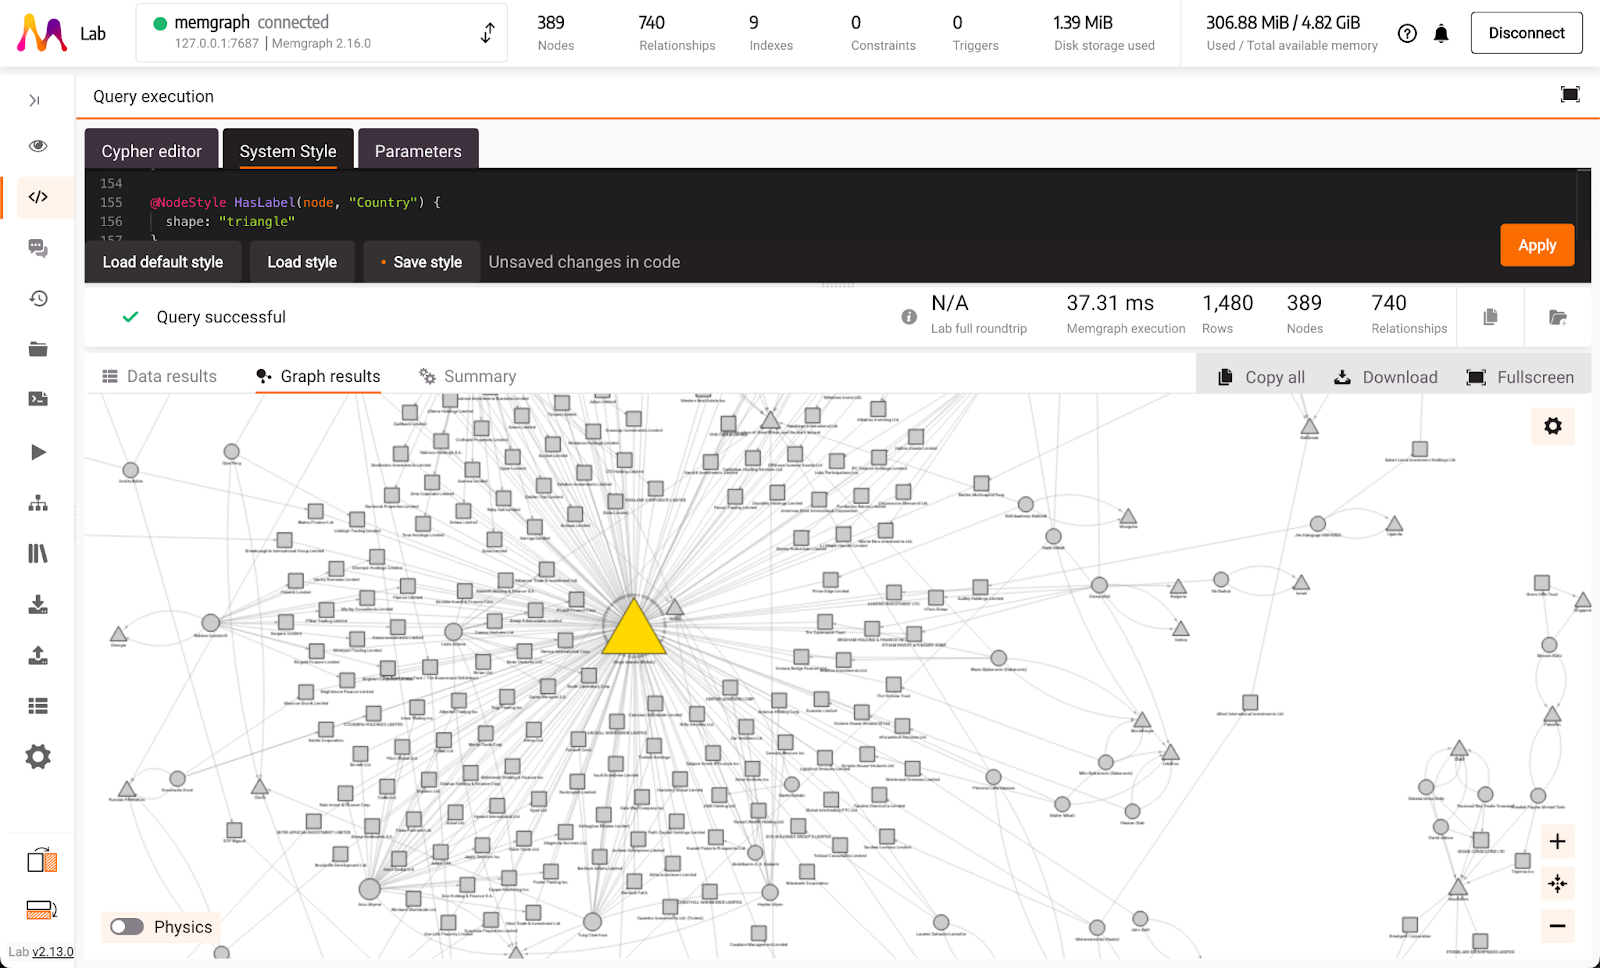
It shows the significant node, the country "Virgin Island (British)", shown as a yellow triangle, that has the most connections with entities and officers. It uses linear scaling for sizes and different colors for the number of edges connecting two nodes.
Feel free to check out the full conversation here.
Conclusion
It was awesome to see how quickly we can get an LLM up to speed to learn a custom language and be able to generate simple code snippets. The only source from which LLM can learn about GSS is the Memgraph documentation site. It has a full reference guide on all built-in functions, but it lacks examples and different patterns on how to do good GSS code which makes learning a real challenge, not just for the LLM, but for anyone who wants to use it.
On various occasions, LLM used functions that don’t exist in GSS, like Linear and Switch-Case. For example, the code below was a response when LLM was asked to create a GSS code where nodes should have a different color depending on a property community_id:
@NodeStyle {
  color: Switch(Property(node, "community_id"),
    Case(1, "dodgerblue"),
    Case(2, "limegreen"),
    Case(3, "gold"),
    Case(4, "orangered"),
    Case(5, "mediumorchid"),
    // Add more cases as needed for additional communities
    Default("lightgrey") // Nodes without a recognized community_id
  )
}
Function Switch-Case doesn't exist in GSS yet, but this one and other LLM responses with unknown functions can be a really good place to get new ideas for new built-in functions, similar to Linear function for linear scaling. Btw, the Switch-Case use case where different color is applied depending on a set of defined numbers can be done with a Map in the GSS:
// Define a mapping of community IDs to colors
Define(communityColors, AsMap(
  1, "dodgerblue",
  2, "limegreen",
  3, "gold",
  4, "orangered",
  5, "mediumorchid"
))

// Default color for nodes that don't match any community ID in the map
Define(defaultColor, "lightgrey")

// Apply the color based on community_id, using the map
@NodeStyle {
  color: Get(communityColors, Property(node, "community_id"), defaultColor)
}
The LLM generated the above code with a simple input:
"Switch-Case is not supported, can you create the same with
AsMapandGetbuilt-in functions?".
Next Steps
What really helps understand new languages is a great quick start and many examples. A reference guide is a must-have as a fallback to get all the specifics and details of each built-in object. This won't just help the LLM, but humans too. Who would say we would make statements like these in 2024.
Graph Style Script (GSS) is a powerful language used to visualize and style graphs in Memgraph Lab, and it offers endless opportunities to create new functions with new styling rules. We are actively improving the language, and we will add more examples covering some common patterns and best practices.
If you haven't already, check out Memgraph and Memgraph Lab and give GSS a try, with or without LLM. Let us know how it is going, and feel free to share the great visualization you create. If you want to dig deeper into the creation of the GSS language, check the blog post on how we integrated custom CSS-like language.