
How to Choose a Graph Database for Your Real-Time Application
Graph databases are a powerful tool to analyze high volumes of highly connected data. Alongside batch processing, graph databases can execute real-time analytics on streaming data by using graph algorithms and queries. But what does real-time even mean, and how it fits into the context of graph databases?
Real-time software can differ widely from use case to use case. From Formula 1 real-time implementations with extremely high velocity to simple food delivery real-time alert systems. In general, real-time software is built with time requirements in mind and should be as responsive as possible. The exact definition of time requirement is defined by the use case. In F1, data is changing in milliseconds, which means tens of milliseconds are considered real-time, while in food delivery, events happen in seconds, which means seconds are considered real-time. It may not seem much of a difference from milliseconds to seconds, but from an engineering perspective, the difference is huge. Lowering time requirements under a second requires a lot of engineering effort. In general, a use case is considered to require real-time analytics if the changes need to be observed frequently, in most cases, in intervals under 1 second.
Another important aspect of real-time software is the value of information which is at its highest the moment a certain event occurs and a change happens. The F1 team finds it important to notice an opportunity or issue as soon as possible, and in the food delivery case, you can plan your evening depending on the estimated food delivery time based on delivery updates. If users face latency, the information loses value and the real.time software becomes useless. Delivering important information within the right time limits, aka in real-time, on a huge scale of data can be a challenging engineering effort.
Graph analytics that yields data-driven actions and recommendations can be a part of real-time systems and serve analytics to provide users with relevant information. As a bunch of different components will be built on top of that database, its impact on the whole chain should be as minimal as possible.
There are several graph databases to choose from, and this blog post will consider Memgraph and Neo4j as possible vendors for a real-time solution. These graph databases were chosen since they both have great interoperability. First, let’s see what metrics define what graph database could be a good fit for real-time use cases.
Real-time solutions require low latency and high throughput
Real-time software infrastructure needs to be able to serve a bunch of analytical dashboard applications and front-facing user applications under time-defined time restrictions. This means application infrastructure must have the lowest possible latency because unwanted latencies can creep in as data volume, number of clients or workload increases. This means infrastructure should be optimized for the worst-case scenario from the start of the project development. Latency value represents the ability of the software infrastructure to respond to certain types of events or requests within the defined time limit or lower.
Latency can be introduced in many different components of infrastructure. The first and most important latency measurement is end-to-end latency. It represents the amount of time it takes for an event or request to be sent from the user and for a response to be received by the user. End-to-end latency is important because the time frame in which the user sends a request and receives an answer defines the value of a real-time product.
In real-time applications, end-to-end latency has an available time budget of less than a second, and it must be allocated very delicately. This means all components in the software infrastructure participating in the user request must take less than a second. This can include frontend latency, network latency, application latency, database latency etc., and it’s different with each use case. Each mentioned component can be broken down into several smaller subcomponents, which show the exact latency of each subcomponent.
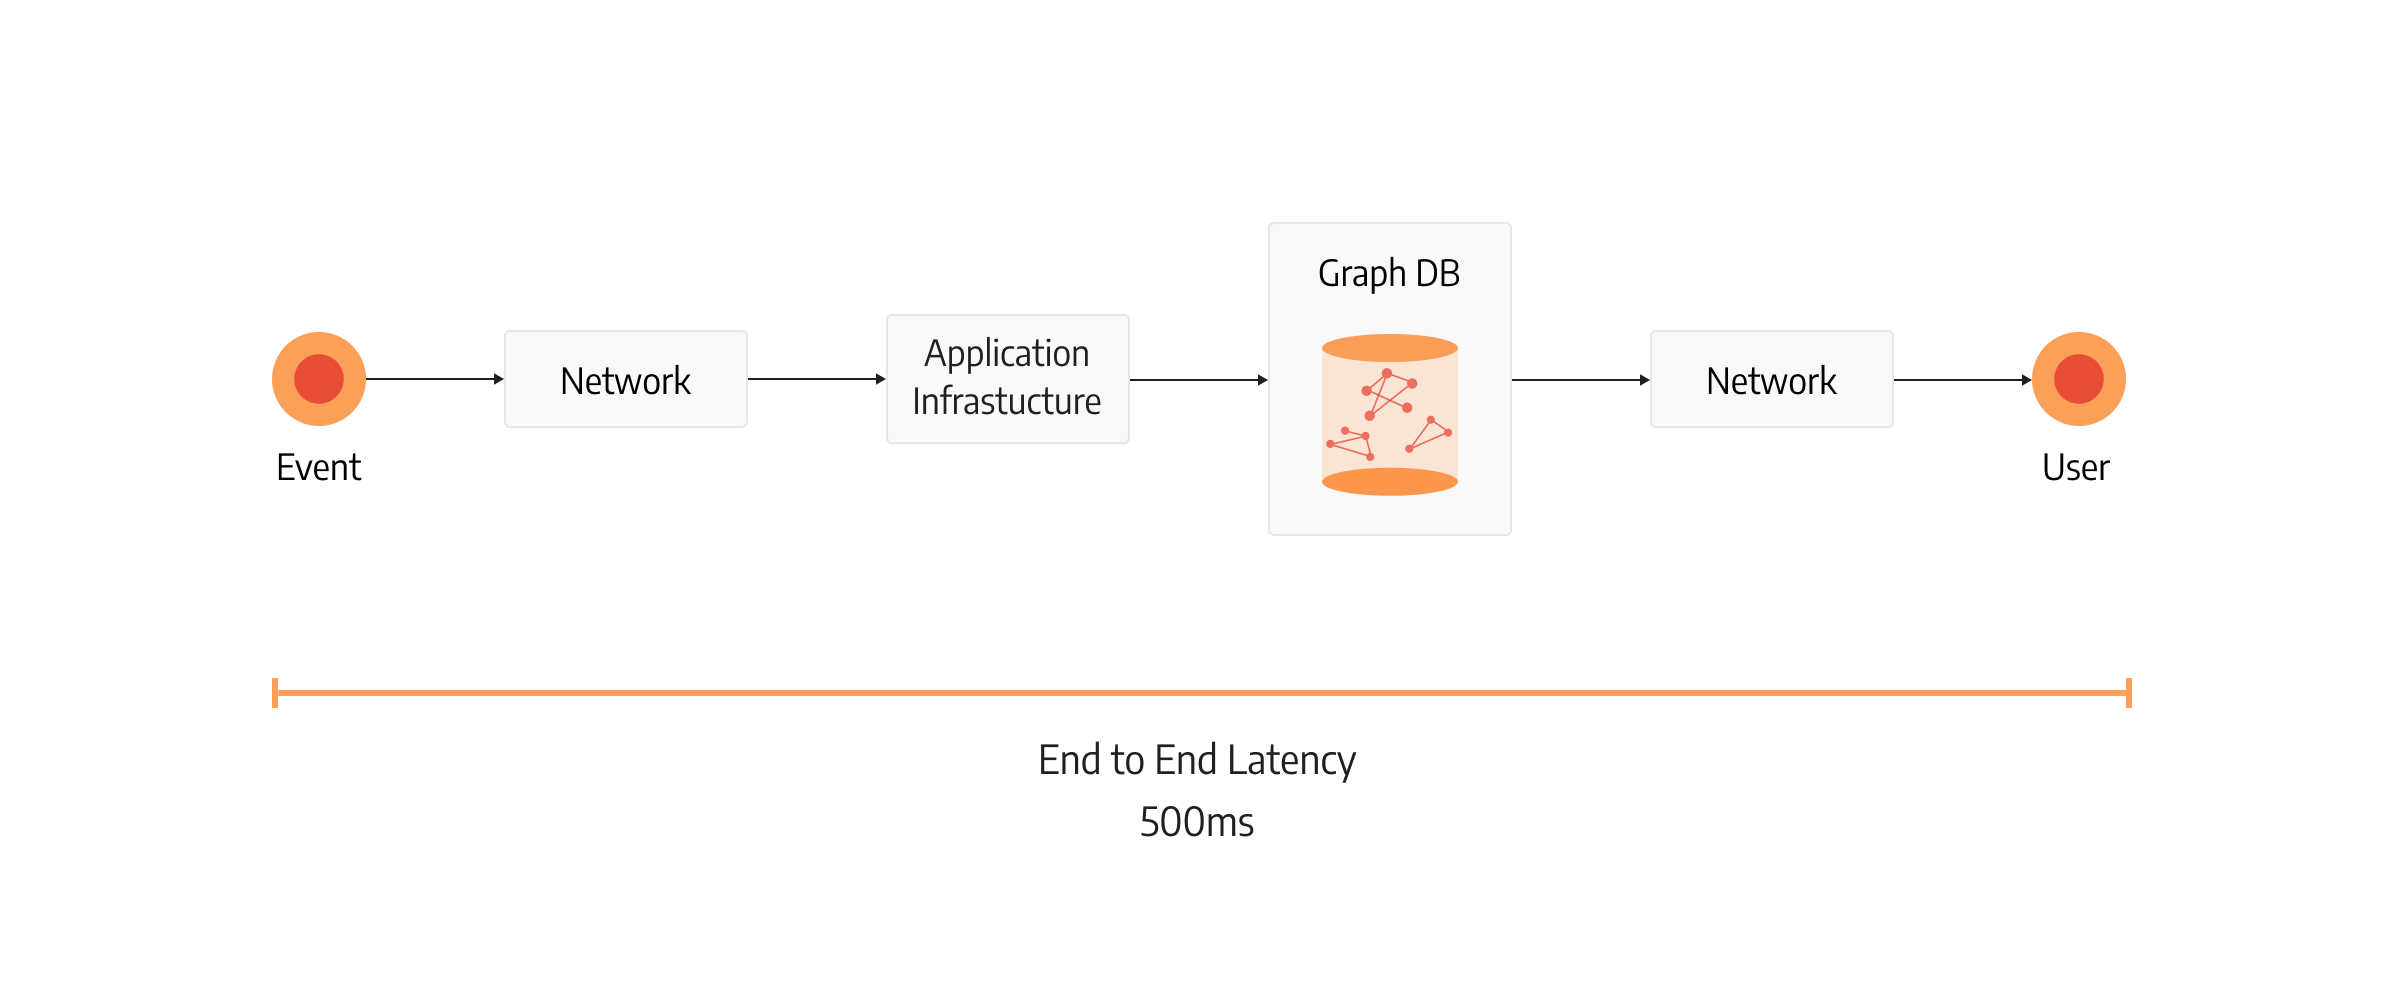
One of the components crucial for real-time analytical applications is database query latency, and querying large volumes of connected data can present technical challenges.
Let’s consider this example. A real-time application has an available time budget of 500 milliseconds. The total database query latency can accumulate just a fraction of it, let’s assume 10% or 50ms. That’s the worst-case upper limit. It would be perfect if the database could consume even less. If queries would take just 10ms, the rest of the end-to-end latency budget could be used by the other parts of the system or remain unallocated, resulting in more responsive infrastructure. Breaking the upper limit would mean the service is not functioning properly.
Even though the query latency should be low and under budget, it is not the only metric that indicates database performance. Measuring query latency on several queries without a heavy load on the database can give good latency results but poor scalability. This means the database is fast on serving one or a few users simultaneously. So how do we measure scalability?
The measurement that represents scalability is throughput. Throughput defines how many requests the database can serve per unit of time. Usually, it’s represented as queries per second (QPS). Simply speaking, throughput will represent how many user requests the database can handle per unit of time. If the database has more throughput, this means it can serve more users. Lower latency is usually correlated with high throughput, but it can also vary a lot due to different database implementations, but we'll discuss that in another post. That’s one of the reasons why it is important to measure throughput concurrently because real-time applications need to serve many users while preserving both latency and throughput.
Who is better for real-time software - Memgraph or Neo4j?
Both Memgraph and Neo4j are graph database vendors that you can use for graph analytics, but the question is - what vendor is a better fit for your real-time use case?
Memgraph and Neo4j are quite similar from an interoperability perspective - both databases use Bolt protocol and Cypher query language. But from the implementation perspective, Memgraph and Neo4j are architecturally completely different systems. What distinguishes them the most is that Neo4j is based on JVM, while Memgraph is written in native C++. To understand the performance limits of each vendor, we have been benchmarking Memgraph 2.4 and Neo4j 5.1 community editions. For a full report on all differences and how we executed this test, you can take a look at the performance comparison.
As mentioned, the most important metrics for real-time software are latency and throughput. It’s important to notice that latency is single-threaded, while throughput is calculated as the workload of 12 concurrent clients querying the database. The current benchmark configuration consists of 23 queries, each being of a different type - read, write, update, aggregate and analytical.
Latency
Let’s take a look at latency results in milliseconds for each of the queries:
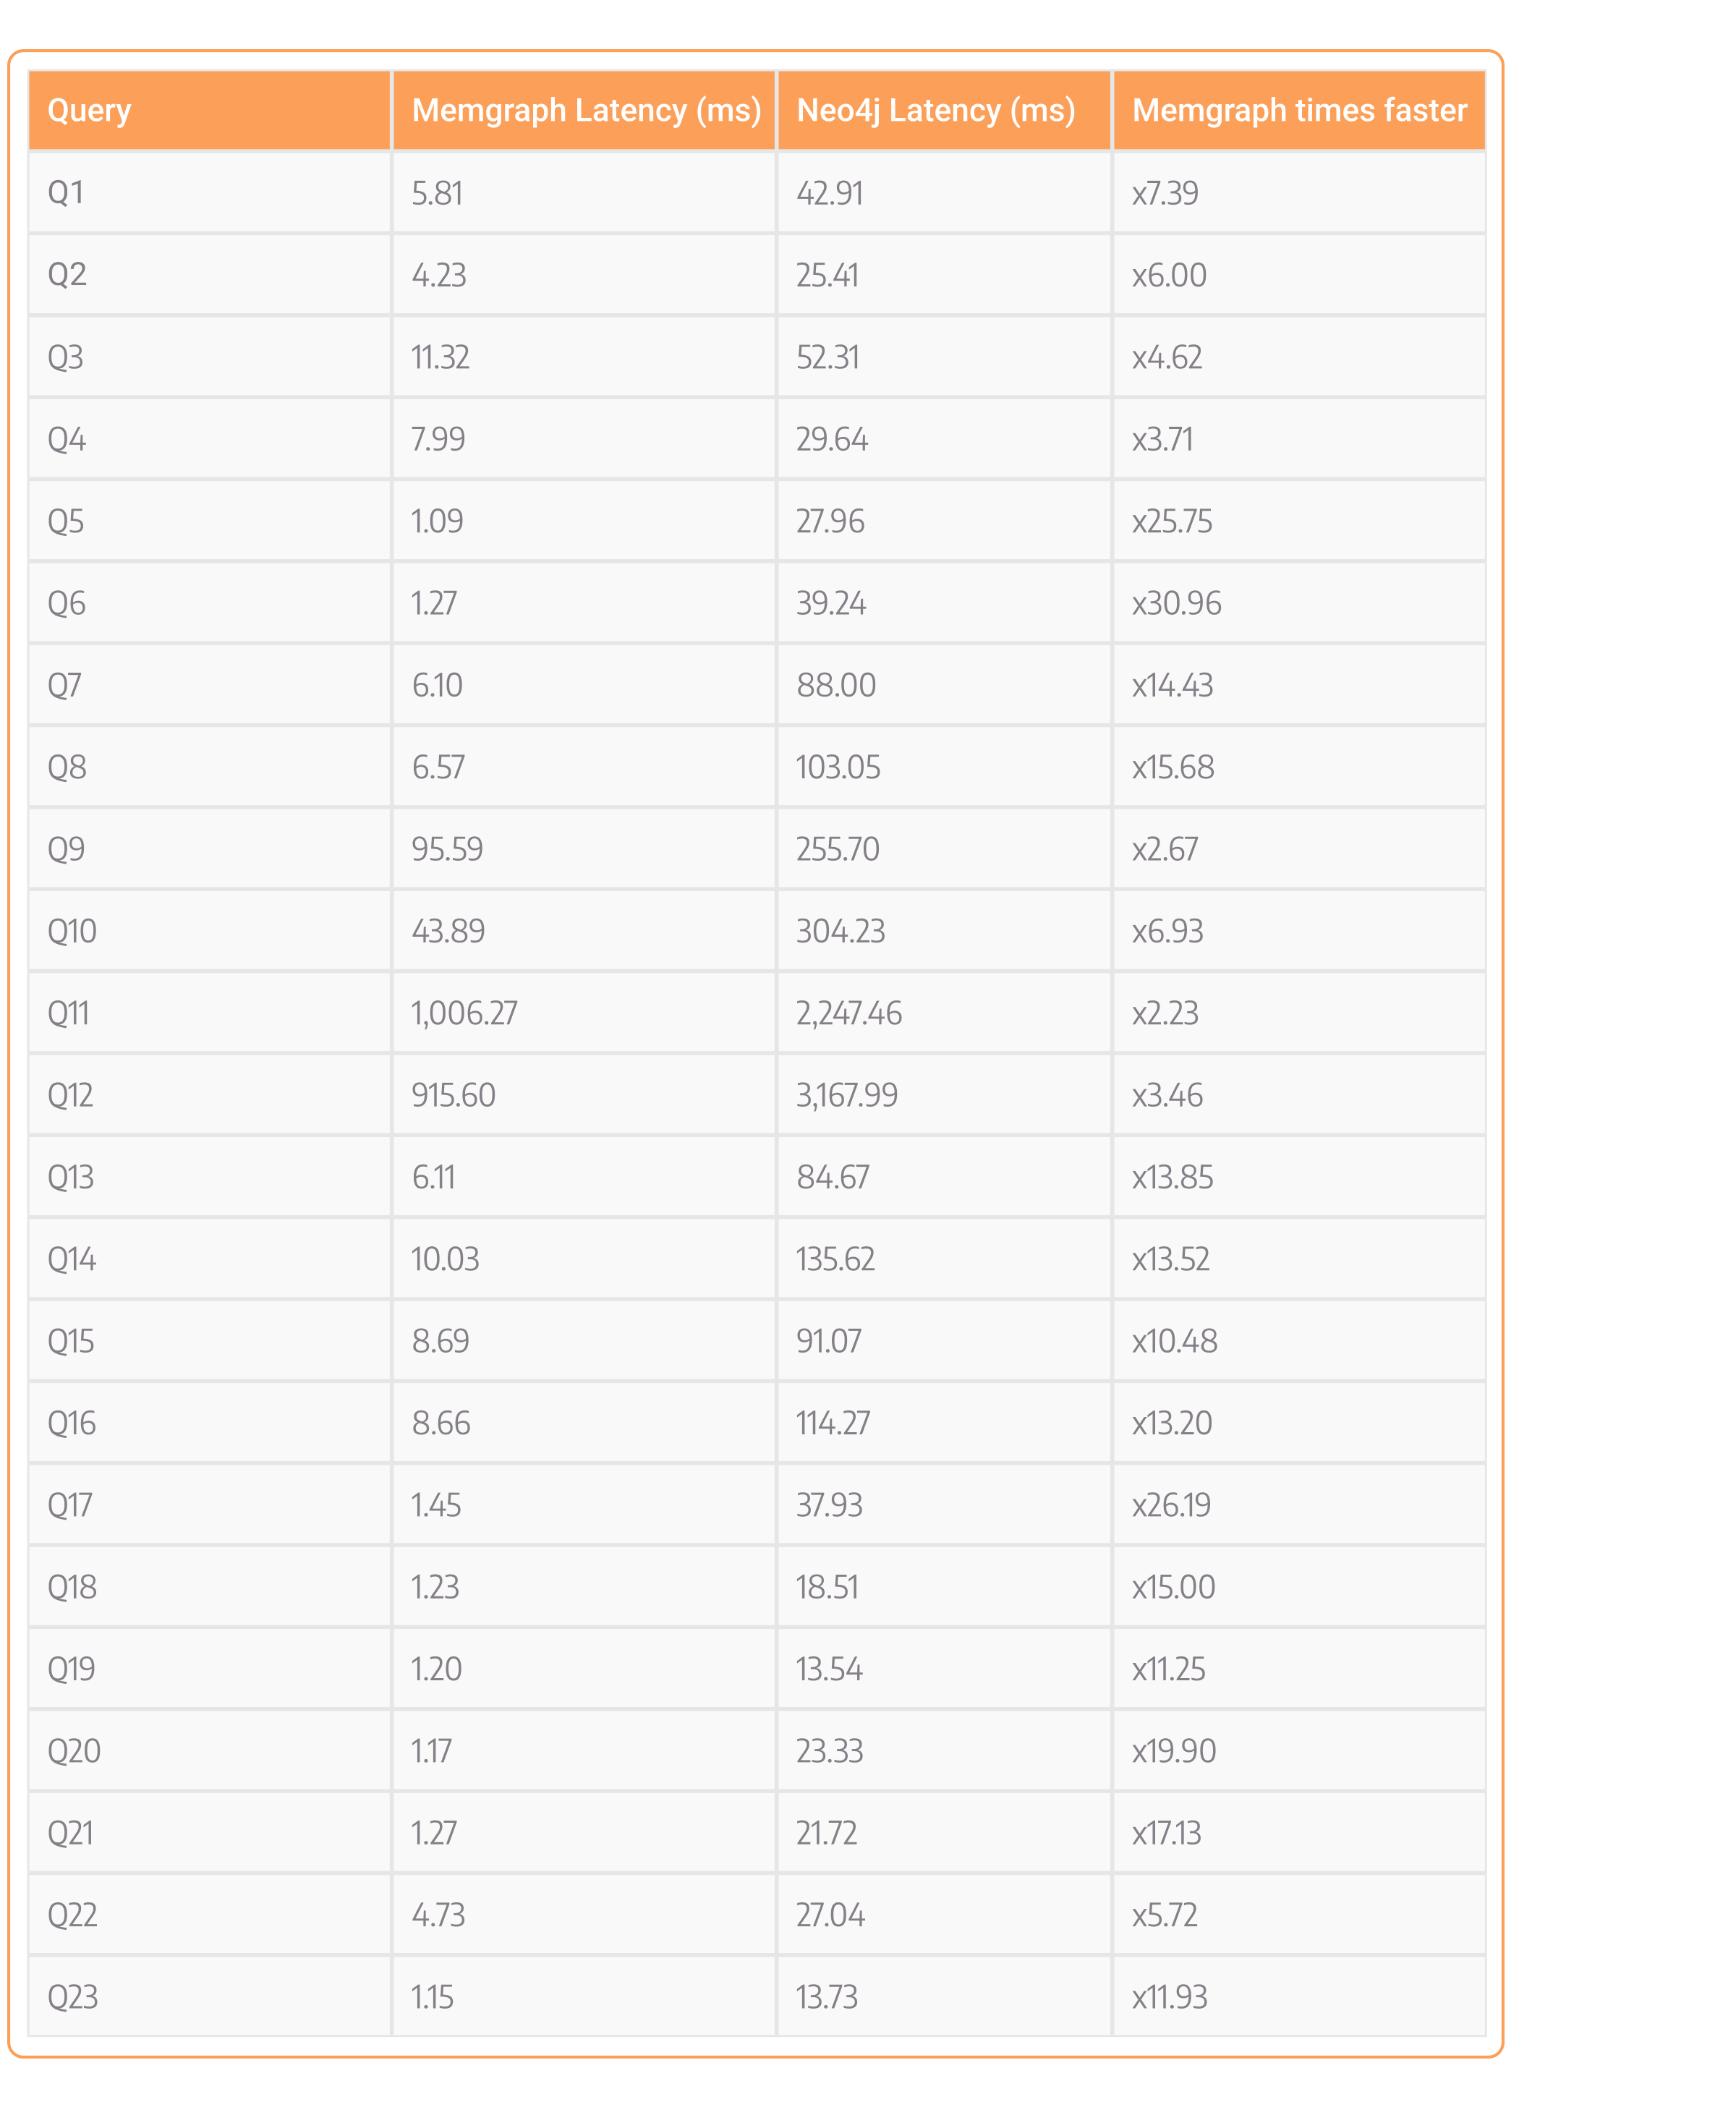
If you take a look at the last column, it shows how much faster Memgraph is at this specific query. By looking at the whole table, you can notice that Memgraph is faster across the board. The absolute values of latency across the whole table show that most of the queries executed with Memgraph took from 1.09 to 11.32 milliseconds with few exceptions. Outliers are queries Q9 to Q12, which are complex queries touching most of the dataset’s nodes and edges. With Neo4j, the queries were executed from 13 milliseconds to 135 milliseconds without the mentioned outliers.
Absolute query latency values on both vendors seem pretty low, but if the total end-to-end latency request budget is under 500 milliseconds and the database latency budget is 50 ms, which is a fair amount of time for real-time software, any query that is executed longer than that is out of budget and not a valid query for this real-time use case. For example, 84 milliseconds query is out of budget and not a valid query for a real-time use case. Just a side note, Google search results return values in approximately 400-700 milliseconds, you want your service to try to be responsive as Google search is.
One of the most interesting queries in any graph analytical workload is the expansion or K-hop queries. Expansion queries start from the target node and return all the connected nodes that are a defined number of hops away. Expansion queries are data intensive and pose a challenge to databases. Probably the most used expansion query is the one with a single hop. It’s an analytical query that is fairly cheap to execute and used a lot. This is query Q5 in the table:
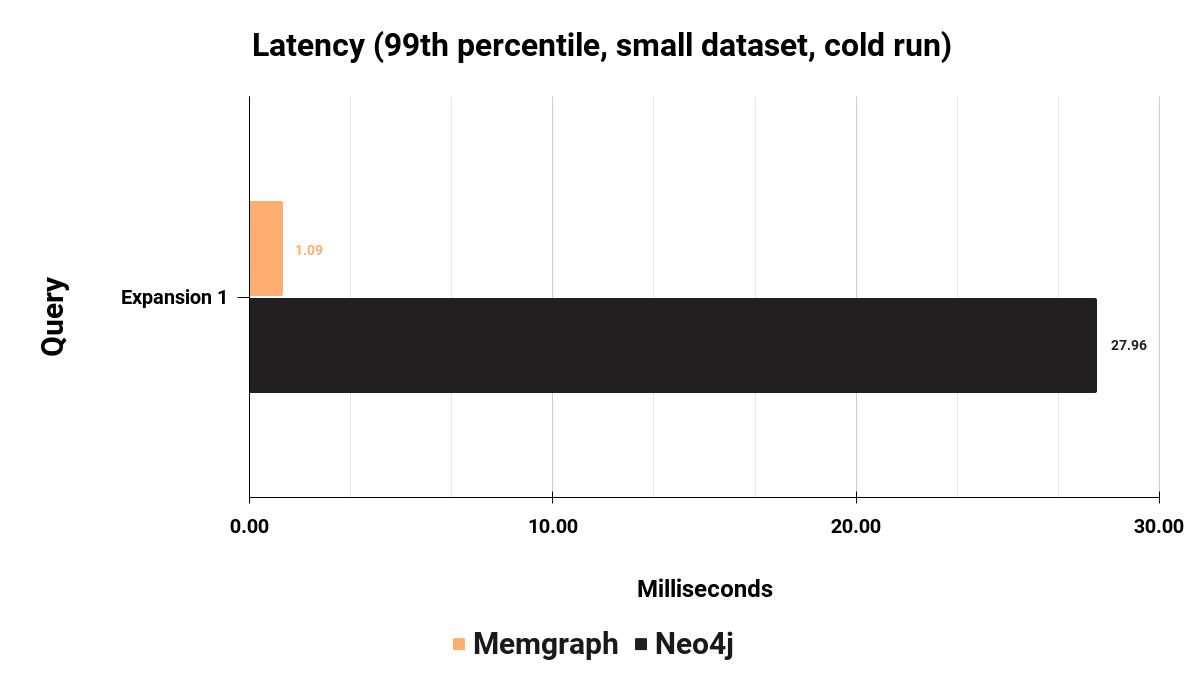
This specific query takes Memgraph 1.09 milliseconds to execute, while it takes Neo4j 27.96 milliseconds. If the time budget for database latency is 50 milliseconds, this means Memgraph is consuming 2.18% of the budget while Neo4j is consuming 55% of the budget.
Now let’s take a look at Q7, which is an expansion 2 query. It takes Memgraph 6.10 milliseconds to execute it and Neo4j 88 milliseconds. To execute this query, Memgraph uses 12.2% percent of the available time budget, while Neo4j uses 176% of the available time budget. Memgraph easily stays within the budget of 50ms. This is just an approximation of the possible budget for queries, of course, the budget depends on the real-time use case. But regardless of your budget, Memgraph will provide more space for future latency improvements.
Throughput
Obviously, completing a request under the budget is the best-case scenario, but this is just a part of the picture. The database should be able to serve multiple concurrent users at the same time. If there are thousands of users using the application at the same time, the database should perform similarly as in the case of a single user. This is where throughput comes into play. By measuring concurrent throughput, we can estimate how much of a particular query database can serve in a 1-second time frame. Here is the throughput for 4 different workloads. Each workload consists of multiple queries of read, write, update, and analytical types.
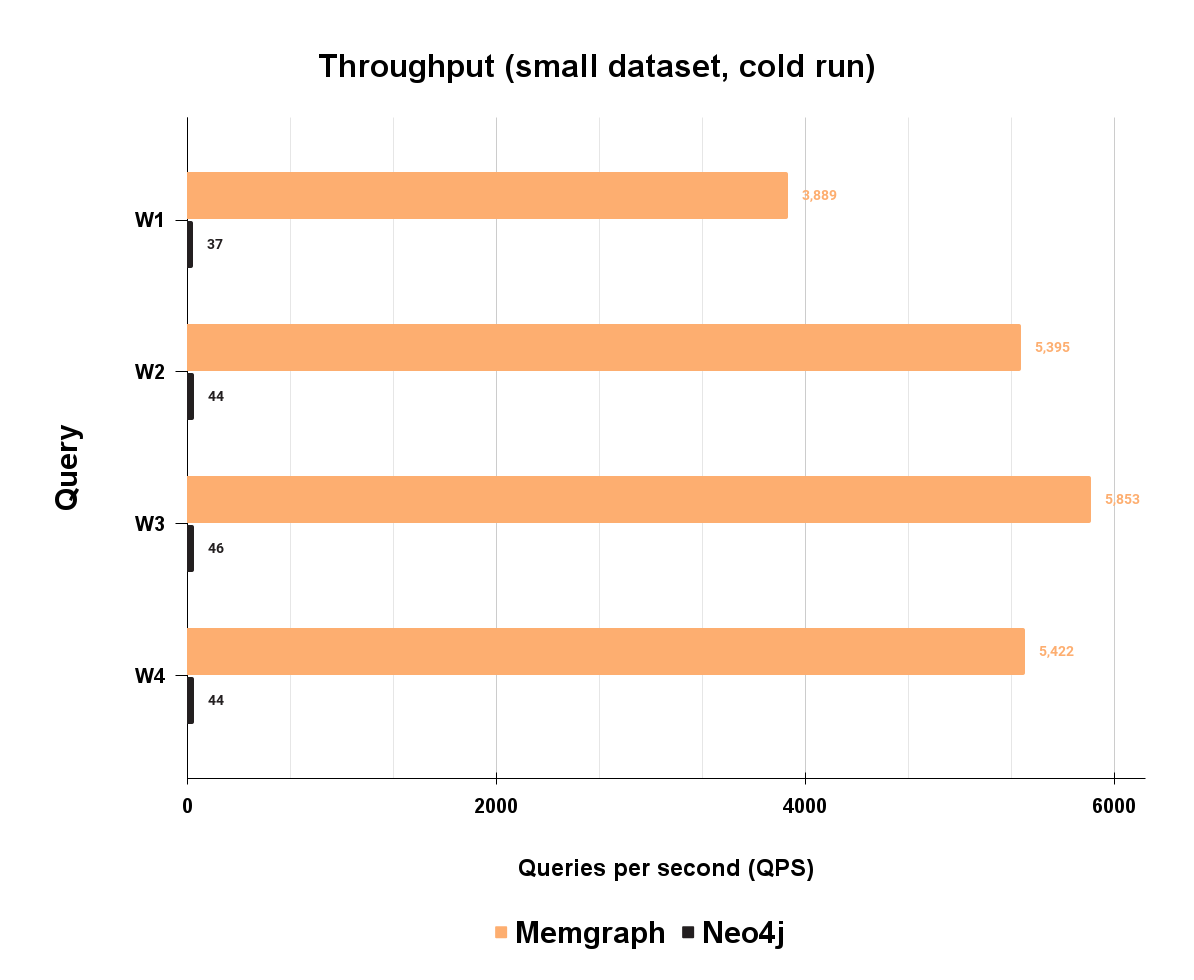
On workload W1, which is made of 20% analytical, 40% read, 10% update, and 30% write queries, Memgraph can handle 3.889 queries per second, while Neo4j can handle 37 queries per second. Handling a higher number of clients that are creating a request in the same time frame shows how capable the database is in handling bigger volumes of data in short bursts. This means that latency is not impacted by more concurrent clients, and performance is in line with latency values. As you can see on, Memgraph has a much higher throughput. This means that Memgraph is more scalable and can handle much faster large volumes of data needed for a real-time graph database.
Benefits and cost implications
Running all this software doesn’t cost much since both tested databases are open-source community editions and are available to the public for free, there is no direct cost to use the database. Of course, each vendor has its own enterprise editions of the database that you can pay for, but that is out of the scope of this blog post.
What you need to pay for is hosting these databases in production, and that can lead to hosting expenses. The hosting cost will correlate with CPU time, memory and storage usage. Take a look at the chart below to see memory usage for mentioned workloads:
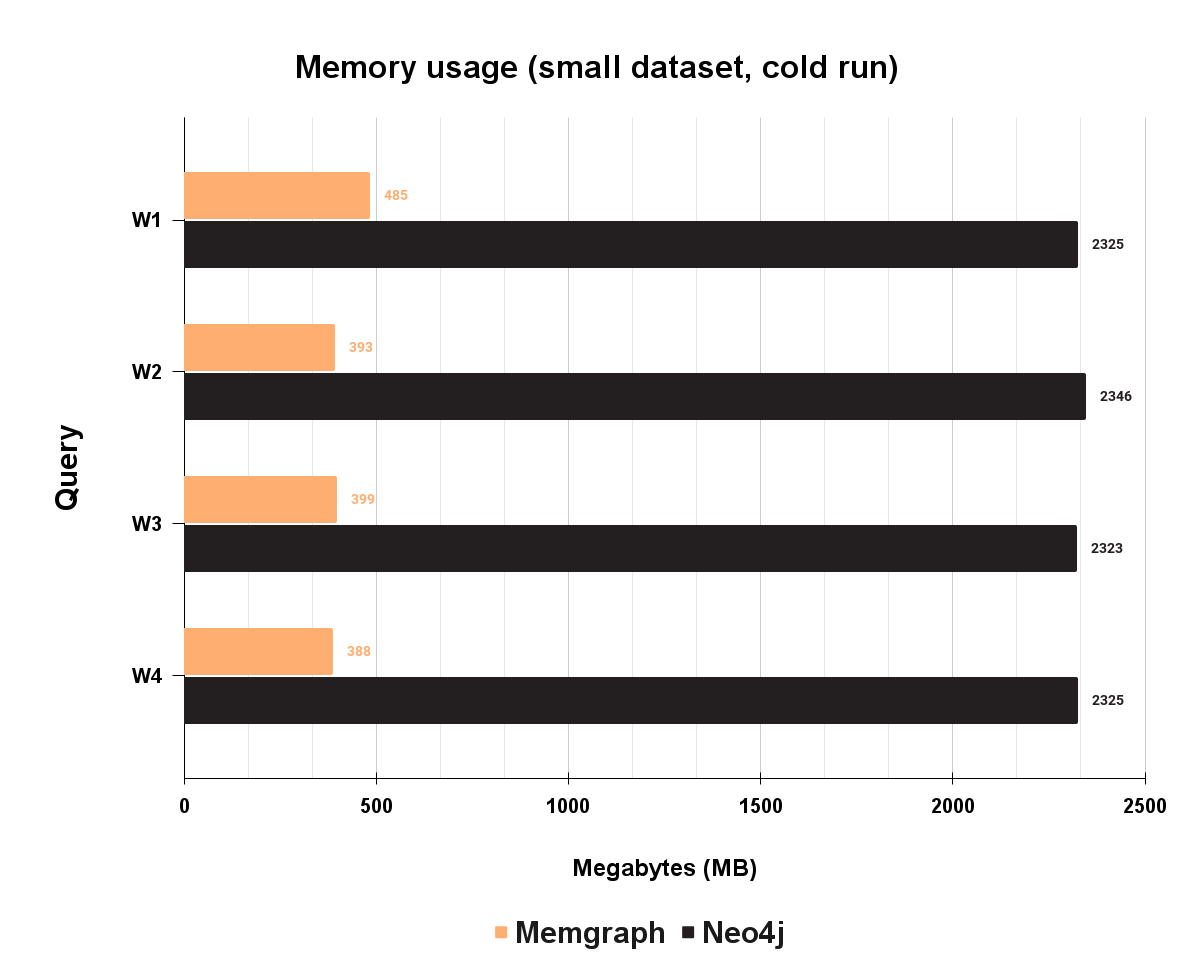
Even though Memgraph is a high-performant in-memory database, in some scenarios, Neo4j will actually consume more memory. At these four mixed workloads, Neo4j is paying the price for being based on JVM, which can have a lot of memory overhead. As seen on the chart, Neo4j uses up to 2.2GB of memory, while Memgraph uses around 400MB for the identical task. Neo4j will allocate quite large amounts of memory and use it only partially for caching, which leads to buying more expensive cloud virtual machines and making hosting more expensive.
Conclusion
Low latency and high throughput are key metrics when deciding whether a graph database can be considered capable of delivering real-time graph analytics. As benchmarking results show, Memgraph is quite a capable graph database, while Neo4j is also a capable graph database, just a few gears slower and a bit memory hungry in some scenarios. We would love to see what real-time application you want to develop with Memgraph. Take Memgraph for a test drive, check out our documentation to understand the nuts and bolts of how it works, or read more blogs to see a plethora of use cases using Memgraph. If you have any questions for our engineers or want to interact with other Memgraph users, join the Memgraph Community on Discord!