Exploring the European Gas Pipeline Network With Graph Analytics
How is Europe dependent on Russian natural gas?
With natural gas in low stock and energy prices soaring, Europe is continuing to experience an energy crisis. Prices of natural gas in European markets are four times higher than they were in the same period of last year [2], while the inventories of natural gas are at a 5-year low for this time period. [1] Worsened by the fact that the continent is experiencing a colder-than-expected winter and having been a bad year in terms of wind power generation, governments are trying to supplement their energy needs.
While an oil crisis might influence people’s ability to travel and commute, if gas were to run out, the consequences would be catastrophic. From heating homes to powering industrial production, our dependence on natural gas at this point in time is staggering. The oil market is also different because it is global, and you can easily substitute imports. Through this article, we will explore the European gas infrastructure network, its dependence on Russian imported natural gas, and comment on how a possible gas shortage could be mitigated by other energy sources.
Russian pipeline export routes
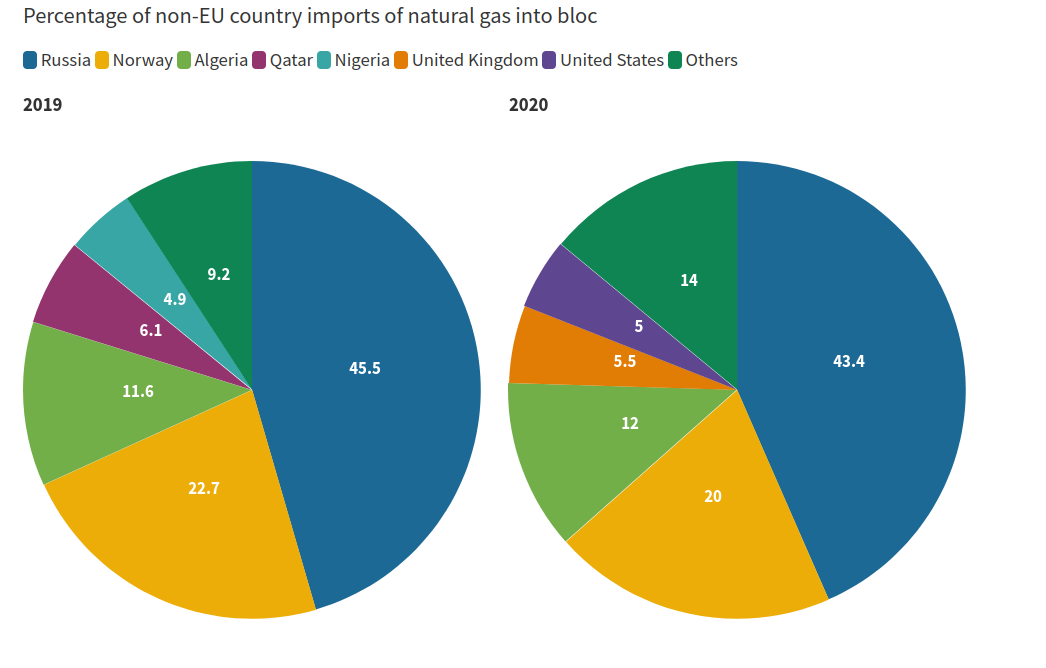
European nations have been phasing out their production capacities over the past decades and are becoming increasingly reliant on imported gas from outside the bloc. In 2019., nearly 90% of the EU’s natural gas was imported, according to Eurostat. Of the imports from outside the EU, Russia represented the biggest share, 43.4%. [2]
Using our dataset, we can visualize Russia’s import pipeline capacities [3]. Included is the still unopened Nord Stream 2 pipeline, which, announced in 2015, was to connect western Siberia to Germany and assure guaranteed supply to the European energy market. The pipeline was to bypass Ukraine, through which the majority of imported natural gas used to run, helping their economy. Ahead of growing tensions in the area and Russia’s invasion of Ukraine, the plans for Nord Stream 2 have been put on ice.
What does this mean for Europe’s energy crisis? Nord Stream 2 could have, in theory, helped European gas reserves, but it would also add to Europe’s dependence on Russia. What would happen should Russia constrict, or completely stop, exporting natural gas to Europe? How could European governments decouple from this dependence?
European gas network dataset
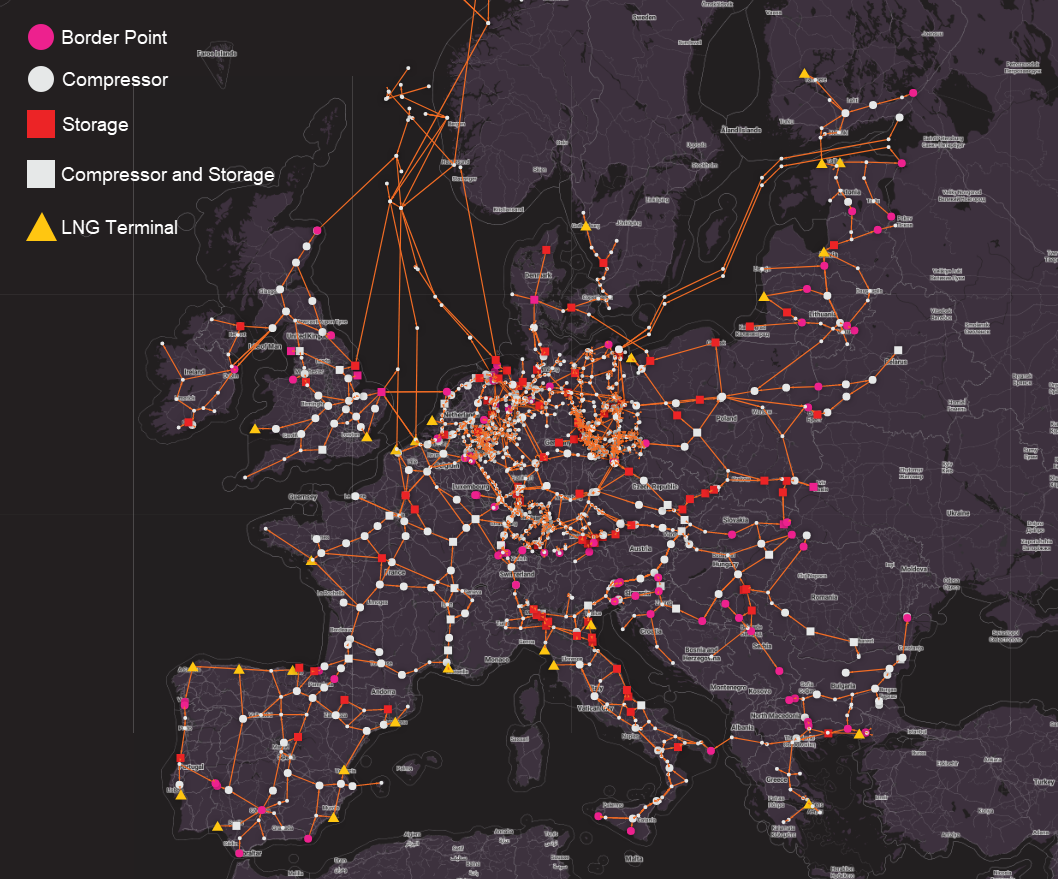
SciGRID_gas is a project initiated by the DLR Institute for Networked Energy Systems [4], whose goal is to create a complete and automated network model of the European gas transportation network. We can use Memgraph’s graph analytics capabilities to visualize and extrapolate from the data. Pictured below is the entire network, with all production, storage and distribution capacities.
Liquid Natural Gas as an alternative
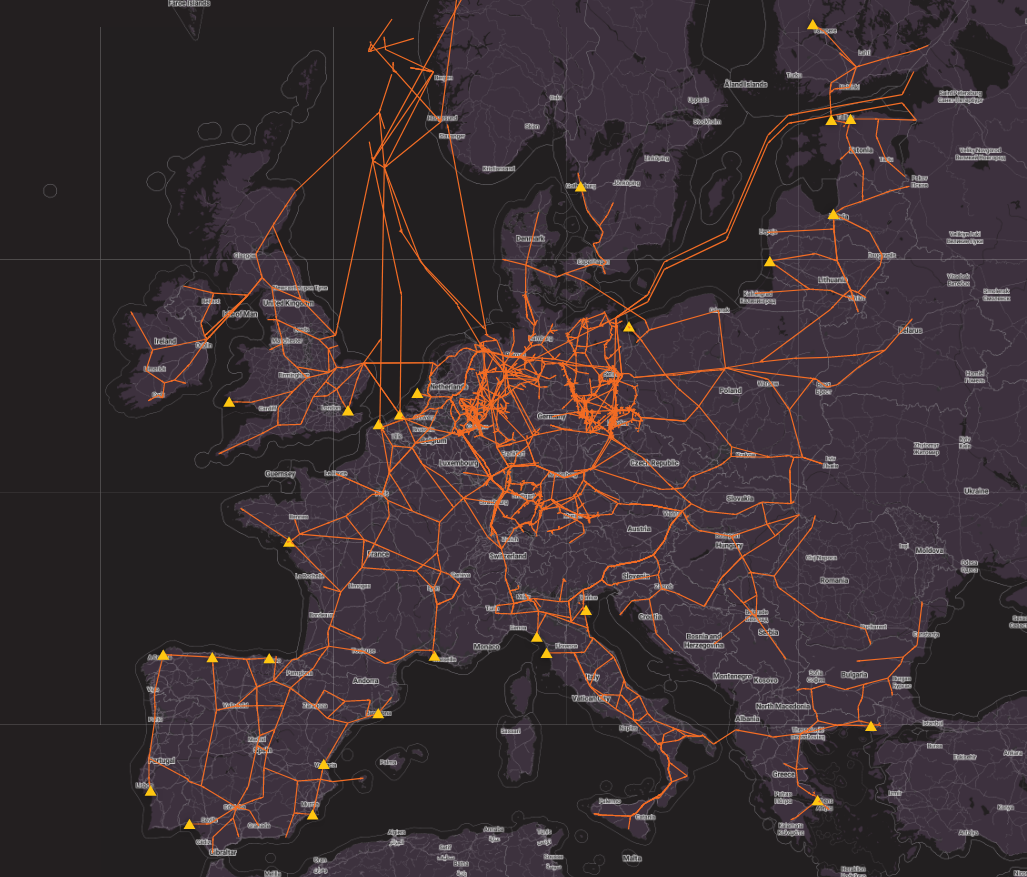
One alternative is LNG, gas which is cooled to liquid form and can thus be exported in huge ships. When ships reach their destination, the liquid can be turned back into gas and transported using the existing network. This could diversify Europe’s dependence, given that the US is the world’s largest exporter of LNG.
The infrastructure and capacity of LNG terminals are there. Using our dataset in Memgraph, we can quickly calculate the total capacity of European LNG terminals. Shown on the map below, combined, these LNG terminals have a yearly capacity equivalent to 65.6% of the total EU natural gas consumption in 2020. [5]
But, aside from the rising prices of LNG, the International Energy Agency reports that the ramped-up production of American energy firms may not be enough to bail out Europe should Russia stop their supply. In the short term, LNG would not be able to fully compensate for any natural gas shortfall from Russia, citing a lack of free short-term capacity among exporters like the US and Qatar. [1]
Conclusion
With low reserves and rising import prices, energy prices in Europe are soaring, and with the ongoing Ukrainian crisis, the future certainly doesn't look bright. In order to better understand the gas and energy infrastructure, we can model the data using graphs and draw conclusions using graph algorithms. Applying such analytics can help us prepare for potential disruptions and mitigate worst-case scenarios.
If you want to try European Gas Pipeline Network for yourself, please check Memgraph Demo on Playground (no installation or registration needed). Explore our guides, samples and references on Memgraph Docs and if you have any questions, join our growing Community and share your projects with us.
References
[1] https://www.dw.com/en/could-lng-help-boost-european-energy-security-if-russia-turns-off-the-taps/a-60490682
[2] https://www.euronews.com/2022/02/11/europe-s-energy-crisis-five-charts-to-explain-why-your-bills-might-go-up-this-winter
[3] http://www.gazpromexport.ru/en/projects/transportation/
[4] https://www.gas.scigrid.de/
[5] https://www.statista.com/statistics/265406/natural-gas-consumption-in-the-eu-in-cubic-meters/
Dataset References
- J.C. Diettrich, A. Pluta, W. Medrjoubi SciGRID_gas: The merged IGGINL data set DLR Institute for Networked Energy Systems Germany
- Kunz et al. 2017, Data Documentation: Electricity, Heat, and Gas Sector Data for Modeling the German System
- Gassco AS, The Norwegian Ministry of Petroleum and Energy www.norskpetroleum.no