Introduction to Benchgraph and its Architecture
Building a performant graph database comes with many different challenges, from architecture design, to implementation details, technologies involved, product maintenance — the list goes on and on. And the decisions made at all of these crossroads influence the database performance.
Developing and maintaining a product is a never-ending phase. And proper performance testing is necessary to maintain database performance characteristics during its whole lifecycle.
This is where benchgraph comes into play. To ensure the consistency of Memgraph’s performance, tests are run via benchgraph, Memgraph's in-house benchmarking tool. On each commit, theCI/CD infrastructure runs performance tests to check how each code change influenced the performance. Let’s take a look at benchgraph architecture.
Benchgraph architecture
At the moment, benchgraph is a project under Memgraph repository (previously Mgbench). It consists of Python scripts and a C++ client. Python scripts are used to manage the benchmark execution by preparing the workload, configurations, and so on, while the C++ client actually executes the benchmark.
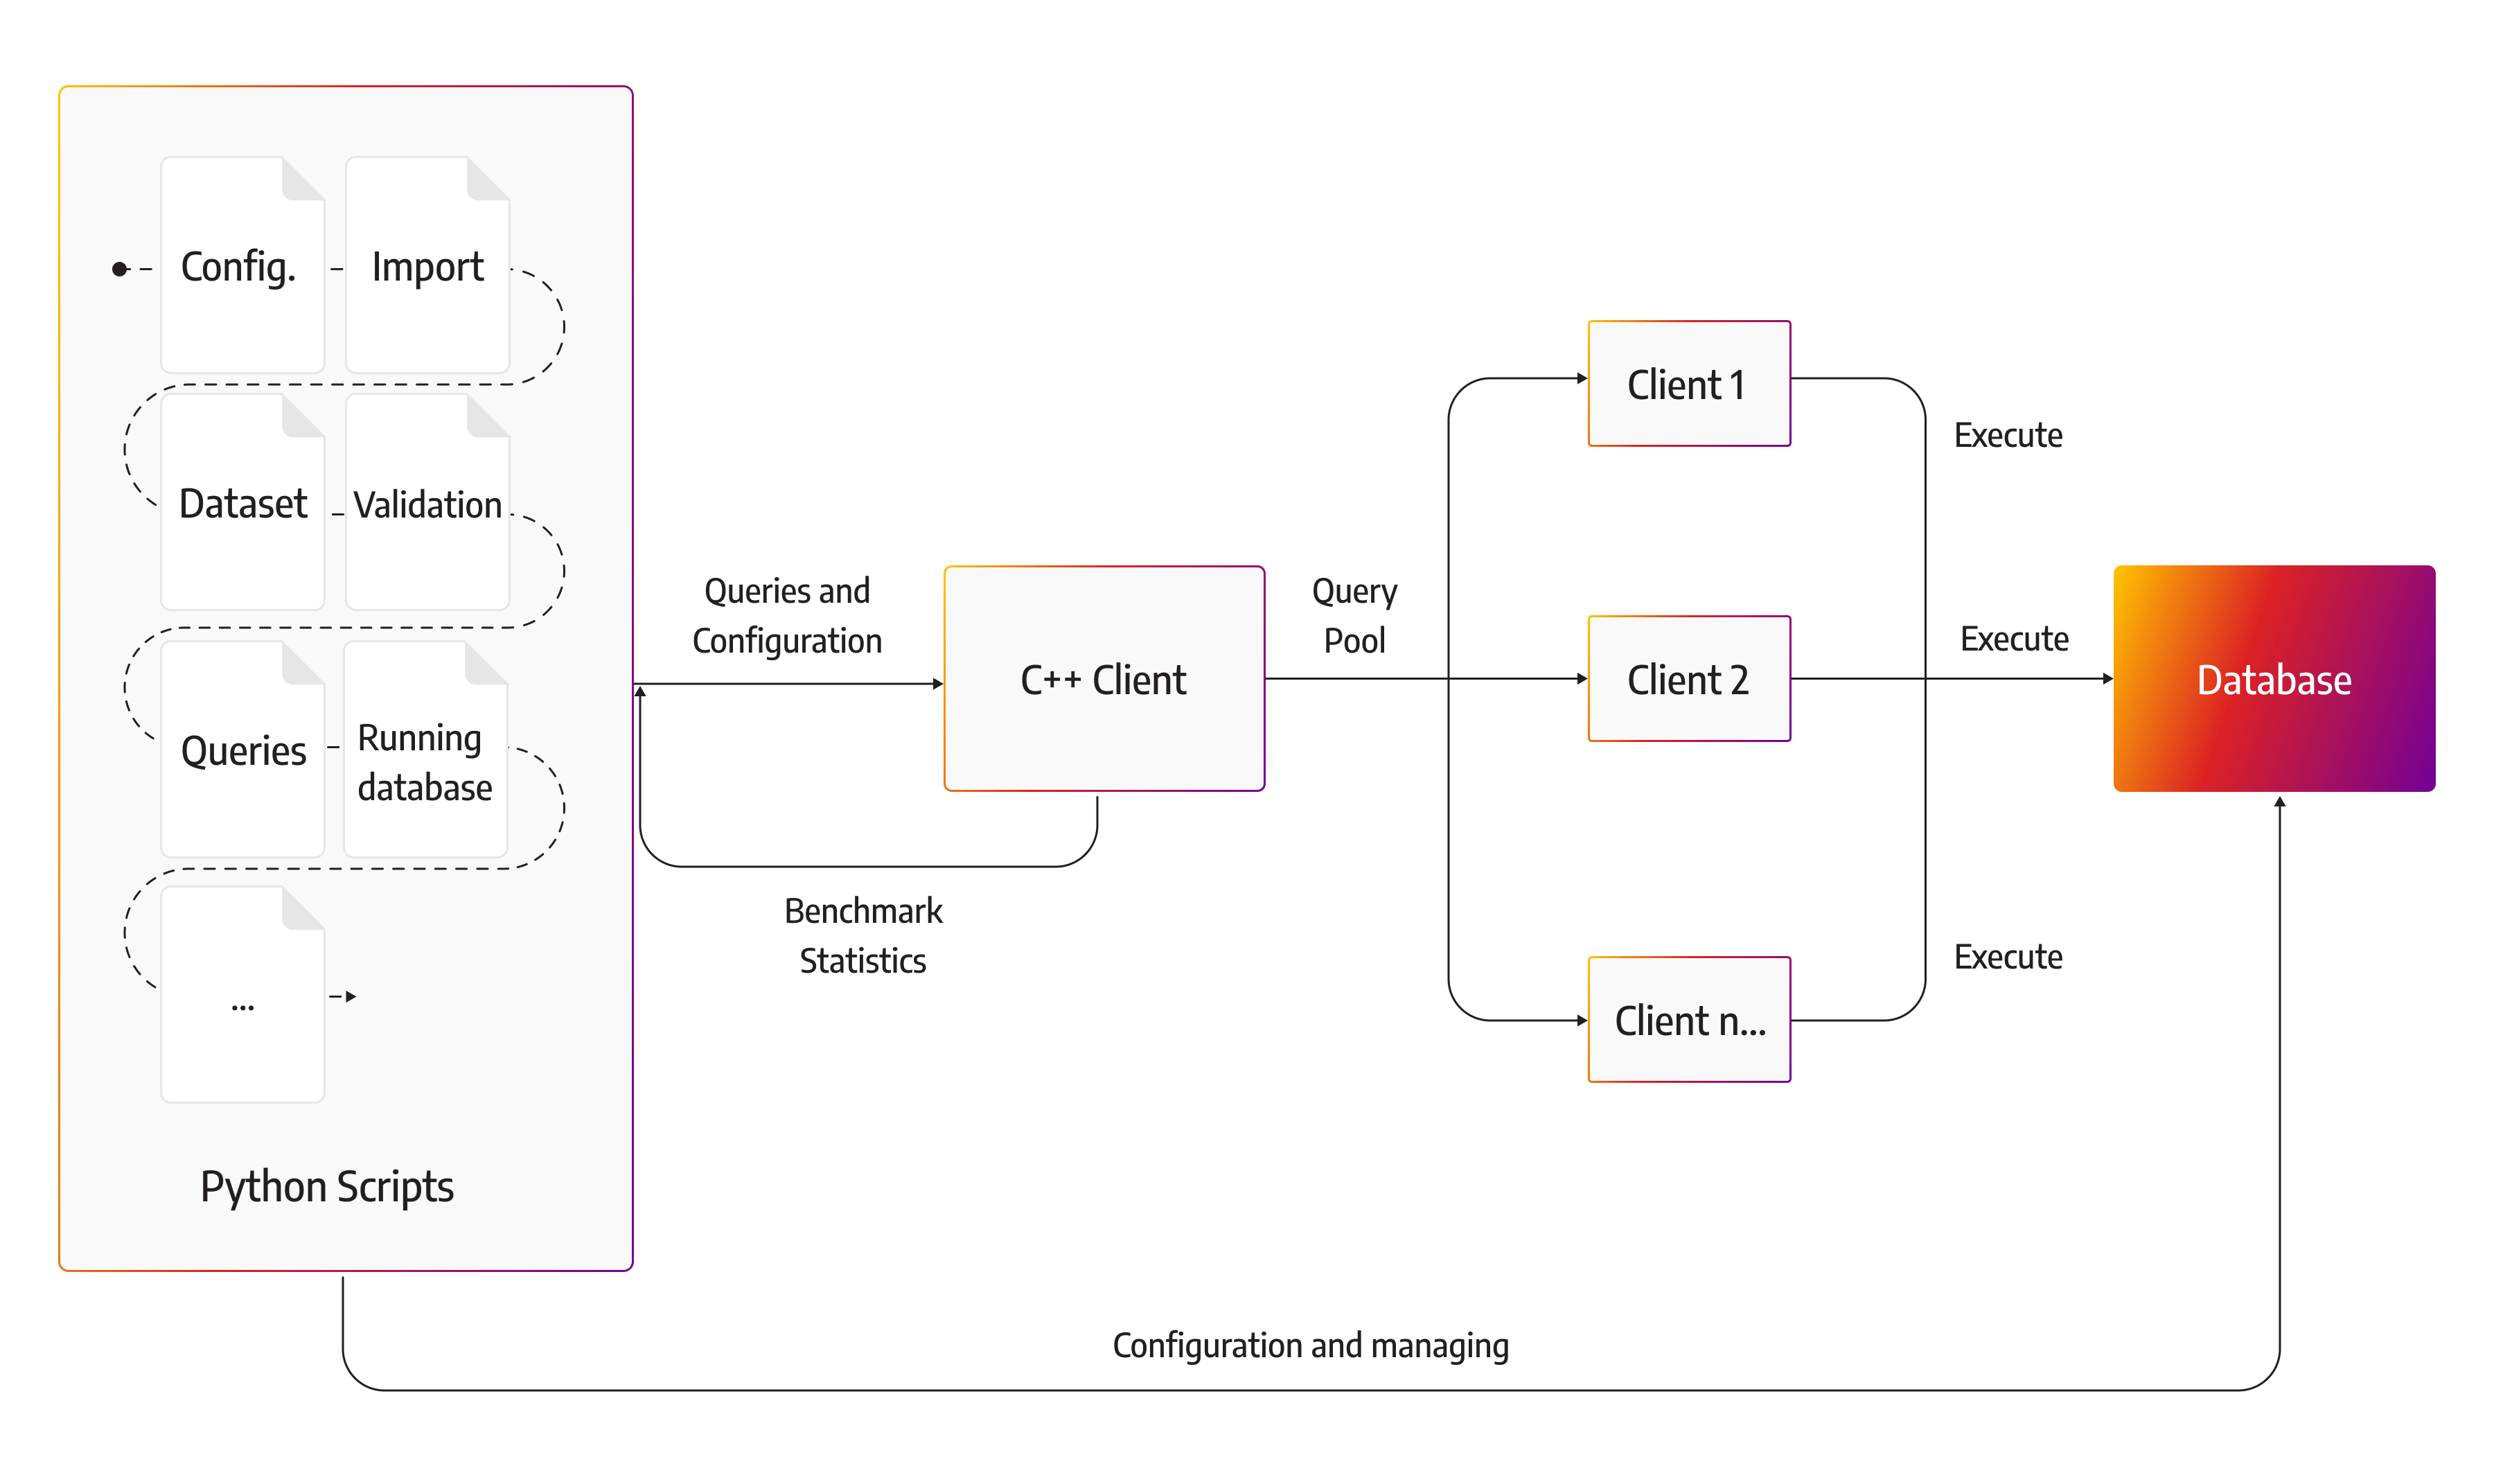
Some of the more important Python scripts are:
- benchmark.py - The main entry point used for starting and managing the execution of the benchmark. This script initializes all the necessary files, classes, and objects. It starts the database and the benchmark and gathers the results.
- runners.py - The script that configures, starts, and stops the database.
- benchmark_context.py - It gathers all the data that can be configured during the benchmark execution.
- base.py - This is the base workload class. All other workloads are subclasses located in the workloads directory. For example, ldbc_interactive.py defines ldbc interactive dataset and queries (but this is NOT an official LDBC interactive workload). Each workload class can generate the dataset, use custom import ofthe dataset or provide a CYPHERL file for the import process.
- compare_results.py - Used for comparing results from different benchmark runs.
The C++ bolt benchmark client has its own set of features. It runs over the Bolt protocol and executes Cypher queries on the targeted database. It supports validation, time-dependent execution, and running queries on multiple threads.
Let’s dive into benchmark.py, runners.py, and the C++ client a bit further.
benchmark.py
The benchmak.py script is filled with important details crucial for running the benchmark, but here is just a peek at a few of them.
All arguments are passed and interpreted in the benchmark.py script. For example, the following snippet is used to set the number of workers that will import the data and execute the benchmark:
…
benchmark_parser.add_argument(
        "--num-workers-for-import",
        type=int,
        default=multiprocessing.cpu_count() // 2,
        help="number of workers used to import the dataset",
    )
    benchmark_parser.add_argument(
        "--num-workers-for-benchmark",
        type=int,
        default=1,
        help="number of workers used to execute the benchmark",
    )
…
In the procedure that generates the queries for the workload, you can set up the seed for each specific query. As some arguments in the queries are generated randomly, the seed ensures that the identical sequence of randomly generated queries is executed.
def get_queries(gen, count):
    # Make the generator deterministic.
    random.seed(gen.__name__)
    # Generate queries.
    ret = []
    for i in range(count):
        ret.append(gen())
    return ret
The following methods define how warmup, the mixed, and realistic workload are executed and how the query count is approximated.
def warmup(...):
	…

def mixed_workload(...):
          …

def get_query_cache_count(...):
…runners.py
The runners.py script manages the database, and the C++ client executes the benchmark. Runners script can manage both native Memgraph and Neo4j, as well as Docker Memgraph and Neo4j.
Vendors are handled with the following classes; of course, implementation details are missing:
class Memgraph(BaseRunner):
	…
class Neo4j(BaseRunner):
	…
class MemgraphDocker(BaseRunner):
	…
 class Neo4jDocker(BaseRunner)
	…
Keep in mind that the Docker versions have a noticeable performance overhead compared to the native versions.
The C++ Bolt client executing benchmarks can also be managed in the native and Docker form.
class BoltClient(BaseClient):
	…
class BoltClientDocker(BaseClient):
	…
C++ Bolt client
The other important piece of code is the C++ bolt client. The client is used for the execution of the workload. The workload is specified as a list of Cypher queries. The client can simulate multiple concurrent connections to the database. The following code snippet initializes a specific number of workers and connects them to the database:
for (int worker = 0; worker < FLAGS_num_workers; ++worker) {
    threads.push_back(std::thread([&, worker]() {
      memgraph::io::network::Endpoint endpoint(FLAGS_address, FLAGS_port);
      memgraph::communication::ClientContext context(FLAGS_use_ssl);
      memgraph::communication::bolt::Client client(context);
      client.Connect(endpoint, FLAGS_username, FLAGS_password);
…
By using multiple concurrent clients, the benchmark simulates different users connecting to the database and executing queries. This is important because you can simulate how your database handles higher data loads.
Each worker's latency values are collected during execution, and after that, some basic tail-latency values are calculated.
…
 for (int i = 0; i < FLAGS_num_workers; i++) {
    for (auto &e : worker_query_latency[i]) {
      query_latency.push_back(e);
    }
  }
  auto iterations = query_latency.size();
  const int lower_bound = 10;
  if (iterations > lower_bound) {
    std::sort(query_latency.begin(), query_latency.end());
    statistics["iterations"] = iterations;
    statistics["min"] = query_latency.front();
    statistics["max"] = query_latency.back();
    statistics["mean"] = std::accumulate(query_latency.begin(), query_latency.end(), 0.0) / iterations;
    statistics["p99"] = query_latency[floor(iterations * 0.99)];
    statistics["p95"] = query_latency[floor(iterations * 0.95)];
    statistics["p90"] = query_latency[floor(iterations * 0.90)];
    statistics["p75"] = query_latency[floor(iterations * 0.75)];
    statistics["p50"] = query_latency[floor(iterations * 0.50)];

  } else {
    spdlog::info("To few iterations to calculate latency values!");
    statistics["iterations"] = iterations;
  }
…
For the rest of the details about all the components mentioned above and used in Memgraph’s CI/CD, feel free to refer to the code base.
Benchgraph benchmark process
Each benchmark has a set of rules or steps it follows to get benchmark results, such as duration of the benchmark, query variety, restarting a database, and similar. Benchgraph has its own set of running specifics. The benchmark process is also explained in the benchgraph methodology but for running a benchgraph. It’s important to understand each step well because each step influences benchmark results. The image below shows the key steps in running a benchmark with Benchgraph:
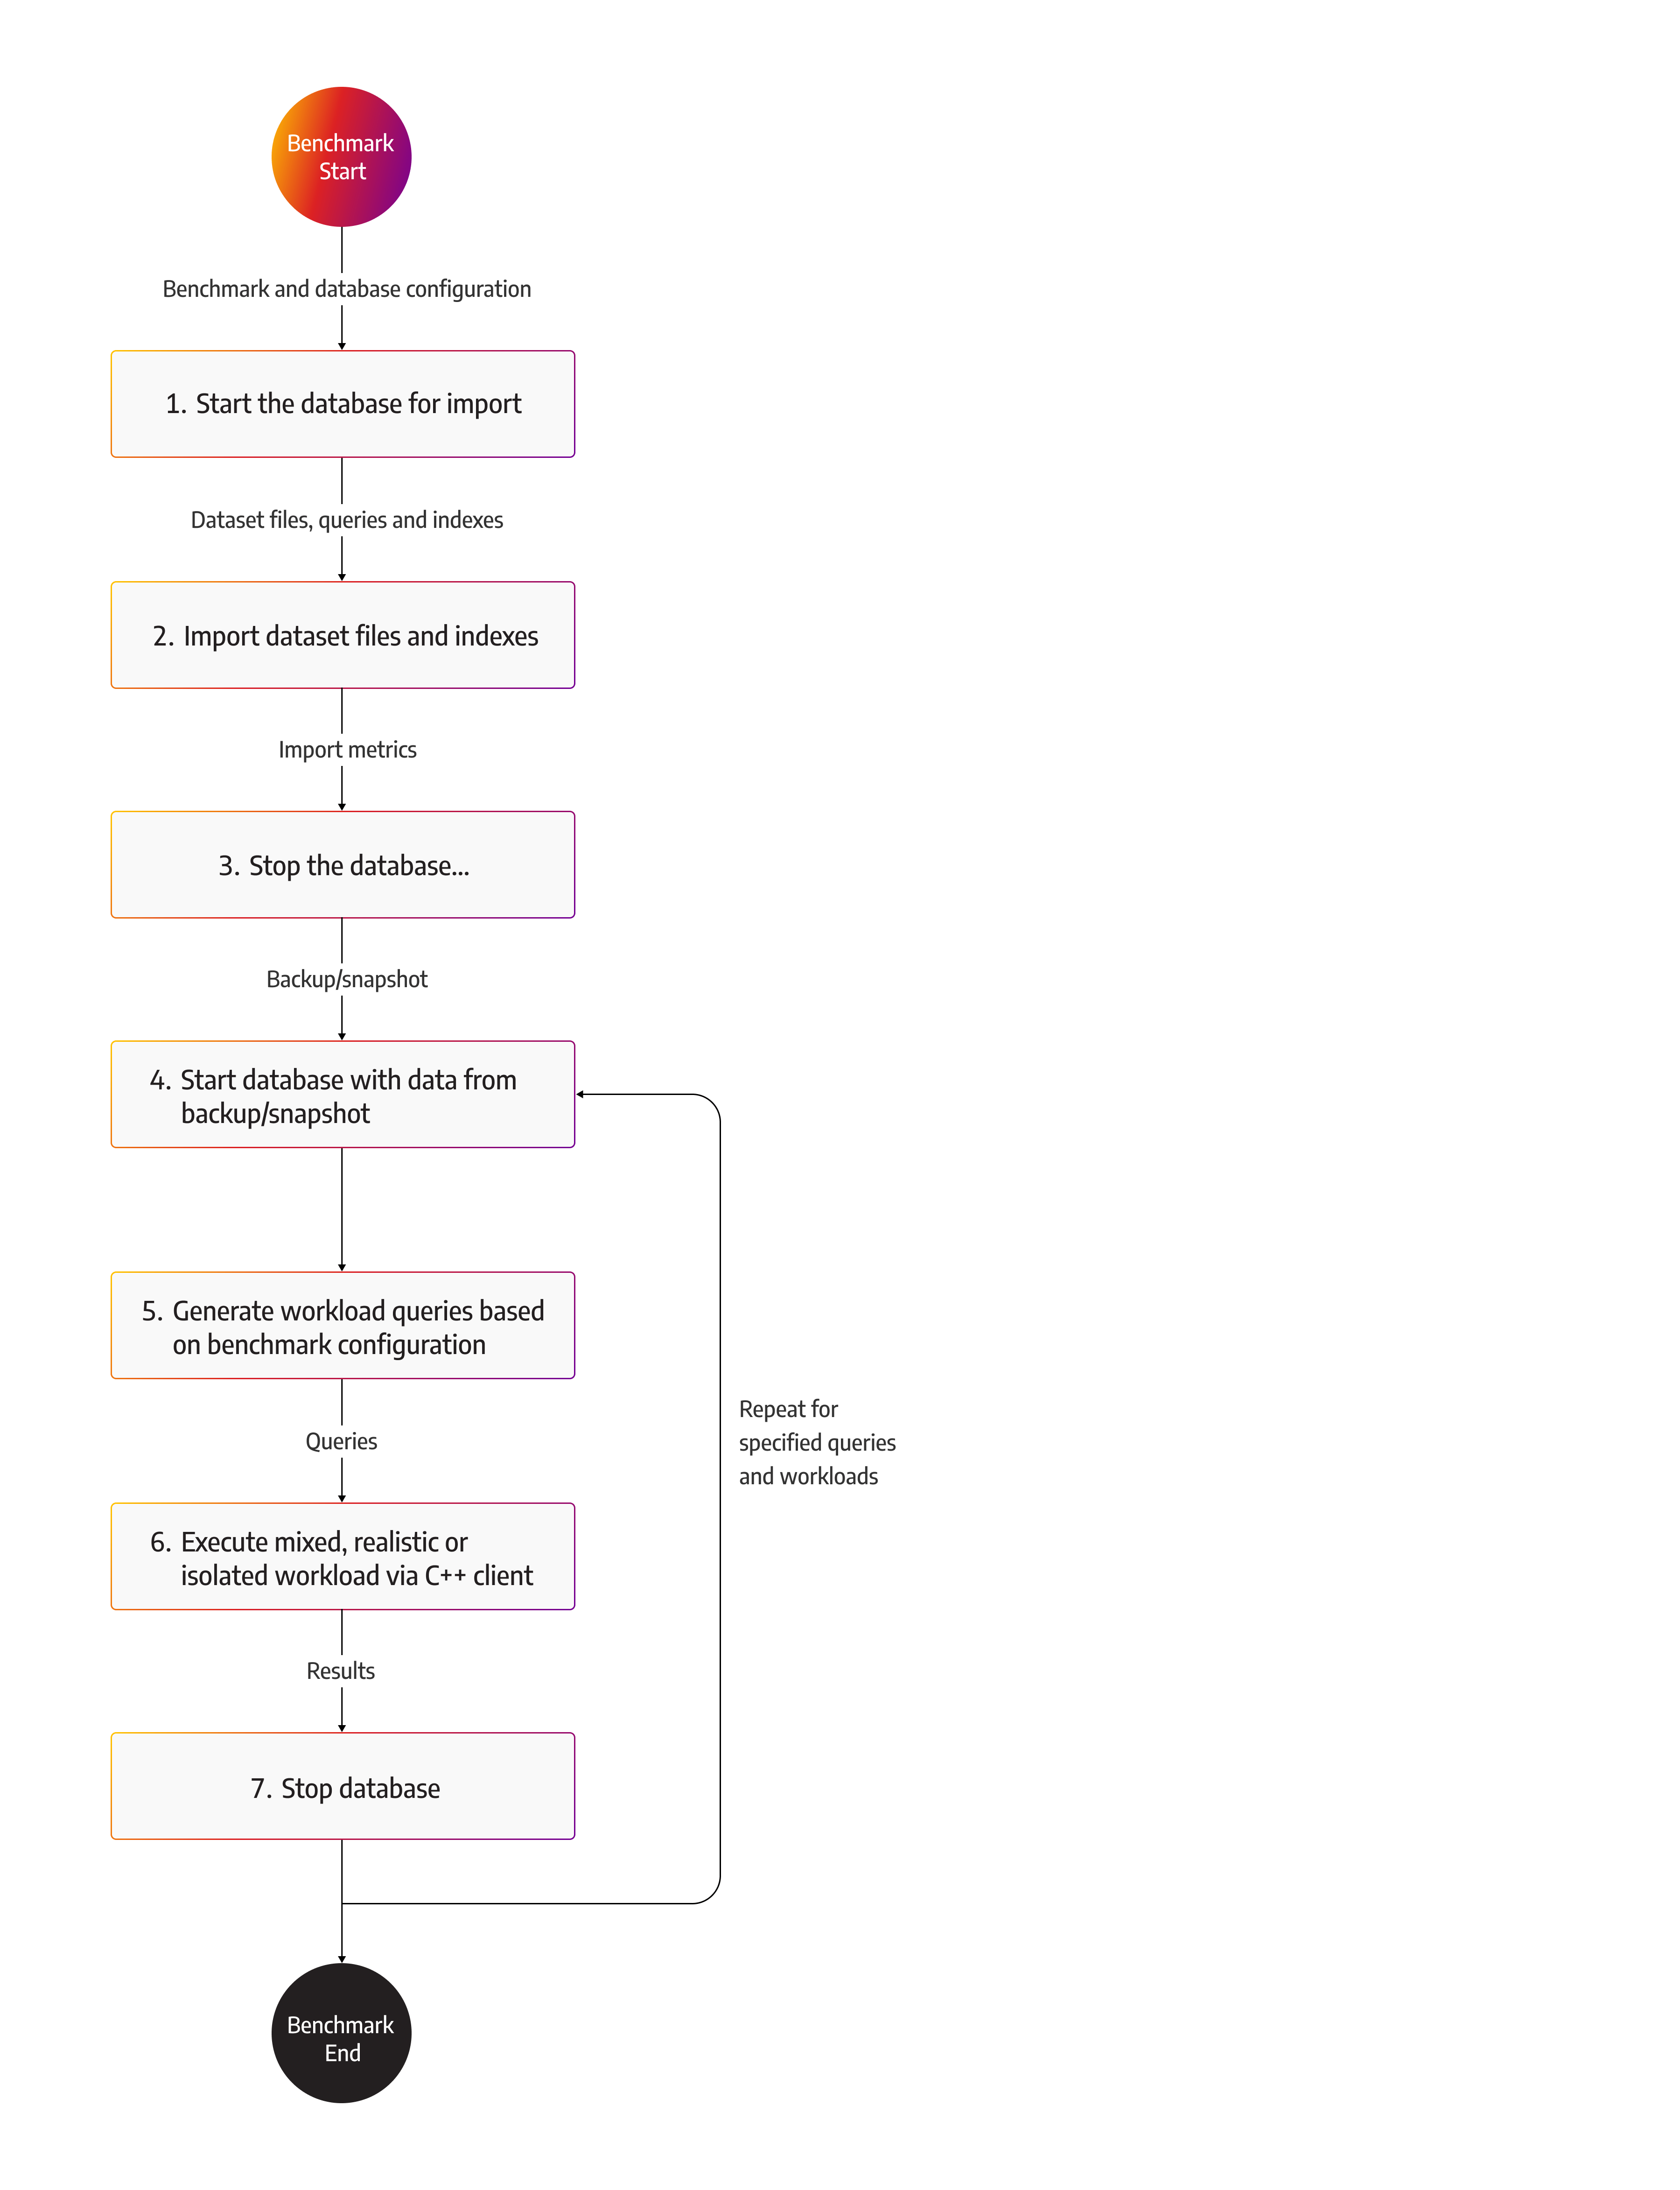
The first step is to start the database with predefined configuration options. Running Memgraph with different configuration options allows us to see respective performance implications.
The next step is the import procedure. Depending on the configuration of workload classes mentioned above, import may be custom, or data can be imported by executing Cypher queries via the C++ Bolt client. Being able to execute a list of Cypher queries allows us to specify different types of customer workloads quickly. After the import, the newly imported data is exported as a snapshot and reused to execute all the workloads that follow. But, if the first workload executed write queries, the dataset will be changed and therefore unusable because it will influence the results of the benchmark.
Once the import is finished, the database is stopped. Importing a dataset can stress the database and influence measurements, so the database must be restarted. After the restart, the database imports data from a snapshot, and the performance test can begin.
At the beginning of the test, queries are generated based on the benchmark configuration and the type of workload.
Benchgraph support three types of workloads:
- Isolated - Concurrent execution of a single type of query.
- Mixed - Concurrent execution of a single type of query mixed with a certain percentage of queries from a designated query group.
- Realistic - Concurrent execution of queries from write, read, update, and analyze groups.
Each of the workloads can be used to simulate a different production scenario.
Once the queries are executed, metrics such as basic latency measurements, queries per second, and peak RAM usage during the execution are collected and reported daily via our CI/CD infrastructure to graphana.
In the end, the database is stopped, and depending on the workload, it is started again with a fresh dataset from the snapshot, and the execution of the next query or workload begins again.
Just a side note on restarting a database during the execution of a benchmark: In an average use case, databases can run for a prolonged period of time. They are not being restarted very often, let’s say, in some edge cases when you are doing some upgrades or are having issues. That being said, why are databases restarted during benchmarks? Executing test after test on the non-restarted database can lead to tests being influenced by previously run tests. For example, if you want to measure the performance of queries X and Y, they should be run under the same conditions, which means a database with a fresh dataset and without any caches.
Benchmark configuration options
Here are just some of the flags that can be used to configure benchgraph during the performance runs.
--num-workers-for-benchmark - This flag defines the number of workers that will be used to query the database. Each worker is a new thread that connects to Memgraph and executes queries. All threads share the same pool of queries, but each query is executed just once.
--single-threaded-runtime-sec - This flag defines the pool number of queries that will be executed in the benchmark. The question at hand is how many of each specific query you wish to execute as a sample for a database benchmark. Each query can take a different time to execute, so fixating a number, let’s say 100 queries, could be finished in 1 second, and 100 queries of a different type could run for an hour. To avoid such an issue, this flag defines the duration of single-threaded runtime in seconds that will be used to approximate the number of queries you wish to execute. The queries will be pre-generated based on the required time range for a single-threaded runtime.
--warm-up - The warm-up flag can take three different arguments, cold, hot, and vulcanic. Cold is the default. There is no warm-up being executed, hot will execute some predefined queries before the benchmark, while vulcanic will run the whole workload first before taking measurements. Databases in production environments are usually run pre-warmed and pre-cached since they are running for extended periods of time. But this is not always the case; warming up the database takes time, and caching can be ruined by the volatility of the data inside the database. Cold performance is the worst-case scenario for every database and should be considered.
--workload-realistic, --workload-mixed - These flags are used to specify the workload type. By default, Benchgraph runs on an isolated workload.
--time-depended-execution - A flag for defining how long the queries will be executed in seconds. The same pool of queries will be re-run all over again until time-out. This is useful for testing caching capabilities of the database.
Why does Memgraph build an in-house benchmark tool?
Building benchmark infrastructure is time-consuming, and there are a few options for load-testing tools on the market. On top of that, building benchmarking infrastructure is error-prone; memories of unconfigured indexes and running benchmarks on debug versions of Memgraph are fun 😂
But due to the need for a custom benchmark process, configuration options, and specific protocol, Memgraph is working on a house benchmarking tool Benchgraph. This is not universal advice: We would not advise embarking on this journey if some of the tools out there can satisfy your benchmarking needs. But in the long run, an internal benchmarking tool provides a lot of flexibility, and an external tool is a great addition as validation and support to all performance tests being executed.