
Preventing Cyber Attacks: Why Vulnerability Management Needs Graphs
Attackers don’t guess their way in. They slip through cracks you don’t see, like a misconfigured device, an unpatched app, or an exposed port. One foothold is all it takes for them to move deeper into your system.
The real question isn’t whether you have vulnerabilities. You do. The question is: Which vulnerabilities actually create an exploitable path attackers could use to reach your most sensitive assets?
This is why you need a better way to see the bigger picture.
See Connections, Not Just Vulnerabilities
Think of a lone misconfigured endpoint. On paper, it might look harmless. But what if it connects to an internal database? What if it shares credentials with an admin? Suddenly, that tiny crack becomes a high-risk access path.
This is where graphs change the game. By modeling your infrastructure as a graph, you map the relationships that matter. It shows how a single exposure can lead to multiple paths of compromise. By modeling these connections, security analysts can trace how a single exposed node could be used to compromise entire system.
Preemptive Attack Path Simulations
Graphs Database’s relationship-based reasoning is especially useful for simulating attack paths. Teams can explore which routes an attacker might take from different endpoints, helping them fix the riskiest connections first rather than the most obvious vulnerabilities.
Attack simulations are even more powerful when combined with threat intelligence. Many security teams already rely on MITRE ATT&CK or STIX/TAXII feeds. On their own, these show typical attacker behaviors and tactics.
But when you layer that intelligence into your graph model, you see exactly which vulnerabilities line up with known attacker behaviors and tactics.
Security teams can then test practical questions like:
- What’s the shortest path from this public-facing app to our internal database?
- Which exposed systems would give access to a domain admin?
- Are there redundant attack paths we haven’t blocked yet?
- Which vulnerabilities should we fix first to break potential attack chains?
That’s a huge edge in today’s fast-moving threat environment.
The Analyst’s Edge: Graph Algorithms in Action
Graphs also give you the intelligence to generate actionable insights at scale using algorithms like:
| All Shortest Path | Identifies the most efficient attack routes between multiple node pairs. Enhances security posture by uncovering hidden relationships. |
| PageRank | Prioritizes key nodes in the attack graph, helping with patch prioritization. |
| Community Detection | Clusters nodes based on connectivity to identify risk zones. |
Visualizing the Threat: Tracing Vulnerable Dependencies with Graphs
Not every threat is at the infrastructure level. Oftentimes, cyber threats hide in outdated or vulnerable packages buried deep within a project’s dependencies.
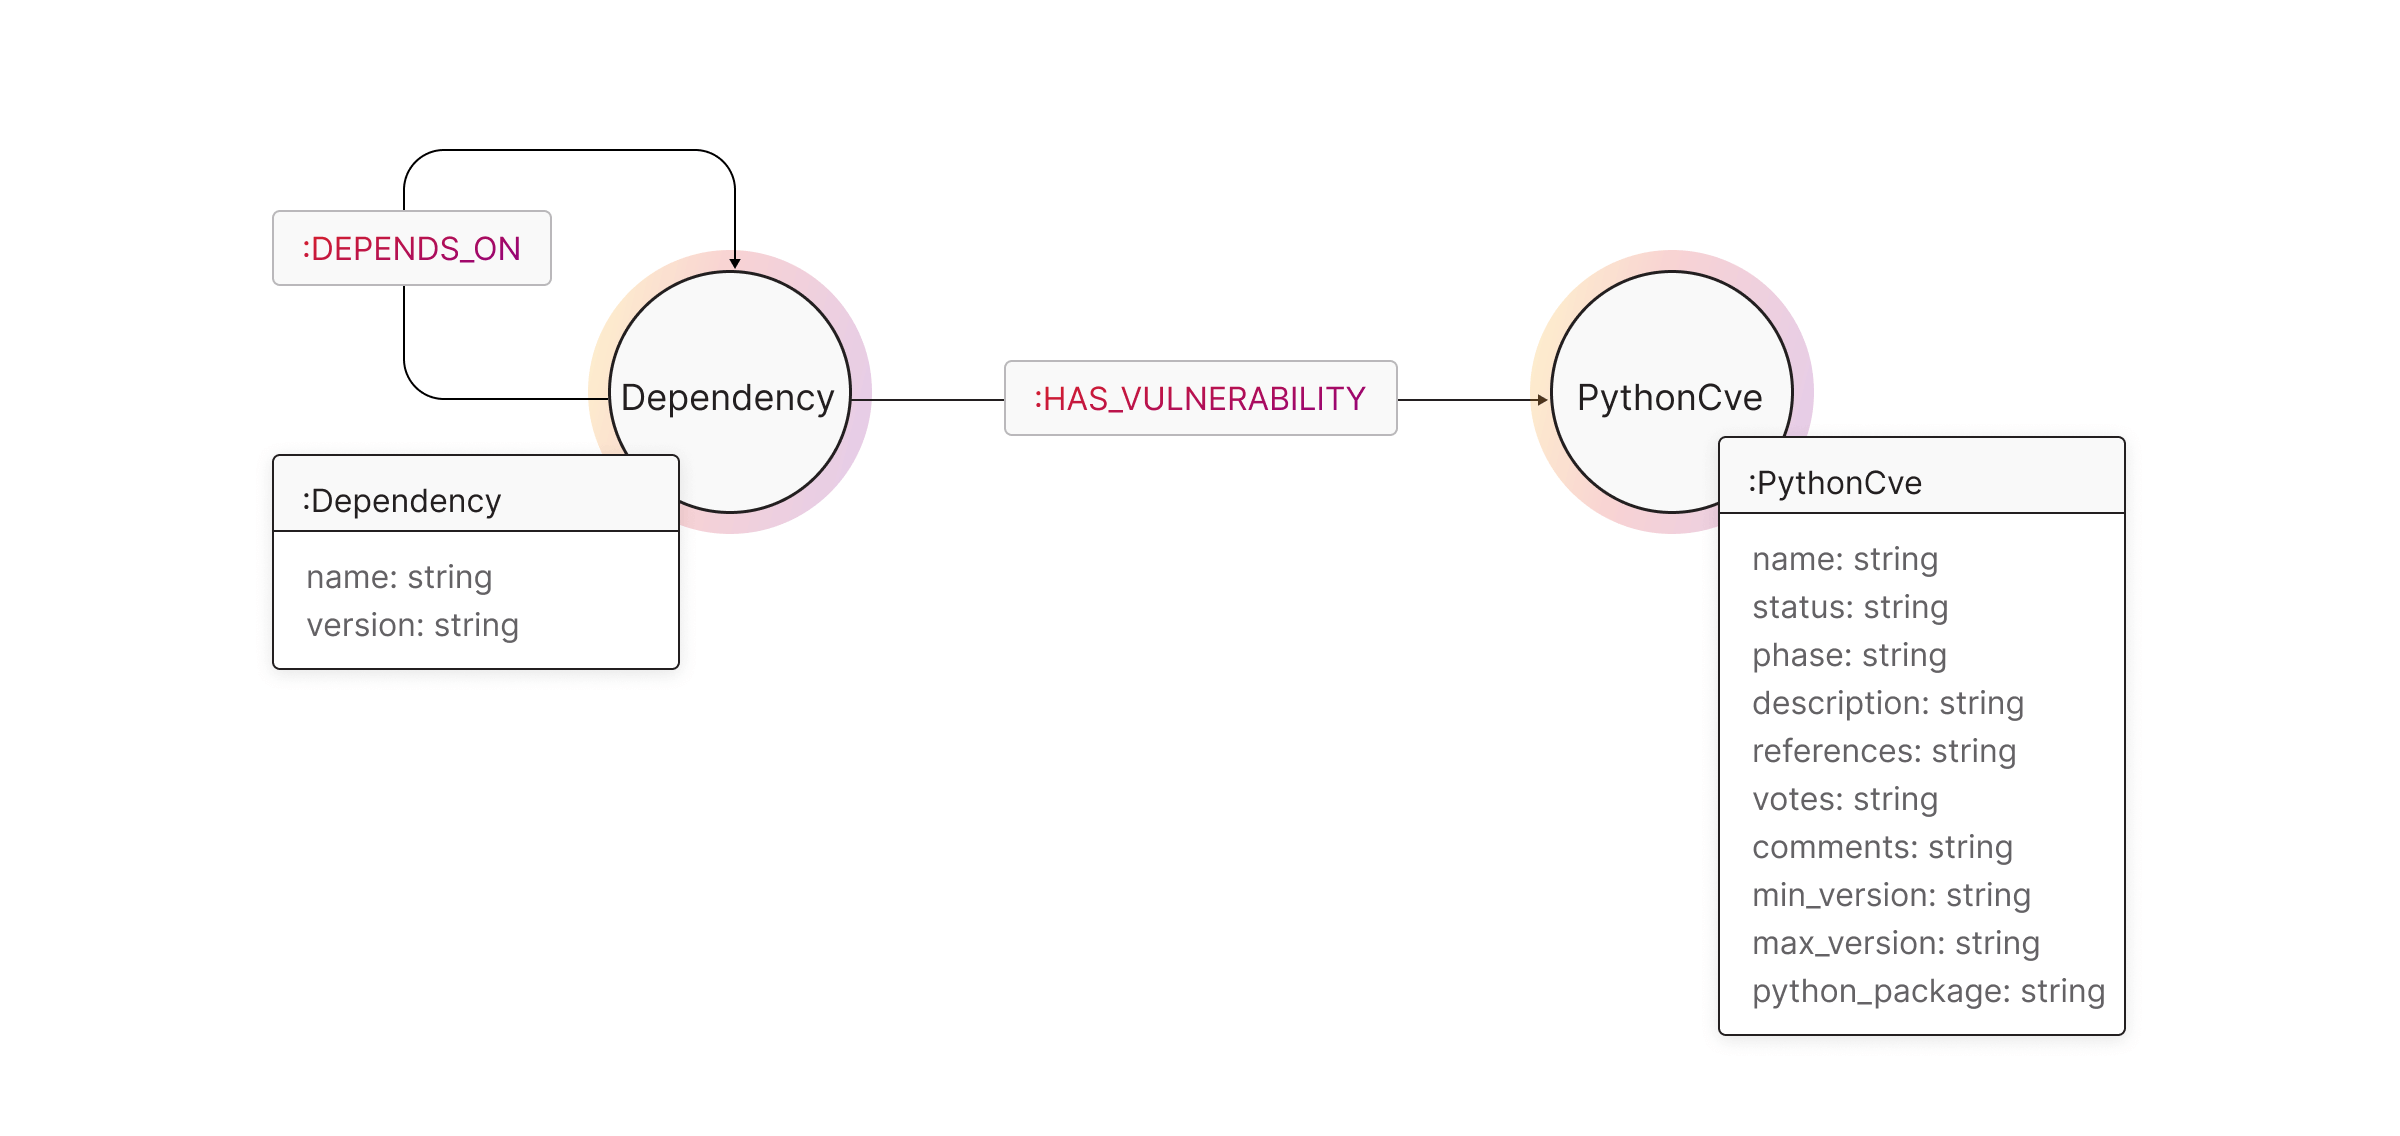
To uncover these hidden risks, we can model software packages and their known vulnerabilities (CVEs) as a graph. The diagram below showcases how these are linked in a graph structure for analysis.
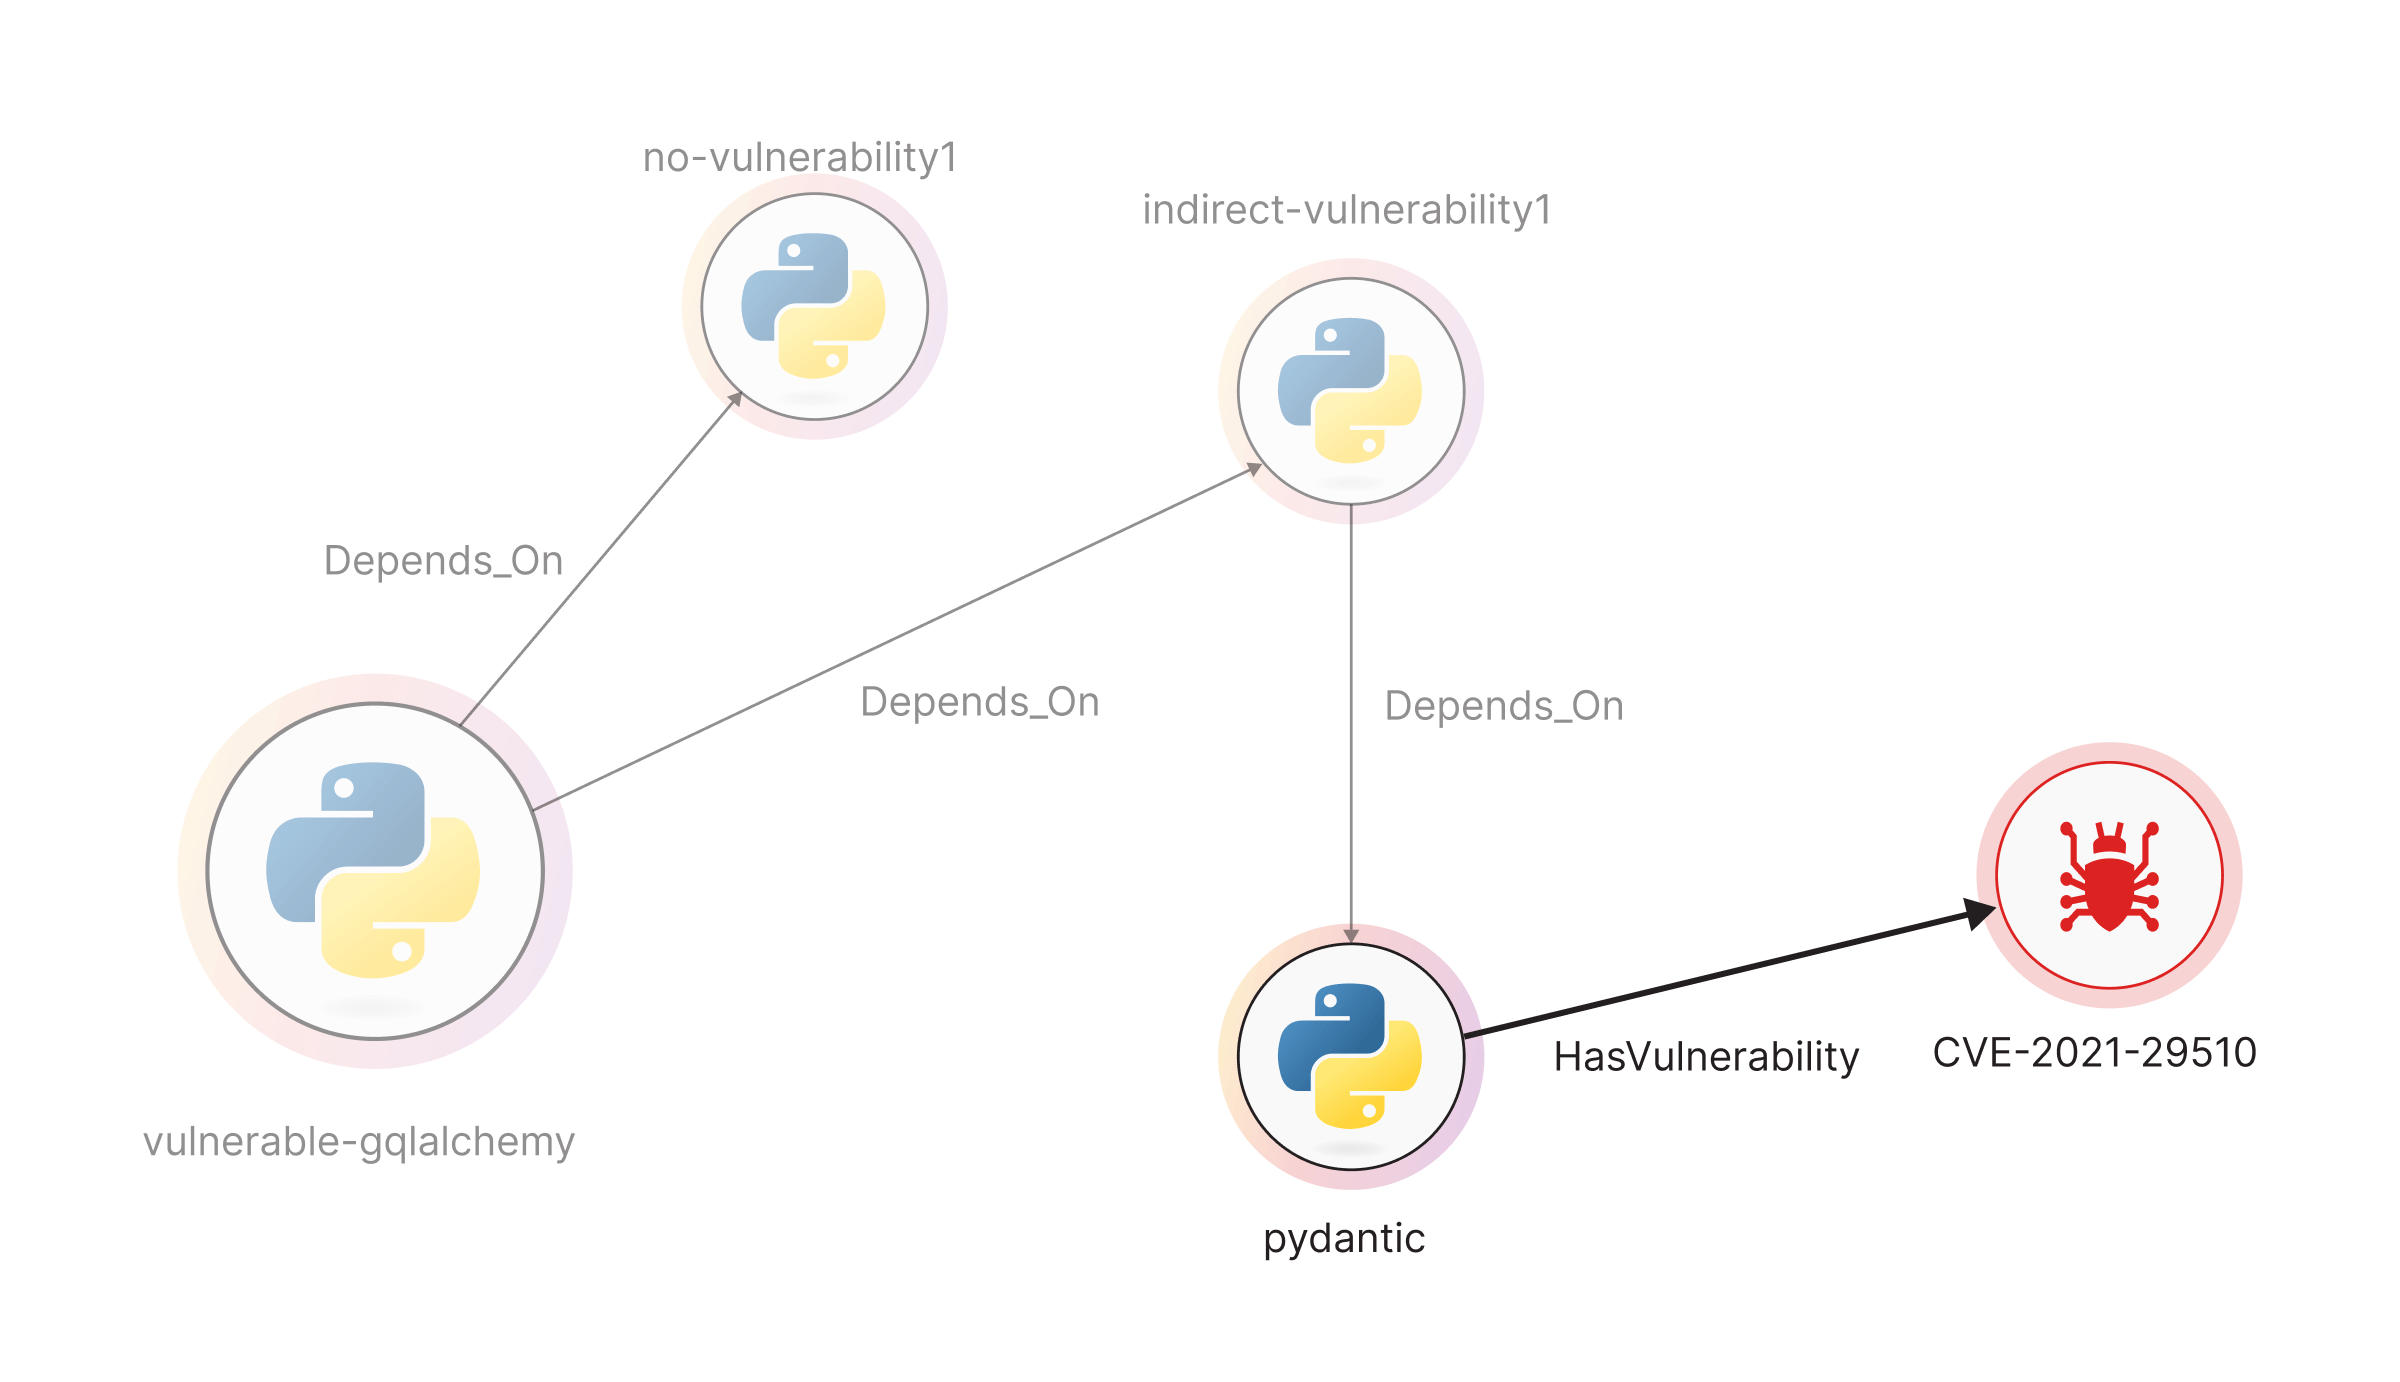
Using Breadth-First Search (BFS) graph traversal, you can surface every dependency linked to a project and see if any of them are vulnerable. This method reveals a full chain of dependencies highlighting indirect risks that might otherwise be missed.
For example, look at the pydantic project showcased below, which is linked to the critical vulnerability CVE-2021-29510.
With this approach, graph traversal not only helps visualize deeply hidden risks, but it also makes it easier to take action, such as upgrading the affected package or patching the vulnerable version.
Stop Breaches Before It’s Too Late
Weak links exist in every system. What matters is whether you can see how they connect before an attacker does. Graph technology gives security teams that x-ray vision.
Attackers look for pathways. Graphs help you shut them down.
Want a deeper look at all five cybersecurity use cases enabled by graph technology?
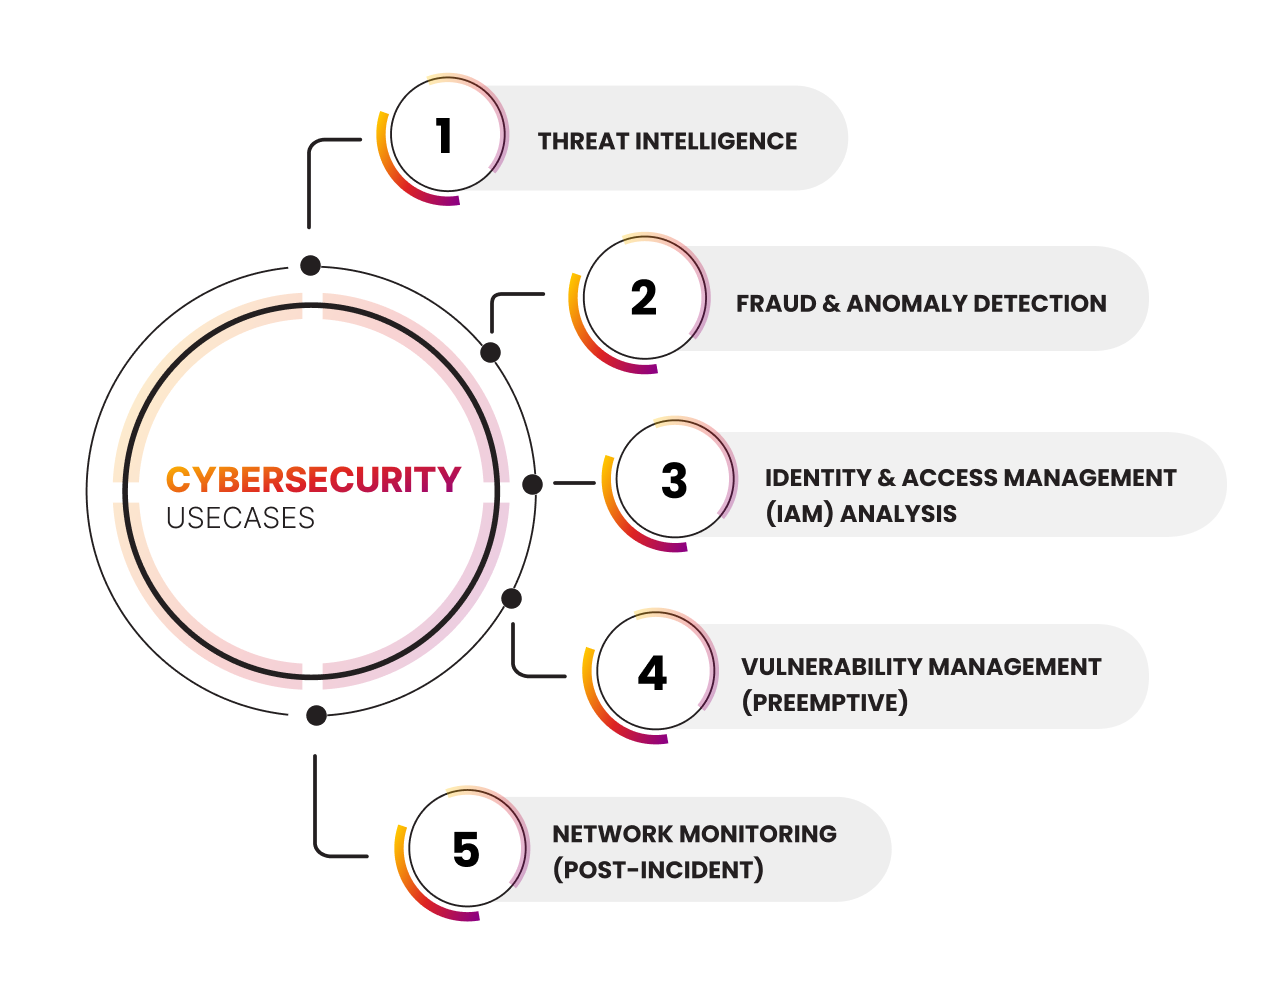
Download the full Cybersecurity Guide to explore practical insights and research-backed techniques.