Use Prometheus to Monitor Memgraph’s Performance Metrics
Efficient database management lies at the core of any successful application or business operation. As data becomes increasingly critical, ensuring the performance, reliability, and security of your database infrastructure becomes paramount. This is where robust monitoring practices come into play, providing insights into the inner workings of your databases.
In this article, we will discuss how Memgraph integrated with Prometheus, a time-series database that enables other databases and applications to monitor and react to performance changes in the system just in time.
Why should you monitor your database performance?
Monitoring a graph database such as Memgraph with Prometheus brings several benefits to the table. One of the major advantages is that it provides real-time visibility into the performance and health of the database: Prometheus collects and analyzes metrics such as query response times, memory usage, disk I/O, and transaction rates, allowing you to monitor the database's performance at a granular level. That kind of visibility helps identify bottlenecks, optimize query execution, and ensure efficient resource allocation.
Secondly, Prometheus enables proactive issue detection and resolution. With alerting rules in place, you can receive timely notifications when there are anomalies or deviations from expected behavior in the graph database. Having access to an analogous alert mechanism allows you to quickly identify and address potential issues before they impact application performance or user experience.
Last but not least, monitoring a graph database with Prometheus facilitates capacity planning and scalability. By tracking resource utilization metrics over time, you can analyze trends and make informed decisions about scaling the database infrastructure to meet growing demands.

Key database performance metrics
Here are several metrics that would be useful to keep an eye out for:
RAM memory usage
RAM memory usage is a primary concern, given that Memgraph is an in-memory graph database. A potential issue with in-memory databases is when the query uses so much memory that it fails to execute. So having a monitoring tool in place, such as Prometheus, ensures on-time visibility of such cases, allowing you to promptly identify suboptimal queries and rewrite them to prevent memory surges.
Query execution latency
Although Cypher is the most widely used query language for graph databases, enterprise companies are not always quick to adopt it. Developers can occasionally struggle to write the most optimal and performant Cypher queries. When the query planner fails to identify the fastest route to execute a query, it is up to developers and database administrators to realize that queries can be written differently to decrease query execution latency and increase query throughput on Memgraph. A higher-than-usual latency performance metric in your dashboard can alert you in time to make the right decisions and preserve your system response times.
Snapshot recovery latency
For large datasets, snapshot recovery can take a lot of time when Memgraph is restarted, given the whole dataset needs to be loaded in memory. The 2.8 version of Memgraph introduces multithreaded recovery of snapshots, allowing users to recover the database with respect to the number of cores they have in the system for the most optimal behavior. By monitoring the average snapshot recovery time, you’ll be able to check the downtime of the Memgraph instance when it restarts and tweak performance flags.
Connections and transactions
Monitoring connections and transaction is useful while executing a heavy production load. If the database isolation level is high and the number of write-write conflicts goes up, the number of concurrent transactions can suggest how to ease the load on the database. Some of the solutions are dropping the isolation level, lowering the number of connections on the application level, and so on.
These are only some of the metrics that are exposed from Memgraph, but there are many more of them that reveal info about streams, triggers, indices, query execution operators, and a lot more.
How are metrics exposed in Memgraph to enable monitoring?
With the above-mentioned benefits of using Prometheus for monitoring in production systems, it made total sense to make an integration with it in order to allow enterprise companies to react fast and be alert at all times on what’s happening with Memgraph. With that in mind, we began our implementation efforts.
How to measure different parts of the system
When we started to design the monitoring feature, the first decision to make was to define all the things that could be measured. Generally, the more information we expose to the end metric collection system, the better. For a graph database, that useful information would include metrics about:
- Disk usage
- Memory usage
- Connections
- Transactions
- Triggers
- Indices
- Messages between client and server
- Query execution times
- Snapshot creation/recovery times
- Operator calls
- Graph algorithm calls
There is one more thing to consider: the type of each metric we expose. For instance, RAM memory usage is certainly a value we can look up at any time and return. The number of graph algorithm calls is something that is incremented over time. Query execution latency also needs to be measured and aggregated into a meaningful and condensed distribution. For that purpose, we designed 3 types of metrics with which we can track information in the system:
- Gauge — represents a single value in the system and can be set at any time (e.g., disk usage).

- Counter — represents a value that can be incremented and decremented depending on the events in the system (e.g., the number of active transactions in the system).

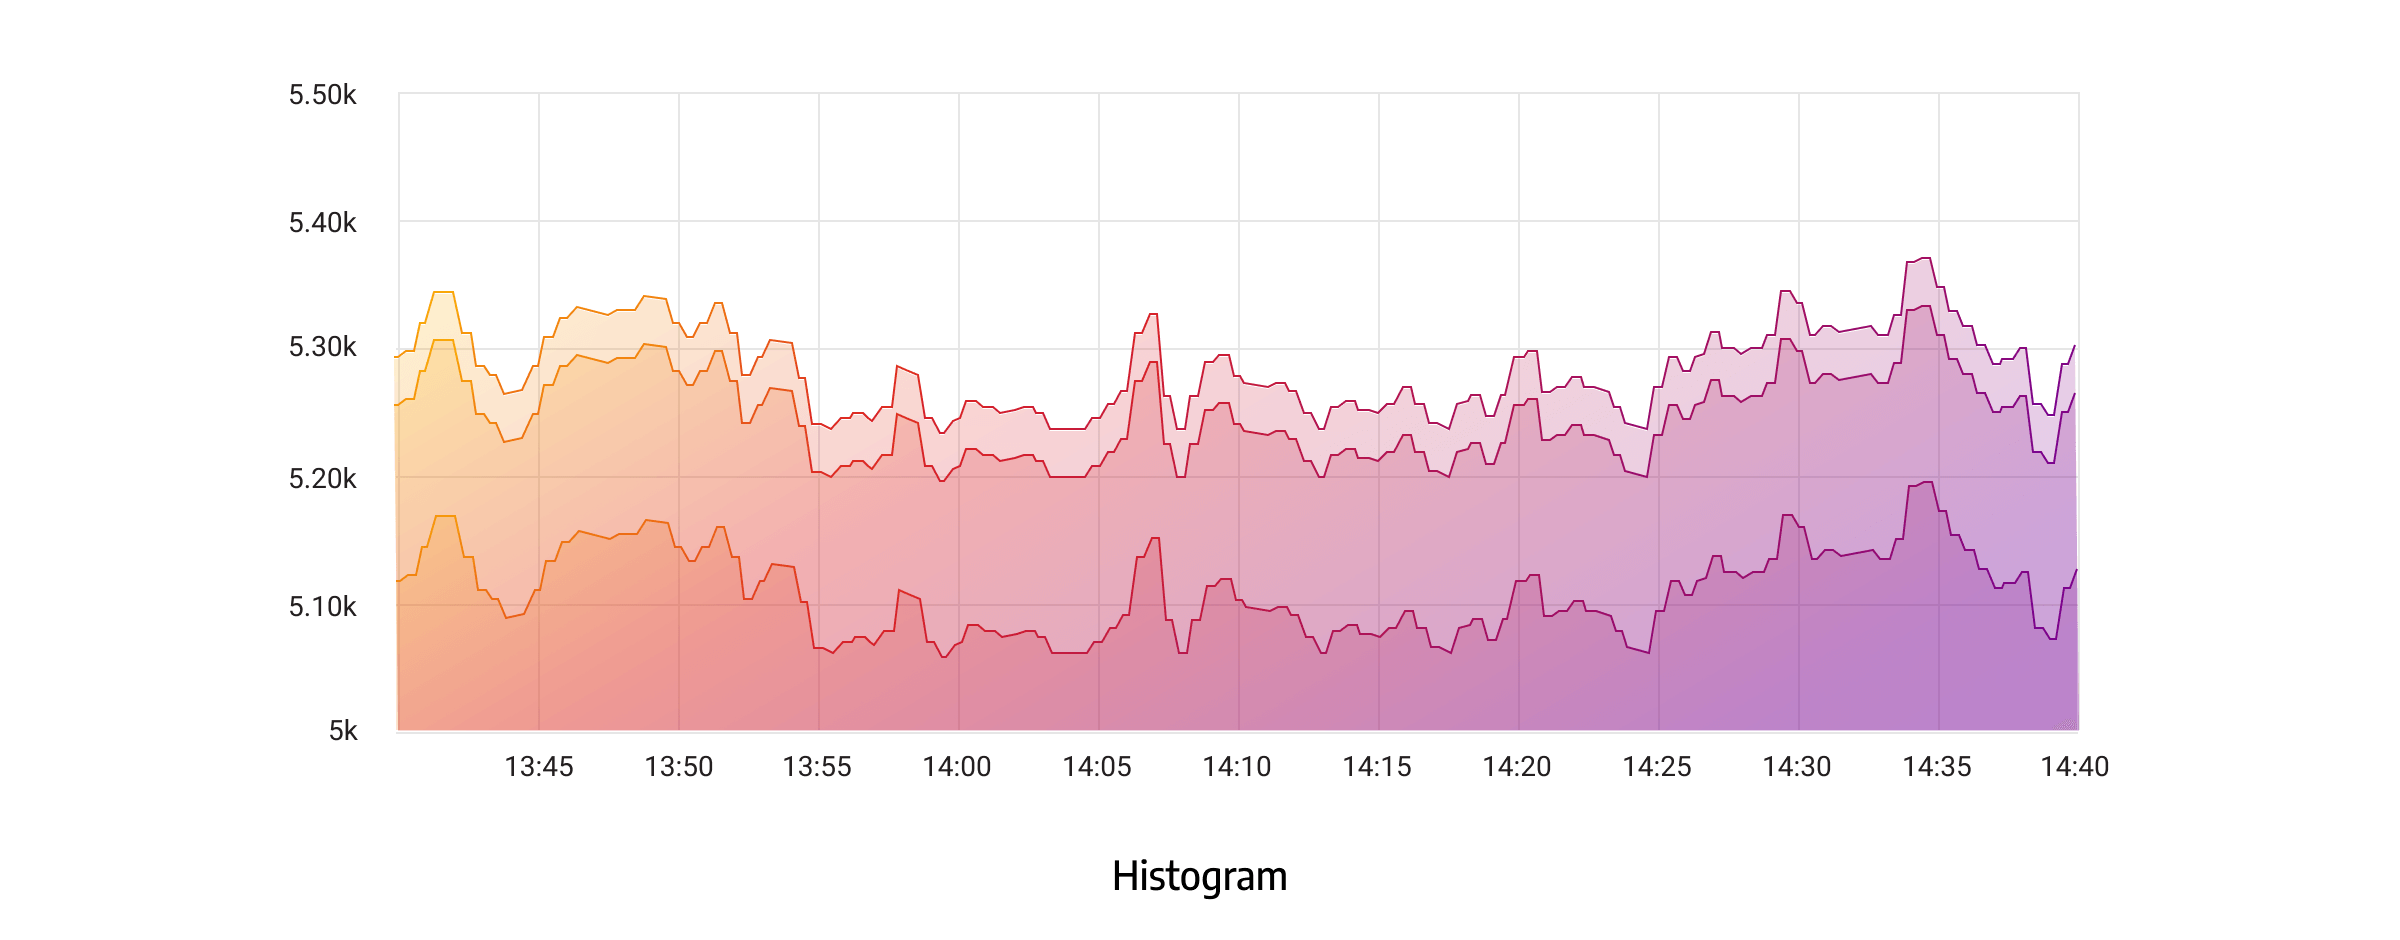
- Histogram — provides a distribution of measured variables over time (e.g., latency times).

The final point to take into account is providing enough information about histogram distribution. It is often a good practice to take a few percentiles from the distribution and collect them instead of providing the whole distribution when exposing metrics. With that in mind, we decided to take 50th, 90th, and 99th percentile values for both query latency and snapshot creation/recovery times.
Direct integration with Prometheus vs. proxying
With core metrics implemented, the next thing to take into consideration is how to expose the same metrics. One hard constraint that needs to be followed is that Prometheus uses a pull model, where it periodically scrapes metrics from configured targets.
Surely, one can integrate with Prometheus directly due to a long list of client libraries. However, this couples the integration and makes it unable for anyone else to use the metrics in their application. That is the case since Prometheus uses its own format of data to ingest it into the time-series database as fast as possible. Furthermore, some companies might have chosen other monitoring applications to observe their whole system (like Graphite, for example).
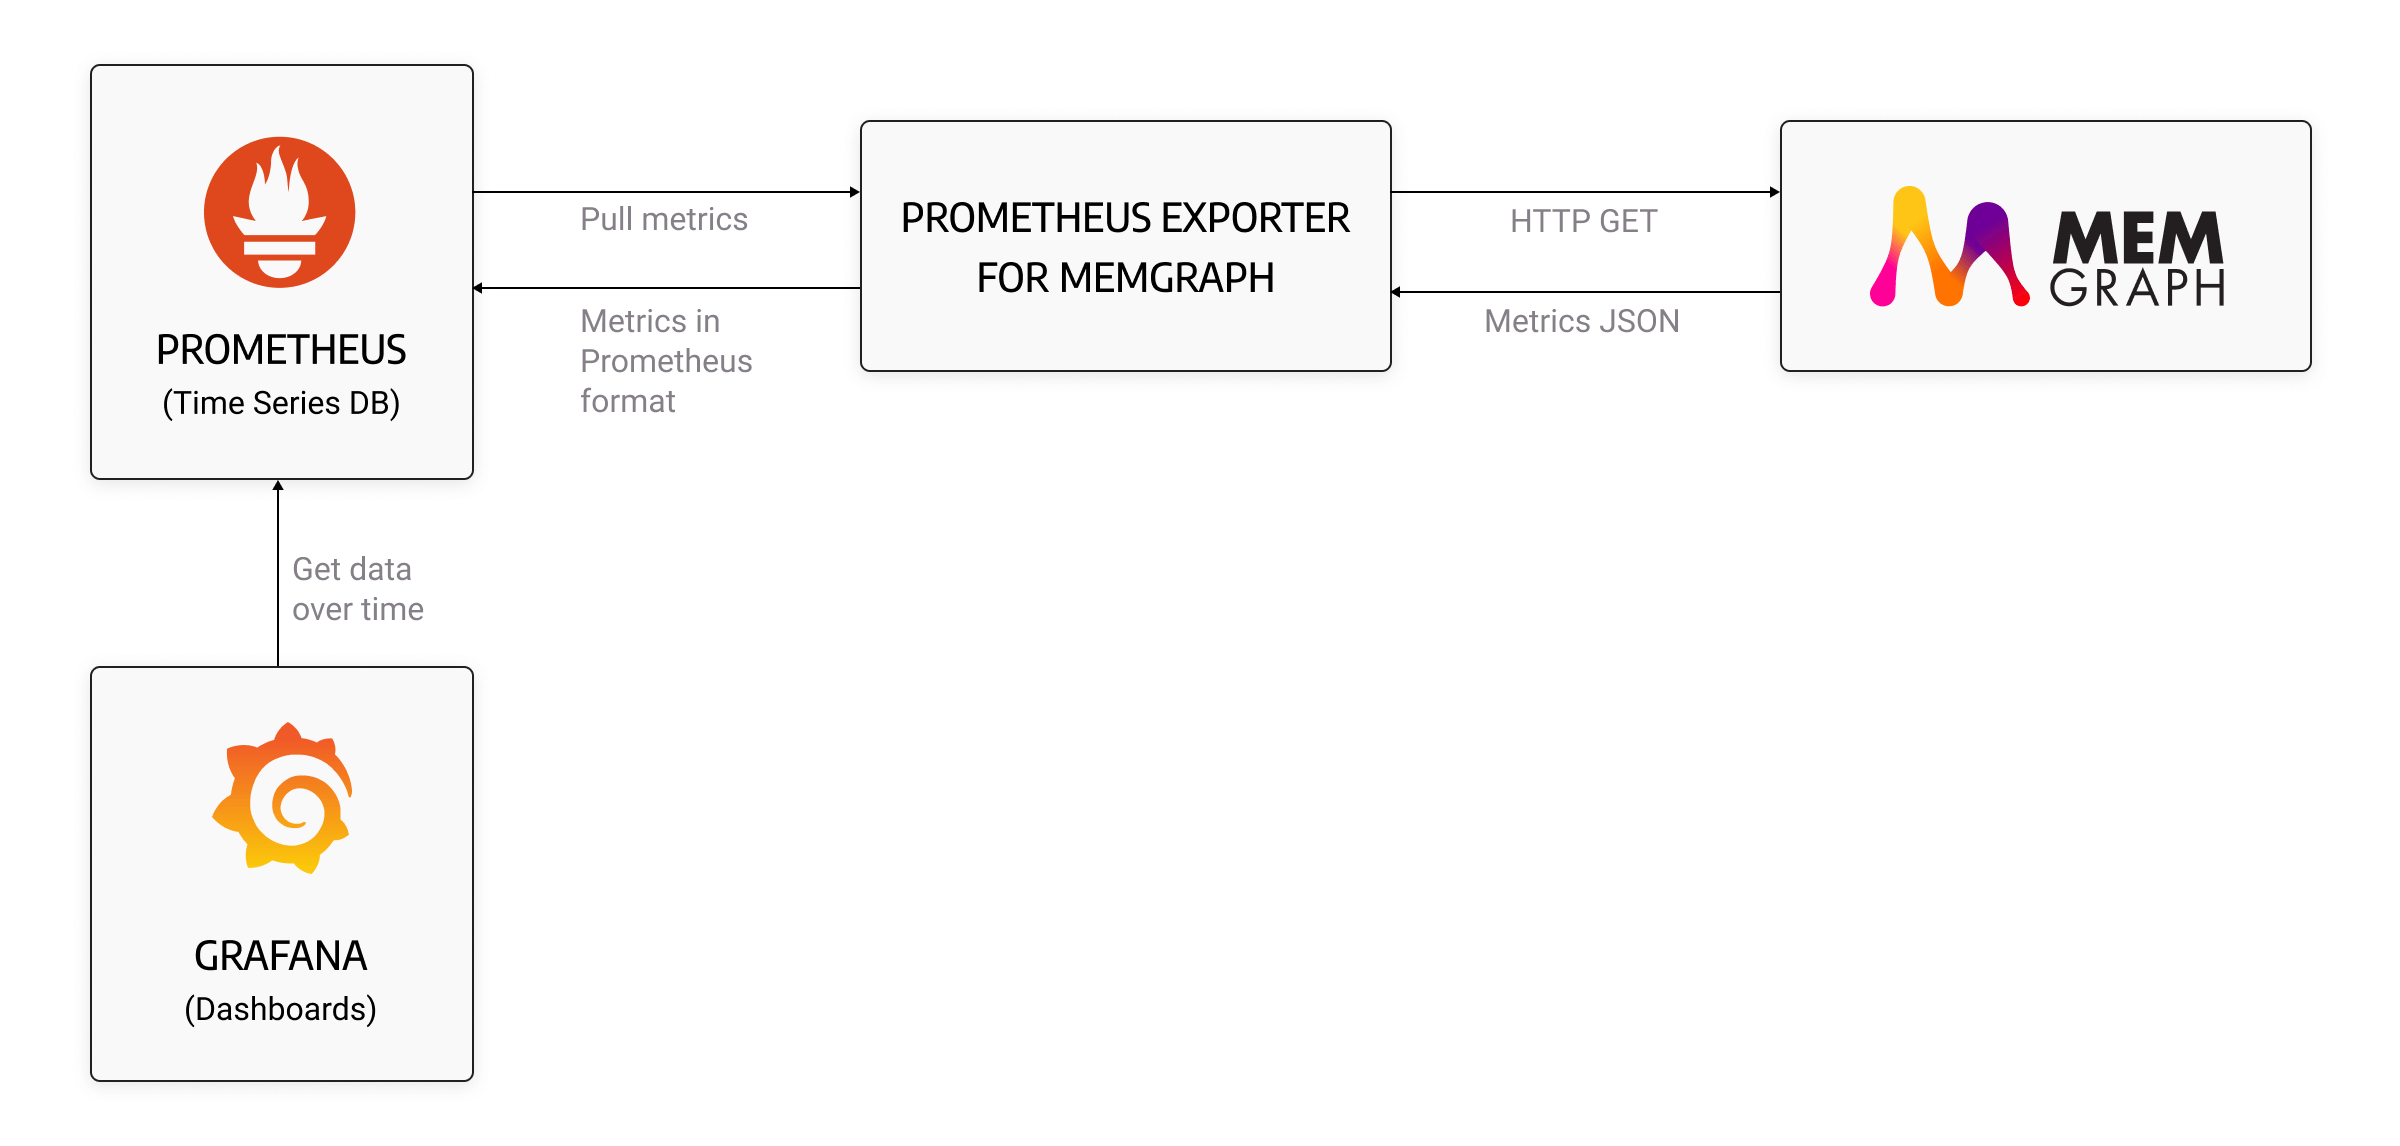
Prometheus again came to the rescue with the concept called exporters. A Prometheus exporter is a software component or module that collects and exposes metrics in a format that’s easily scraped and ingested by Prometheus. It serves as an intermediary between the target system or application and Prometheus, allowing Prometheus to gather relevant metrics for monitoring and analysis.
This makes it flexible for the application to use a simple HTTP endpoint and expose the metrics with a GET request, which we opted for in the end.
The image below portrays the end diagram when using a Prometheus exporter:

End result: Observable system at a glance
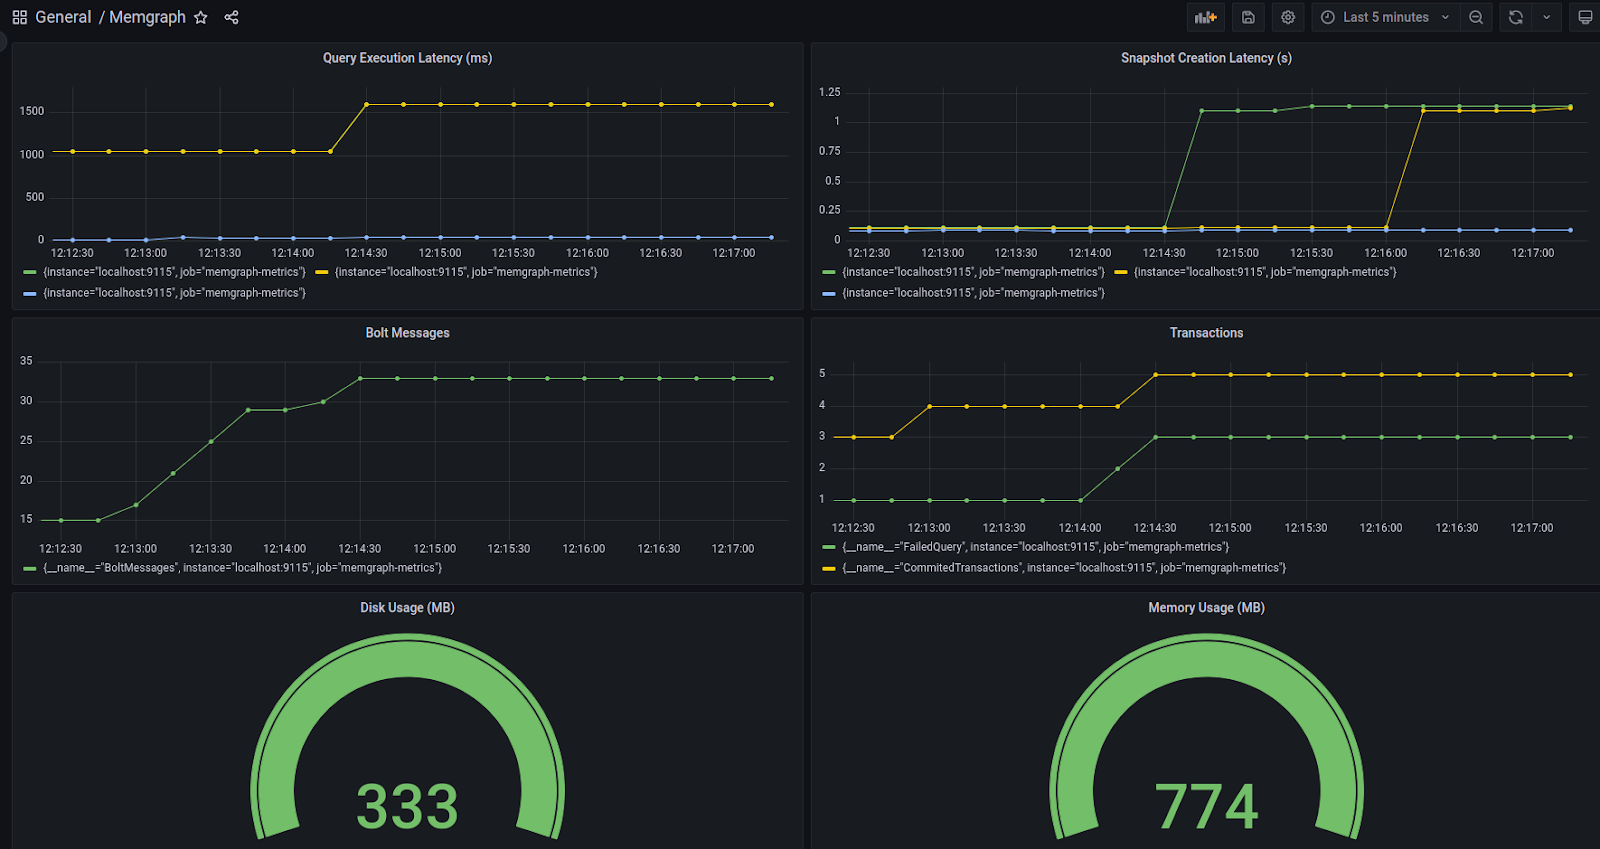
The finishing step is connecting Prometheus with a dashboarding tool, like Grafana, which is a feature-rich analytics and visualization platform that allows you to create and display interactive dashboards, charts, and graphs based on your exposed metrics from Memgraph. Here is a glimpse into what can be leveraged when Memgraph is integrated into this full E2E monitoring system.

All things considered, the integration of Prometheus with Memgraph enabled our customers and users, in general, to gain more confidence in system performance metrics at all times while Memgraph is being run. It also made it possible to track historical system metrics, allowing us to make decisions that can prevent issues and help us react proactively as opposed to reactively.
If you are curious to test the monitoring capabilities with Memgraph on your use case, be sure to visit our guide on exposing metrics as well as our Prometheus exporter to integrate everything from start to end.