
Why Cyber Threat Intelligence Needs a Graph
Security teams don’t lack alerts. They lack answers.
Every day, SOCs (Security Operations Centers) are flooded with IP addresses, domain names, hashes, user behavior logs. All coming in from internal telemetry systems and external feeds. All technically accurate. But all meaningless without context.
Here’s the thing: A single IP is just noise. But link that IP to a known malware server used by an APT group? That changes everything. Suddenly, it’s not just a rogue address. It’s a lead. Maybe even a warning alert.
Context is what turns fragmented indicators into actual intelligence. And that’s where graph technology steps in.
How to Connect the Dots with Context
Moreover, many organizations already use frameworks like MITRE ATT&CK or STIX/TAXII feeds. Graphs can ingest and normalize these into a unified cyber threat intelligence graph, allowing queries across structured and unstructured data sources.
This structure enables security teams to ask relationship-driven questions like:
- Is this IP associated with any known threat actor?
- Which endpoints are indirectly linked to this malware?
- How many degrees of separation are there between this alert and a high-value asset?
Most organizations already pull in STIX/TAXII threat feeds or use MITRE ATT&CK frameworks. But without a unified structure to link those signals together, analysts are left jumping between dashboards and scripts, trying to stitch together a coherent picture.
A graph changes the game.
By mapping threats as nodes and relationships, you can ask questions that actually matter:
- Is this IP associated with any known threat actor?
- Which endpoints are indirectly linked to this malware?
- How many degrees of separation are there between this alert and a high-value asset?
Now you’re not just spotting red flags. You’re tracing how they ripple across the environment.
A Case in Point: UNC3944
The cyber gang UNC3944 (aka Scattered Spider) wreaked havoc using shape-shifting tactics and overlapping infrastructure. They didn’t stick to one toolset or repeat the same tricks.
But they reused pieces. Tools. TTPs. Network paths.
A graph-powered threat intelligence system lets analysts spot those overlaps across time, even if the surface indicators look different. That’s how you catch modern, adaptive threats: by recognizing the pattern behind the noise.
The Analyst’s Edge: Graph Algorithms in Action
Graph technology is not just about visualization. It is powered by algorithms that enhance threat detection and prioritization.
| Community Detection | Groups together related threat infrastructure, like IPs, domains, and malware, to uncover coordinated campaigns or attacker clusters. |
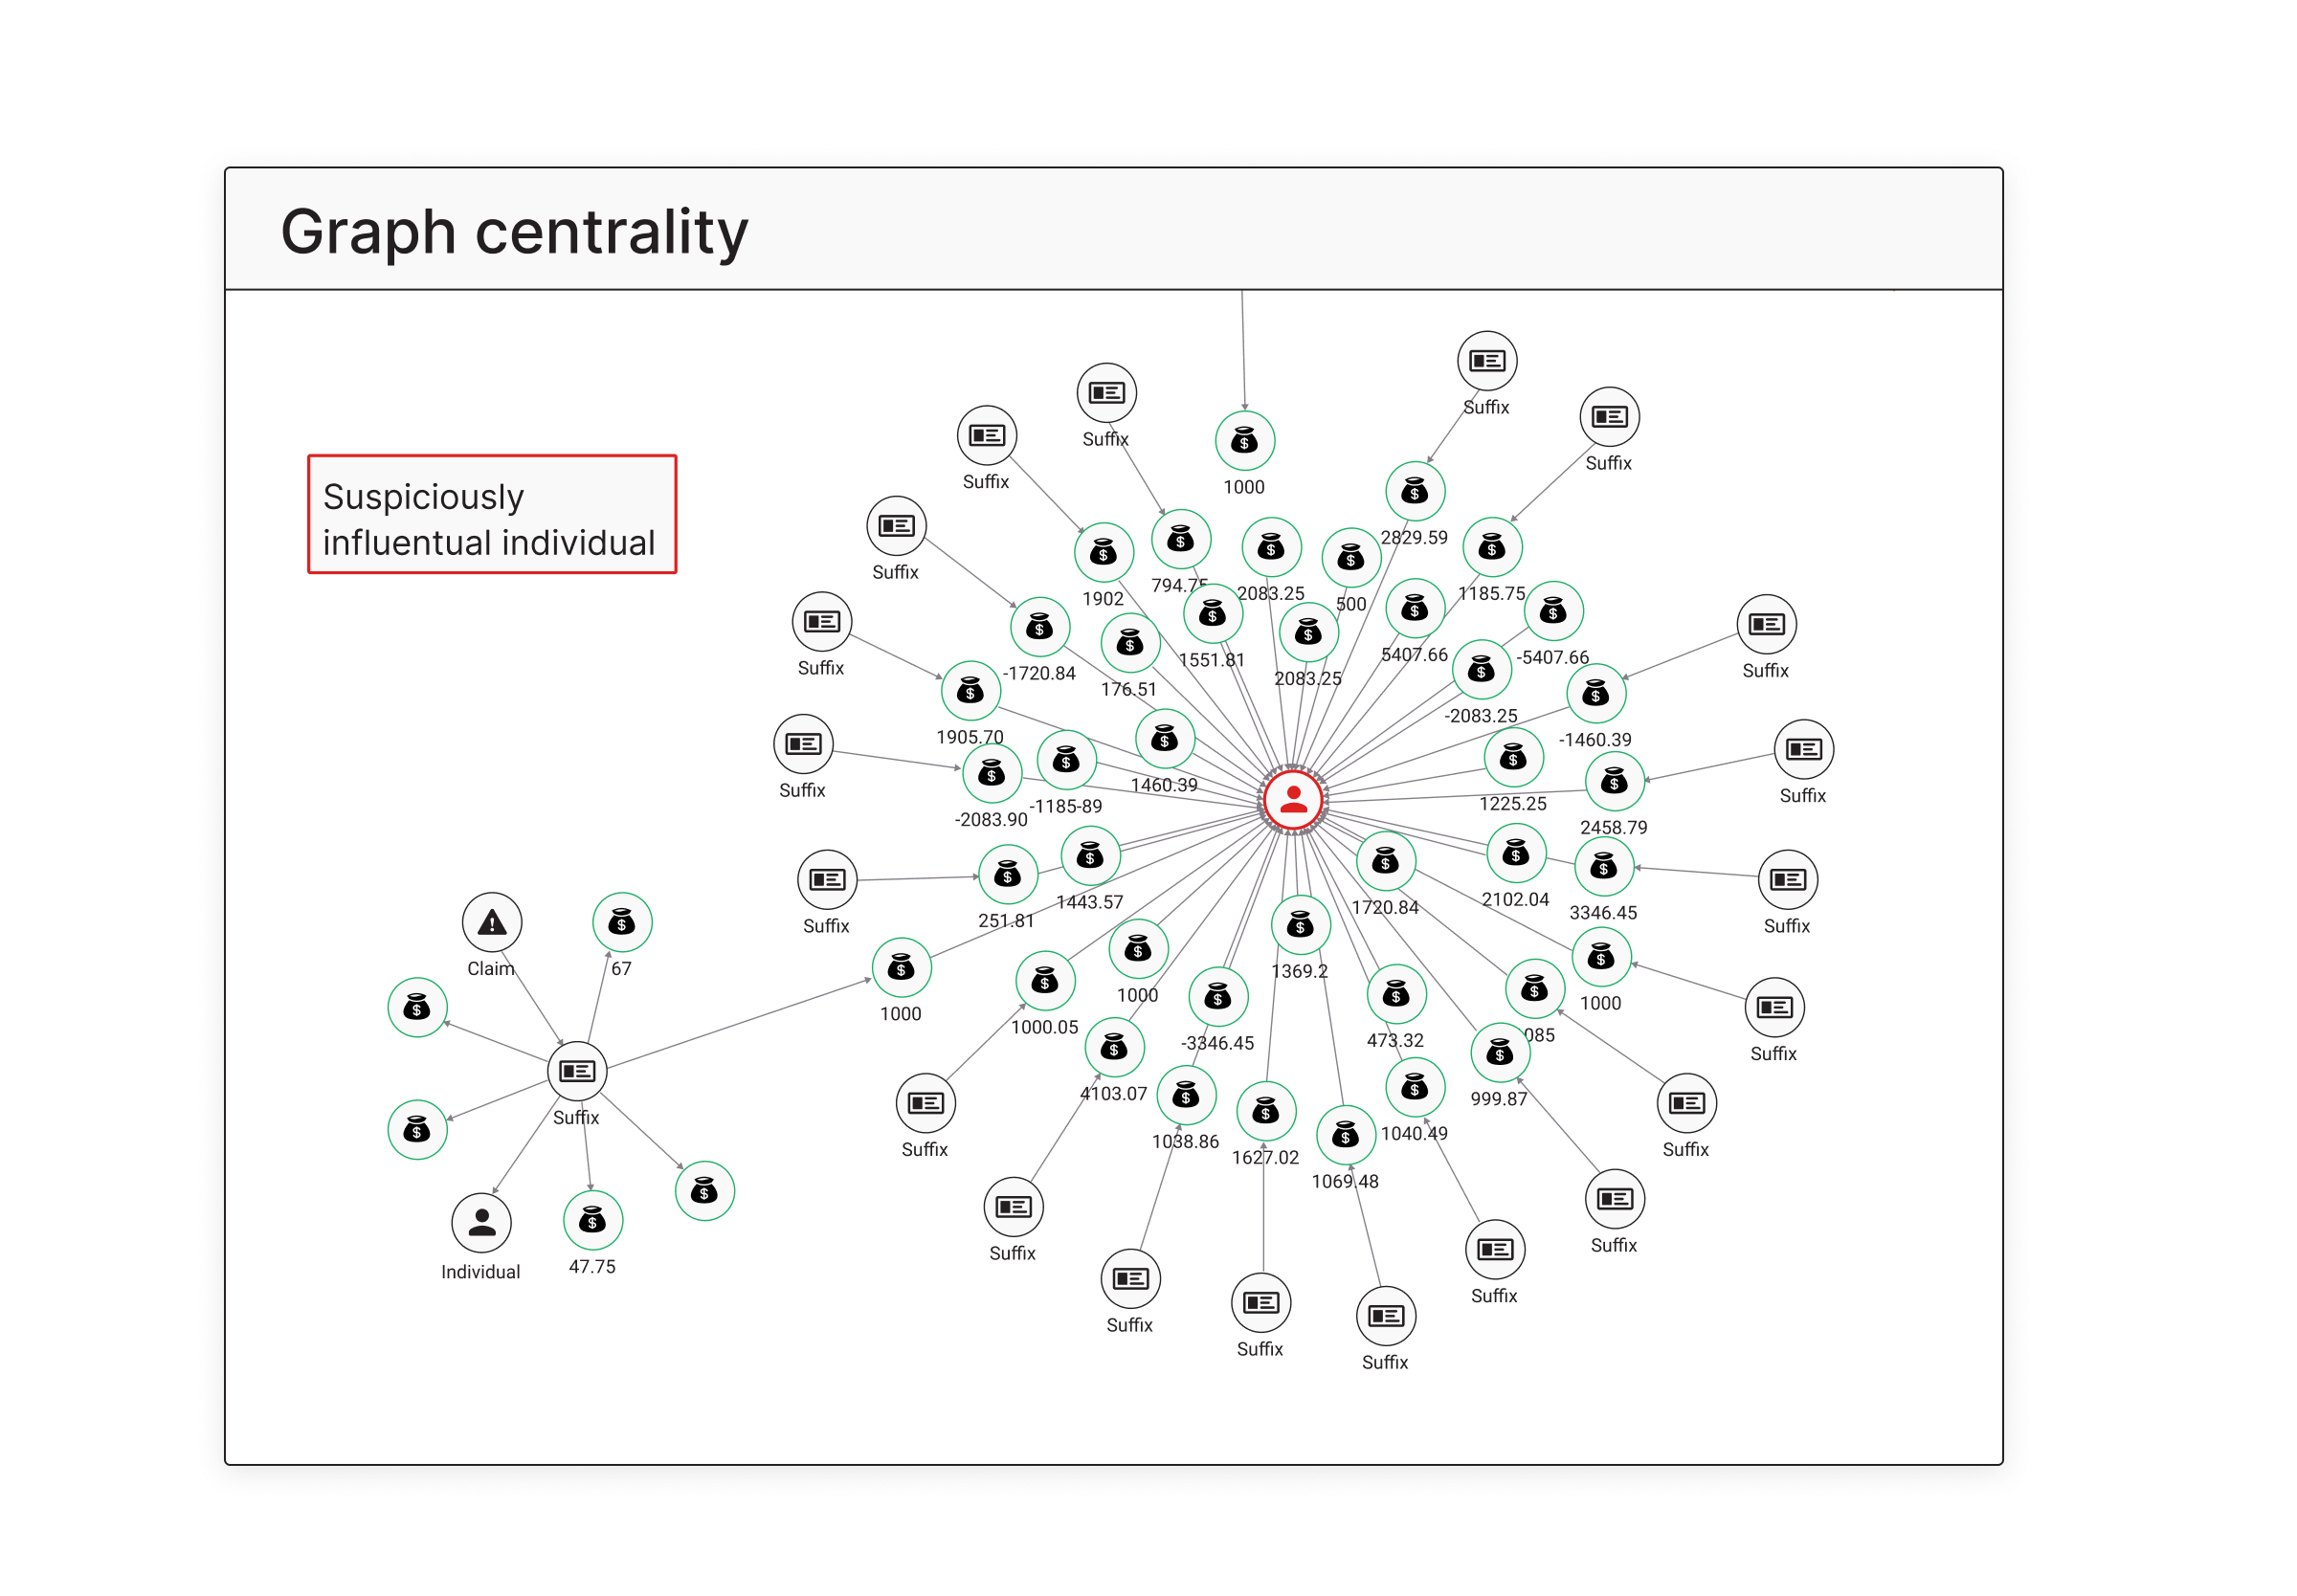
| Degree Centrality | Spot unusually connected nodes, like an IP address reused across multiple incidents, that may serve as shared tools across threat actors. |
| PageRank | Ranks influential nodes (e.g., a C2 domain used by multiple malware families), helping prioritize elements most critical to adversary operations. |
Visualizing the Threat: Reconnaissance Detection
Reconnaissance is often one of the earliest stages of an attack. During this phase, adversaries scan systems and probe networks to map out potential targets. These actions usually appear as patterns of excessive connections from a single source to many destinations.
The Degree Centrality algorithm is effective at surfacing this behavior. Degree Centrality comes in two forms:
- In-degree: number of incoming connections to a node
- Out-degree: number of outgoing connections from a node
By analyzing the out-degree of nodes in a network graph, analysts can identify entities that initiate an unusually high number of connections. These nodes are often reconnaissance probes.
In fact, when applied to datasets containing both benign and reconnaissance activities, nodes connected to reconnaissance tend to show significantly higher centrality scores. This makes Degree Centrality a strong signal for early-stage detection.
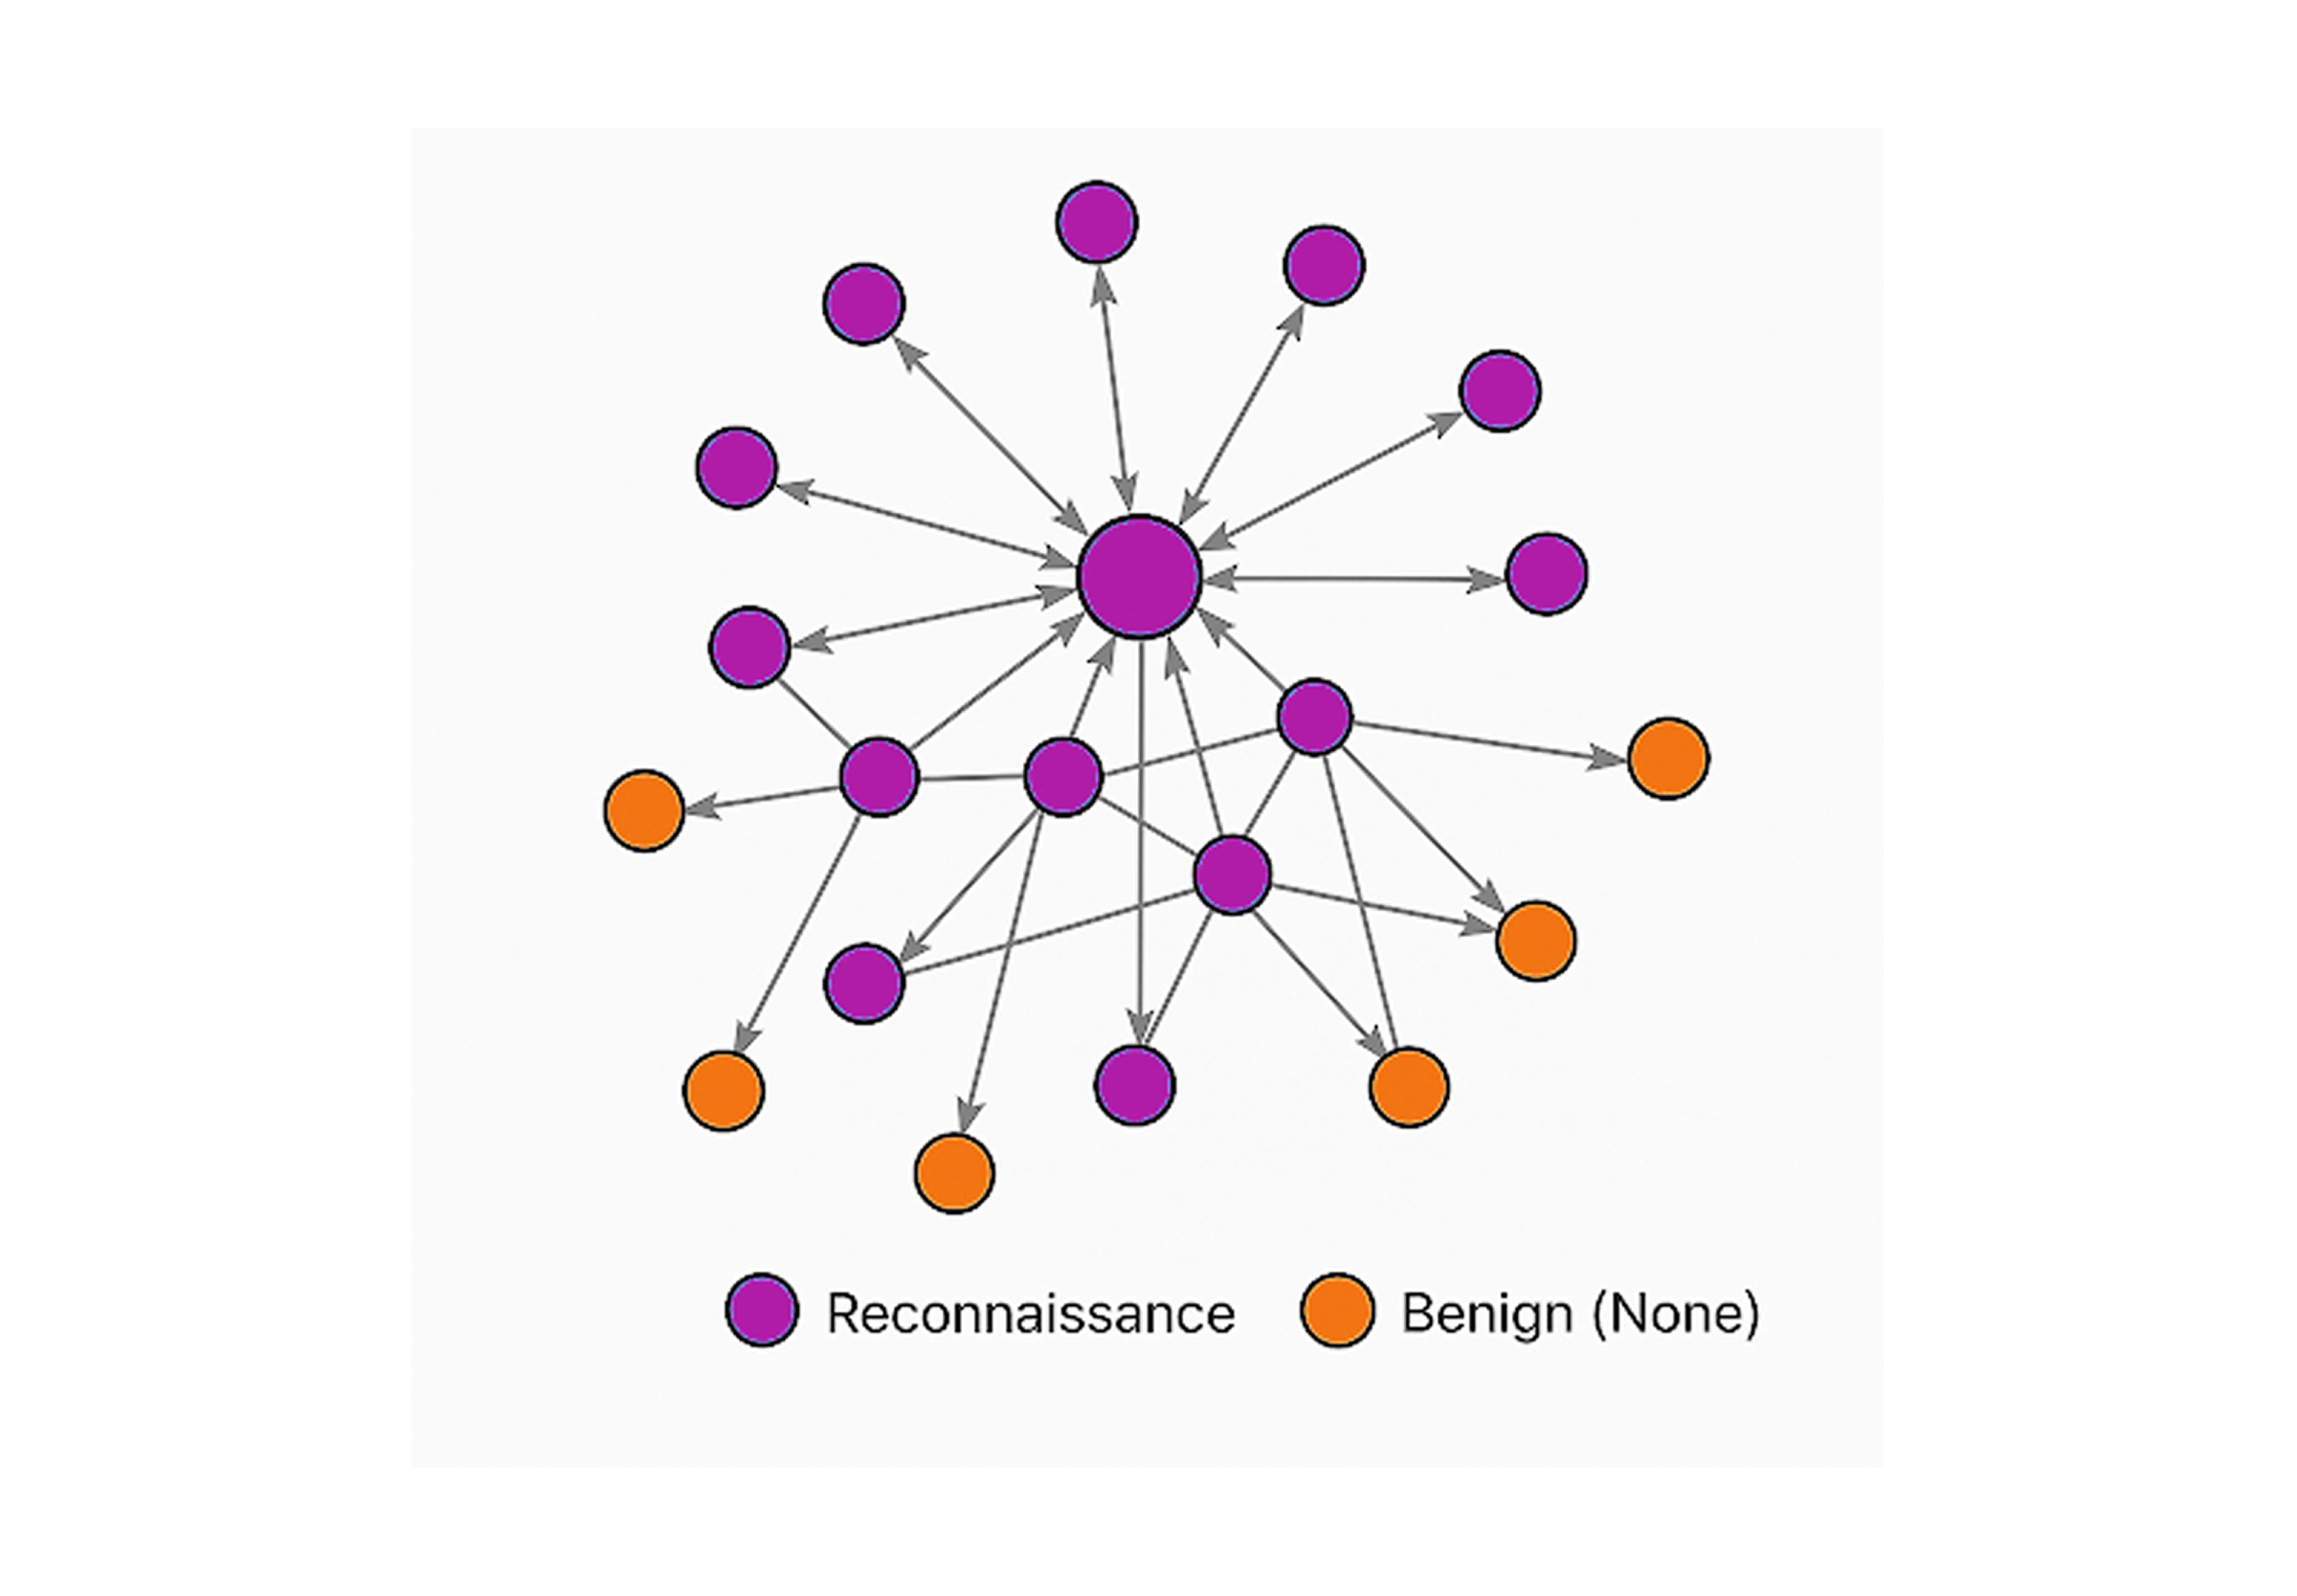
A recent study by Kizildag et al. (2024) demonstrated this approach in an industrial cybersecurity setting, using Memgraph to successfully detect reconnaissance activity through centrality metrics.
Smarter Detection. Faster Response.
Gartner agrees. Their research shows that relationship-driven approaches leads to better threat detection fidelity and analyst efficiency, resulting in faster responses. It helps analysts spend less time chasing dead ends and more time stopping real attacks.
Because in modern cybersecurity, the threat isn’t just the signal. It’s how the signals connect.
Stop drowning in indicators. Start investigating relationships.
With graph-driven threat intelligence, you get clarity, not chaos.
Want a deeper look at all five cybersecurity use cases enabled by graph technology?
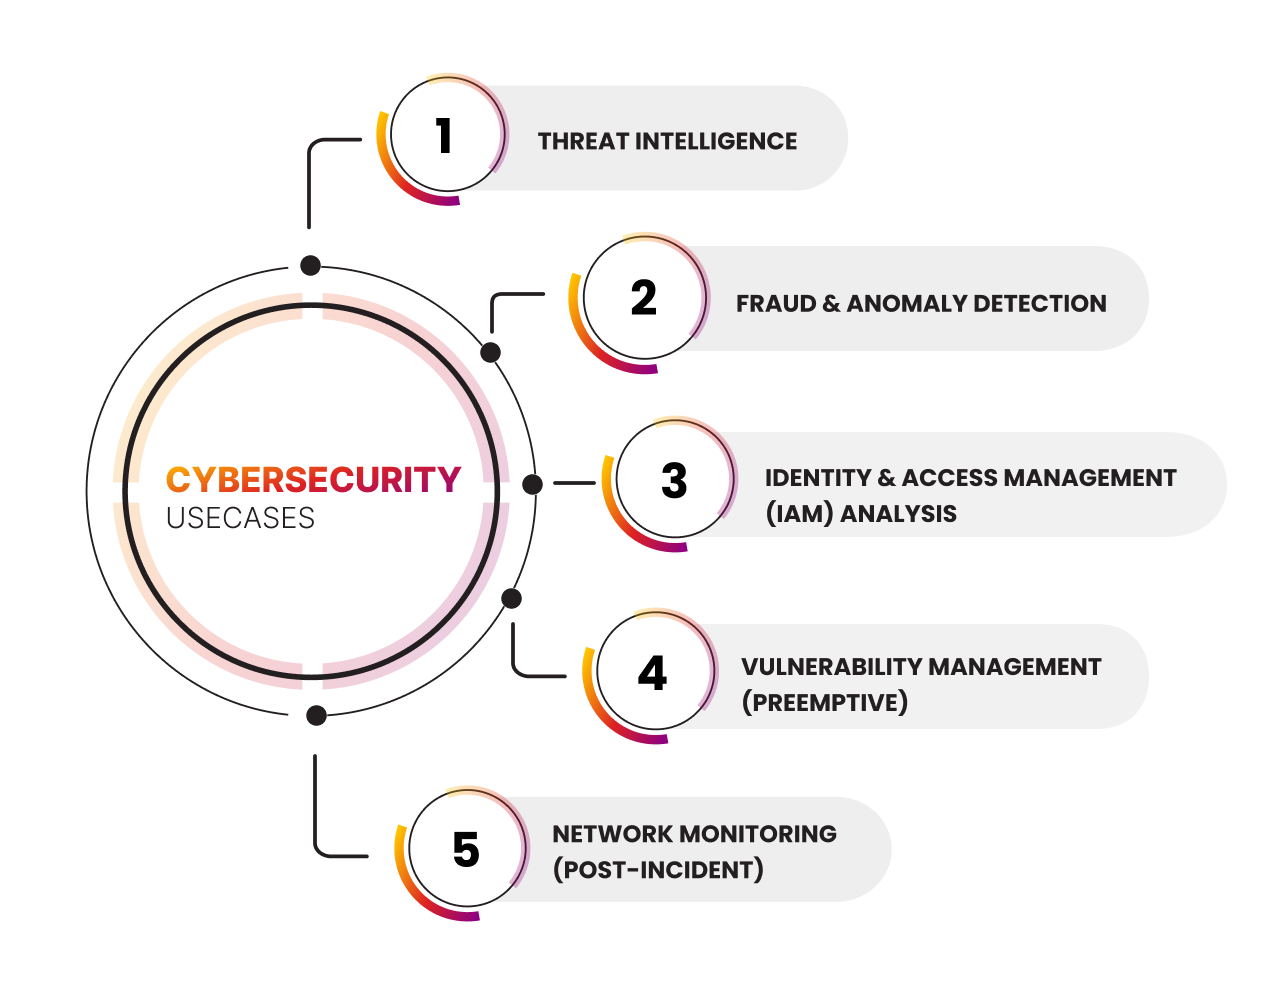
Download the full Cybersecurity Guide to explore practical insights and research-backed techniques.