Stay Ahead of Cyber Threats with Graph Databases
Digitalization in the 21st century has certainly taken off at a strong pace, with almost 91% of companies taking some form of digital initiative, while 87% of businesses are already making it a strategic objective for the upcoming years. It is certainly a positive advance in innovations, as people will reduce performing menial tasks in their day-to-day activities, and focus on expert knowledge acquired throughout the years. Digitalization requires moving a majority of company’s information to the internet, such as databases, on-prem or cloud storage, to make operations frictionless and as simple as possible.
The downside of this digitalization period is that information, if not protected by modern computer security standards, can be leaked or compromised by malicious attackers outside the company. The field of cybersecurity has become so broad, that new malware and exploits are discovered daily. This makes discovering and patching up antivirus and other protection software quite demanding.
Let’s look at the costs of loss cyber threats are responsible for in 2022. An average cost of a ransomware breach in the US was around $4.5 million, while a data breach costs around $4.3 million (source), totaling $45 billion. The most affected industries were healthcare, finance (banks and blockchain companies), and government companies, which tend to have outdated software due to time-consuming compliance features they need to meet.
However, don’t be depressed about the situation at hand, as we’re here to present how you can - as a cybersecurity company, or a company with threat analysis or a security office - detect and analyze threats and vulnerabilities in your system with graph databases and graph analytics, minimize the risk of data compromise and make your business and operations safe.
Outsmart even the smartest attackers
As cybersecurity attacks are criminal activity, attackers must be smart enough to design a proper tactic to successfully carry out the attack without being caught by the authorities. They target outdated software, such as government websites. It would be wrong to assume that government sectors have the best security out there. In reality, it takes a long time to meet all the security compliance requirements in all government sectors. Hence, they are an easy target in the starting phases of digitalization.
The aspect of the attackers' mindset that we’re concerned about is covering the traces of the attack. The key features of a good cyber attack are:
- The attack is a sequence of actions, rather than a 1-step malicious action.
- It’s impossible to perform root cause analysis to back-track to the attacker
- It’s impossible to analyze patterns after the attack, allowing to perform multiple other attacks in a similar fashion
Even if you had a tool that could detect well-thought-out cyber attacks, it wouldn’t be a perfect tool with a 100% success rate. But it would provide the source of the attack more quickly, as well as who the attacker is, what’s their IP, the mail used to transfer the file, etc.
Some of the best companies in the cybersecurity industry specialize in discovering vulnerabilities. Upon their findings, they update antivirus providers with new information so the software can be updated and stay up to date with the malicious actions. In order to discover new patterns and search quickly through the vast number of attacks that happen on a daily basis, they need to have tools that are able to traverse through the sequences of attacks and find out the necessary information about the files, actions and URLs that were included in the attack.
Relational databases are not a good fit for exploring sequences of actions
Since relational databases were one of the go-to tools for information retrieval, most tools in cybersecurity also relied on them to build their products. But are they in fact the most appropriate choice for the job? Let’s look at the actions attackers take and see how we can fit the information in a relational database and retrieve it.
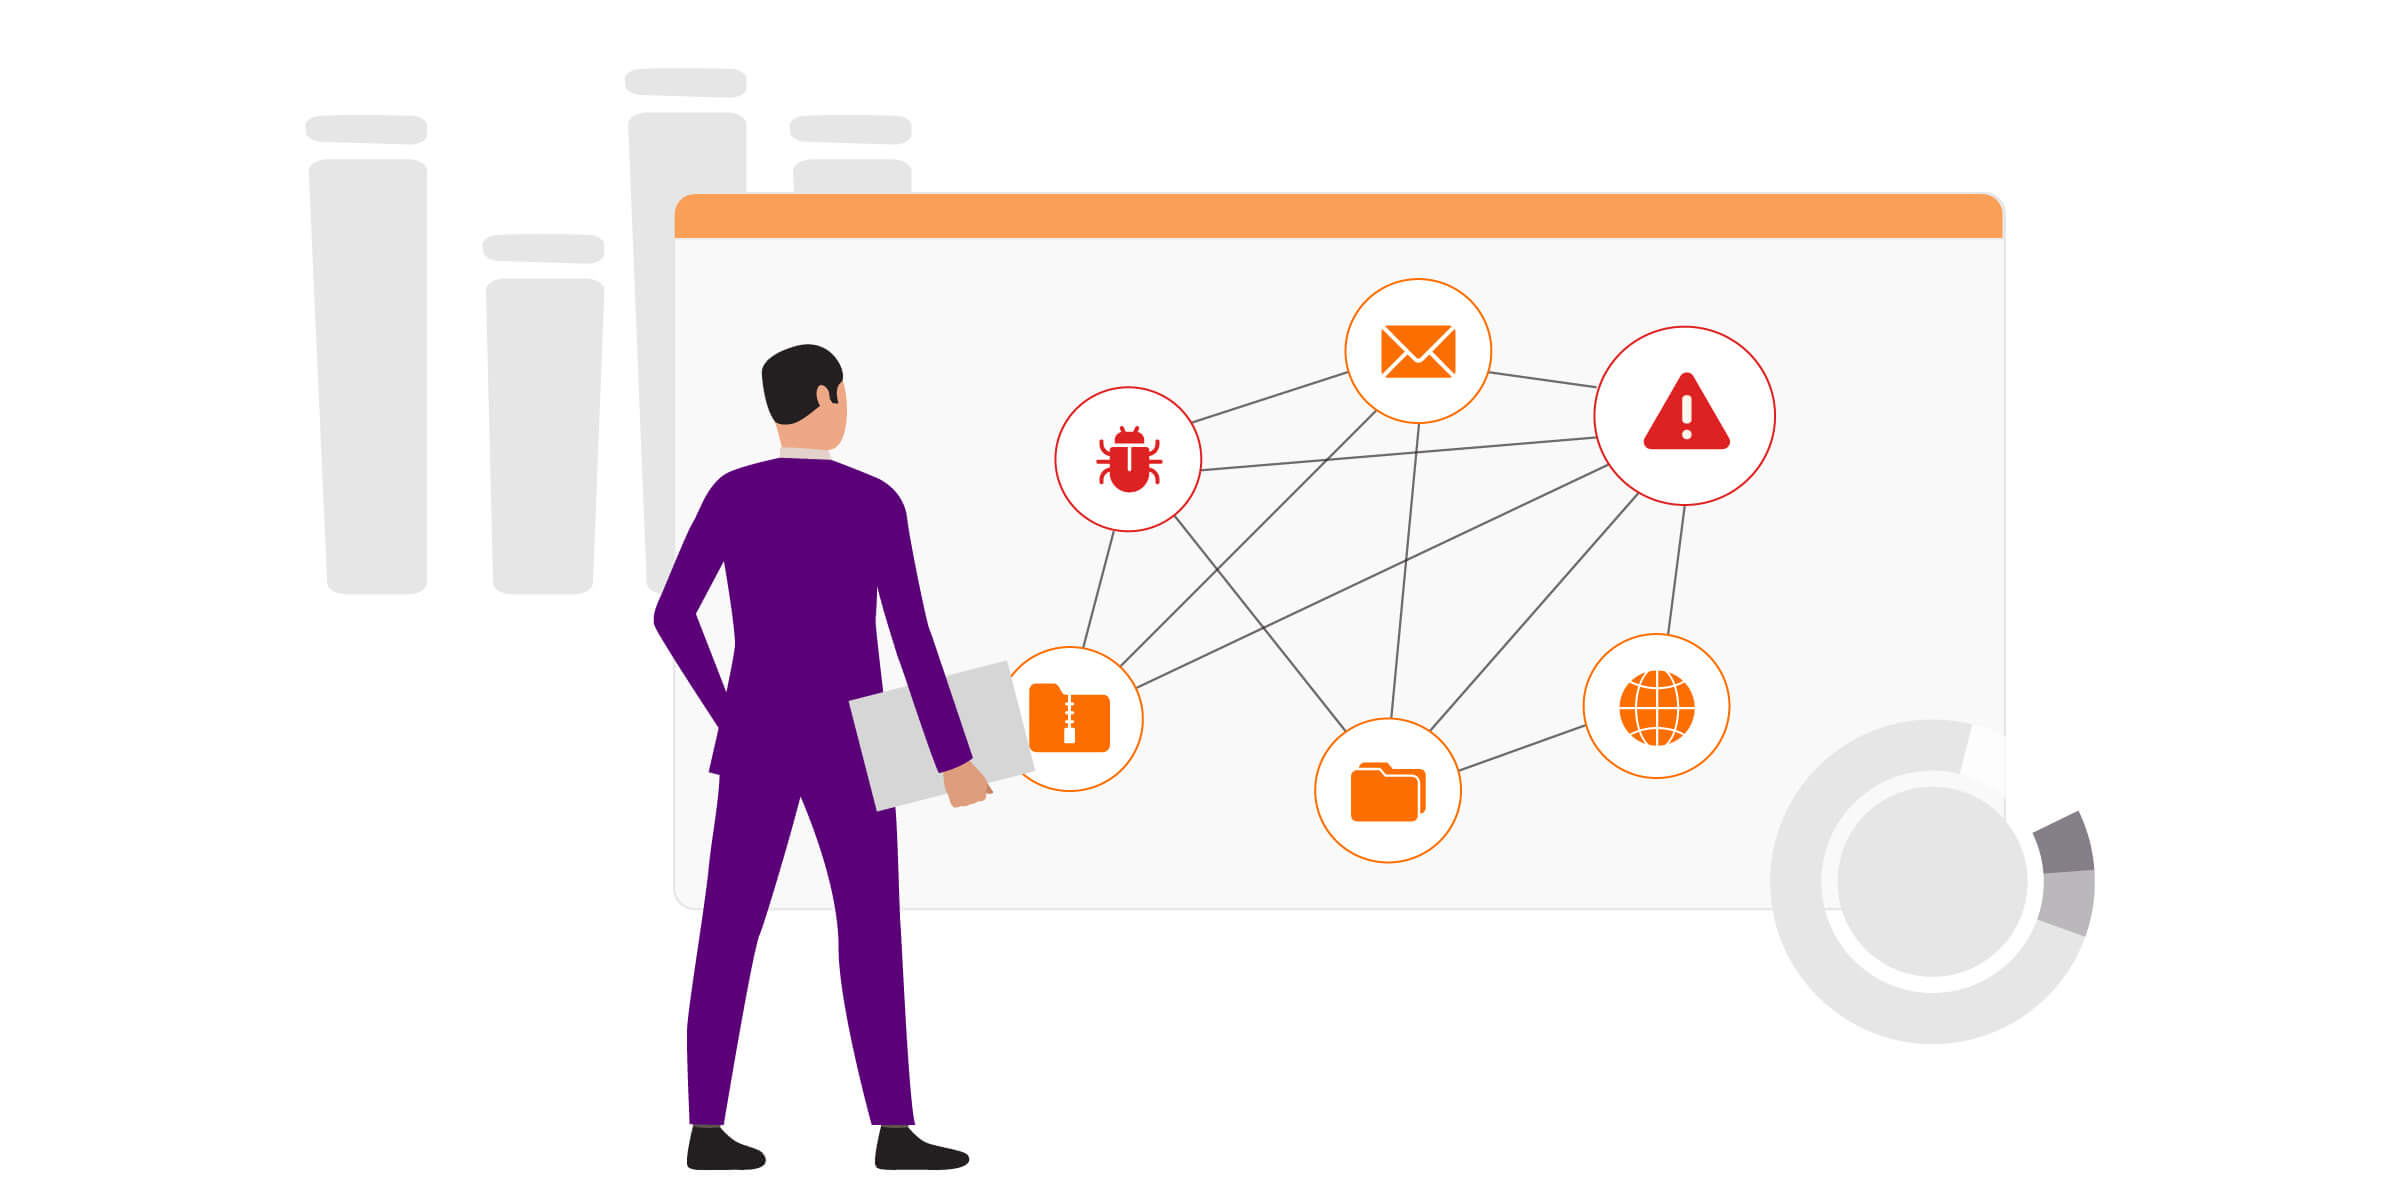
The picture below shows a sequence of actions taken before the actual attack was performed. An employee downloads a ZIP file from an e-mail that seems harmless. They unpack the file to get a few pictures. But among those pictures is an .exe file as well. The .exe file executes itself to fetch another, serious malware (ransomware, trojan horse, etc.) via the internet.
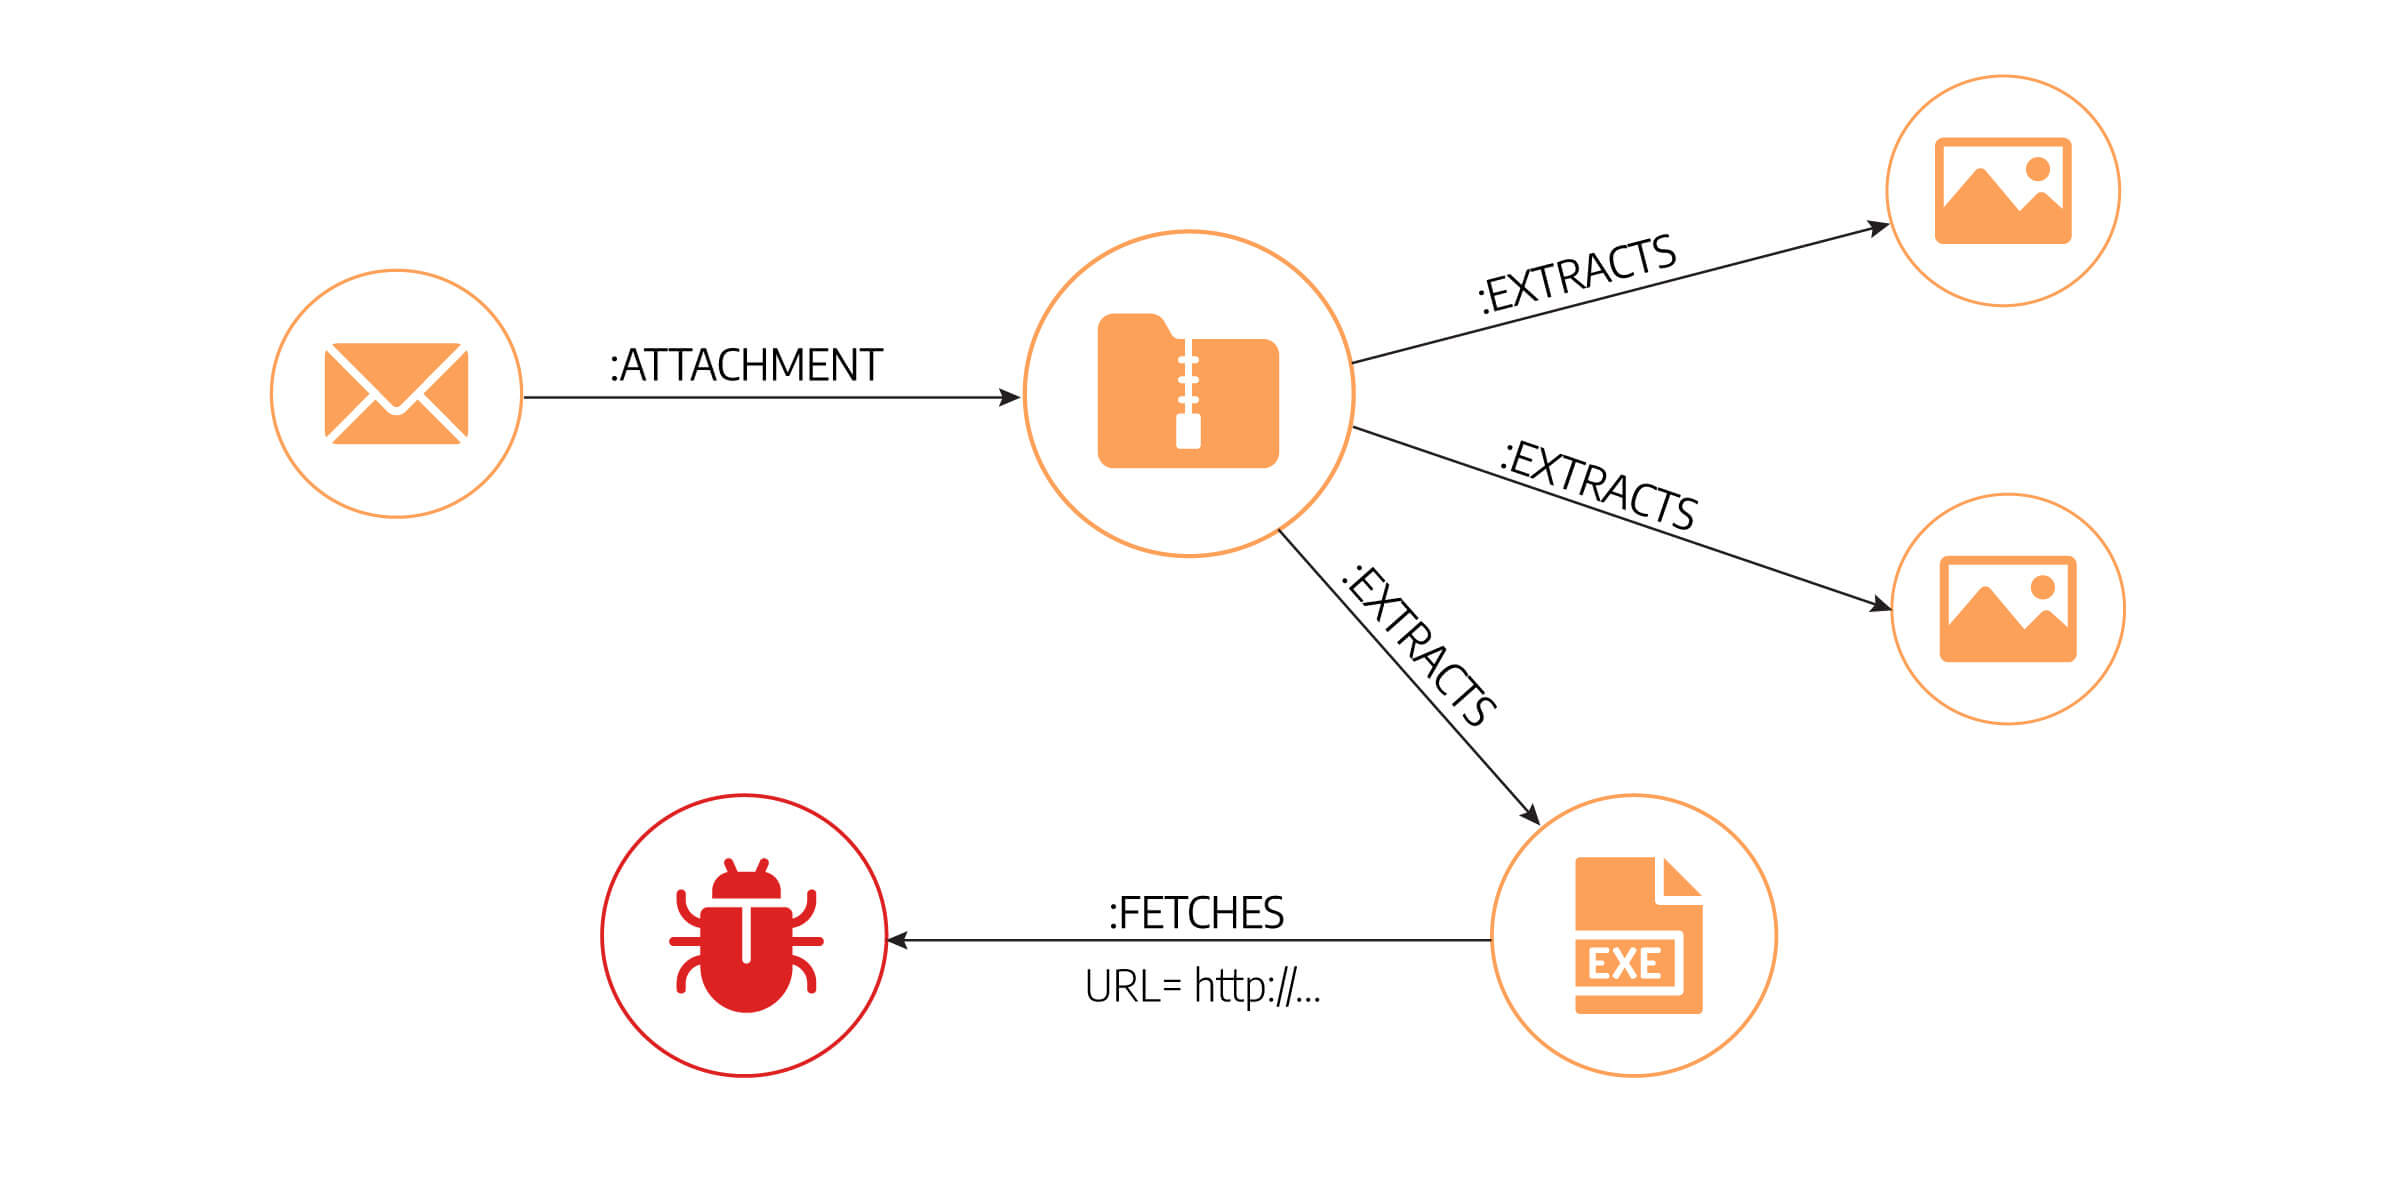
To retrieve the sequence of actions from the relational database, we would need to join similar tables in the database as many times as there are actions in the attack. The more actions in the attack, the more time it takes us to track the root of the attack, and the more time-consuming the next join is. We can clearly see that tabular data ordering is not a good choice for tracking interactions and neighboring sequences.
Moreover, relational databases cannot track patterns, as similar patterns also involve sequences of actions. Cyber security providers are therefore not able to track down similar attacks if they’re not exactly identical to previous ones and must rely on other methods.
Even if we somehow get the results from the relational database, we need to connect the dots. Tabular row display is not something we can draw conclusions from, and we would need a visual network display from the source (the attacker’s first act) to the target (the execution of the malware).
Use graph databases as optimal storage for cyber threat network
Fortunately, relational databases are not the only option you can use for the use case. In the 21st century, a lot of new database providers started to experiment with data representation in order to make it more efficient for certain operations. Cassandra, a wide-column database, is more suited for aggregation functions than SQL databases. ElasticSearch is a great tool for text search operations. In this chapter, we’ll dive into graph databases and see how their network type of data topology can help you analyze interactions between data entities.
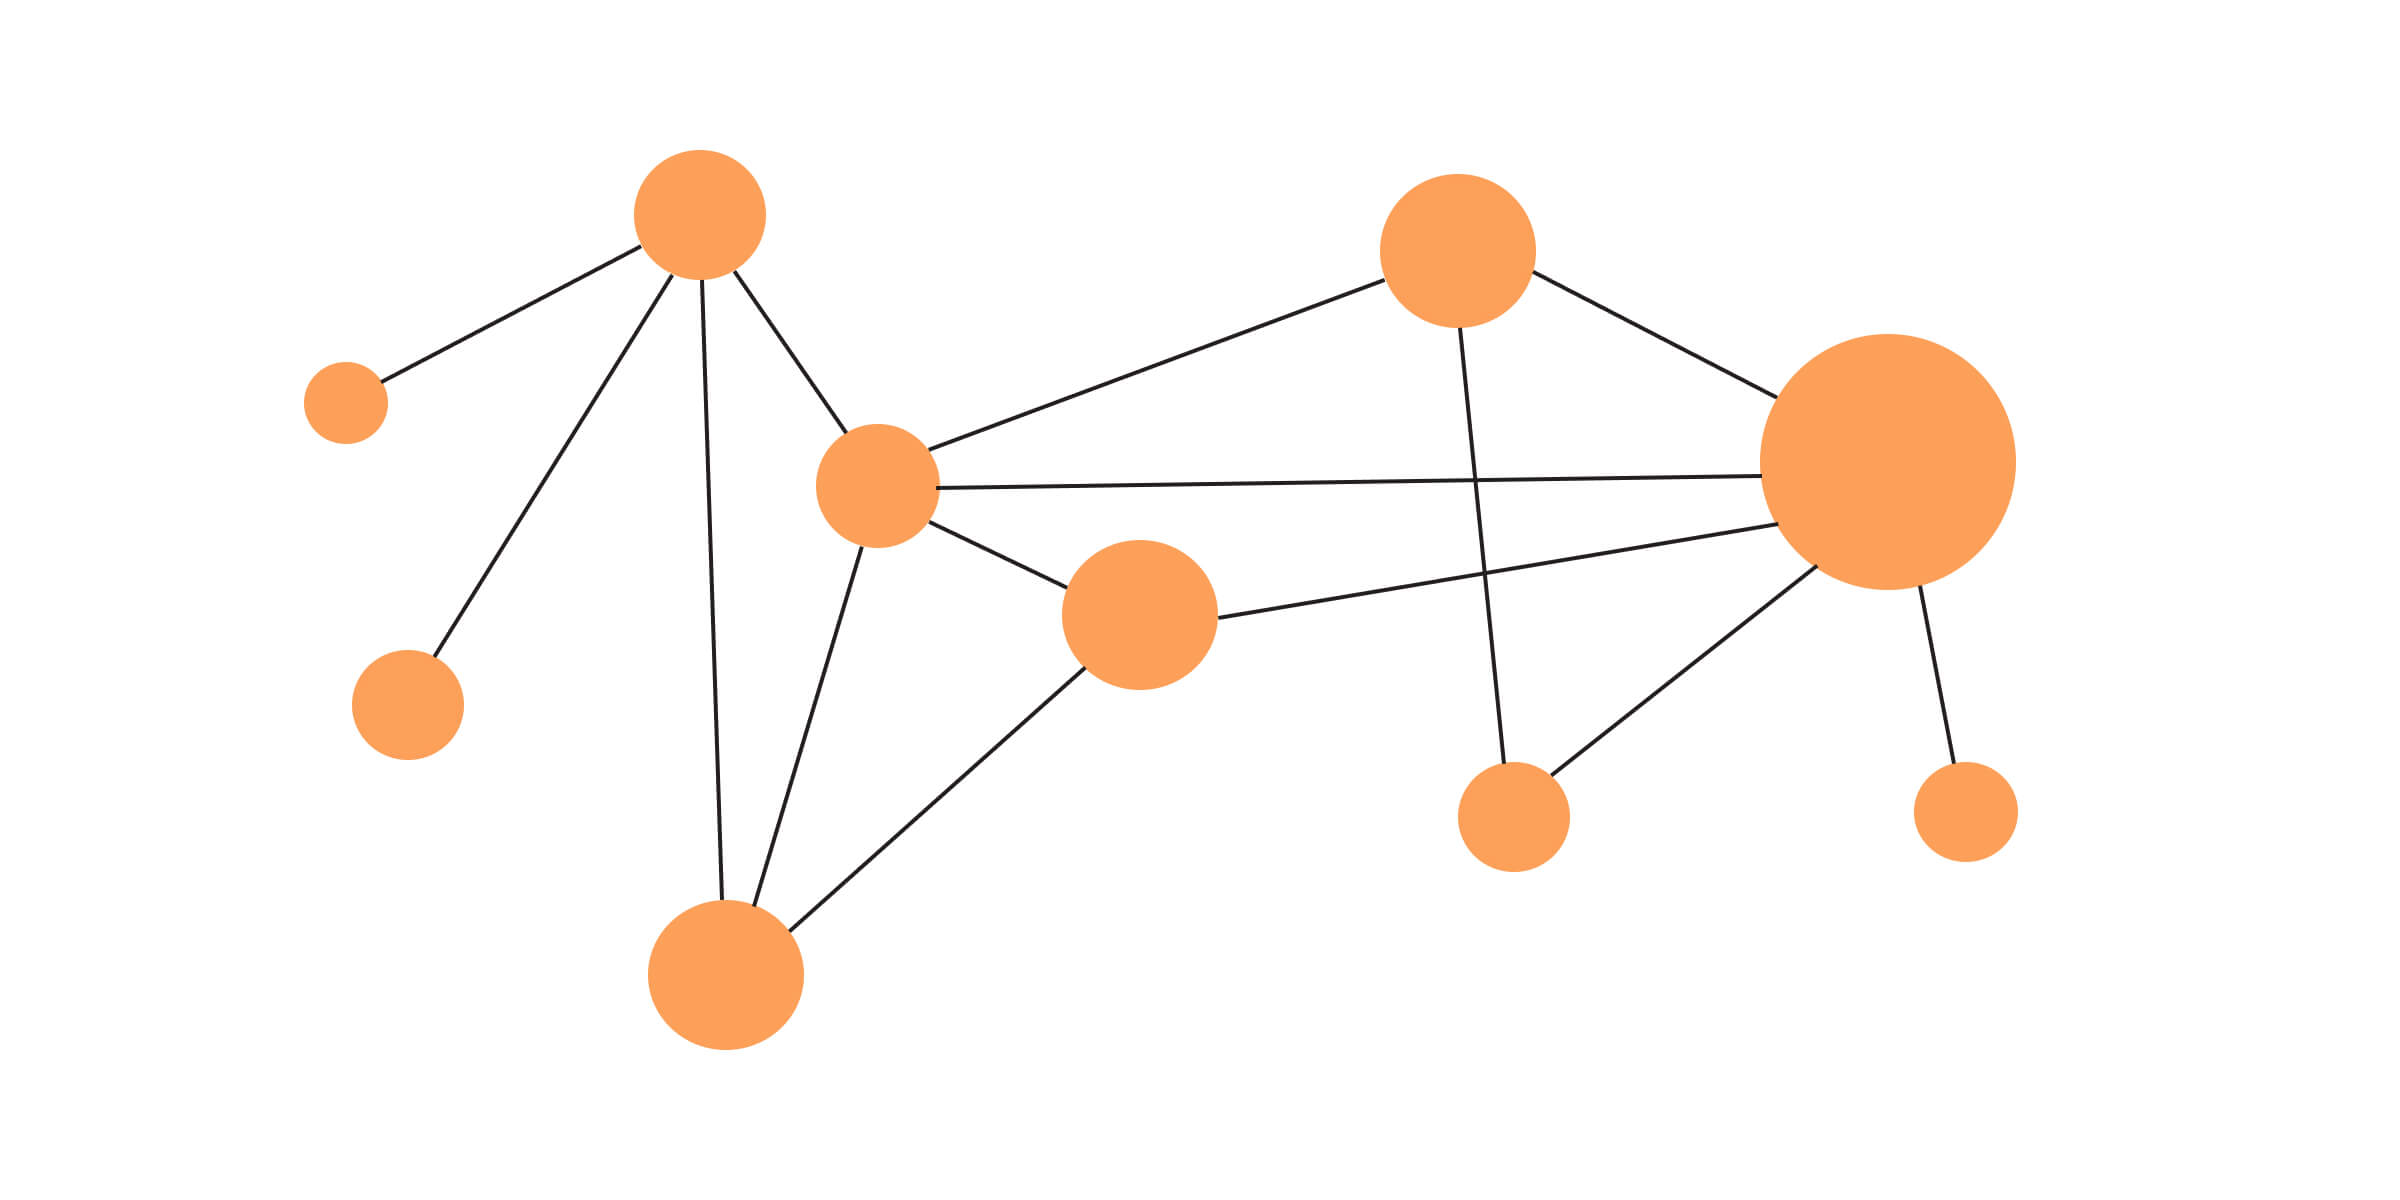
The first-class citizens in a graph database are nodes (also called vertices) and relationships (also called edges). Together in a database, they form a network of interconnected data, which can be of the same or different types. In the picture below, we can see a typical graph of connected nodes and relationships.
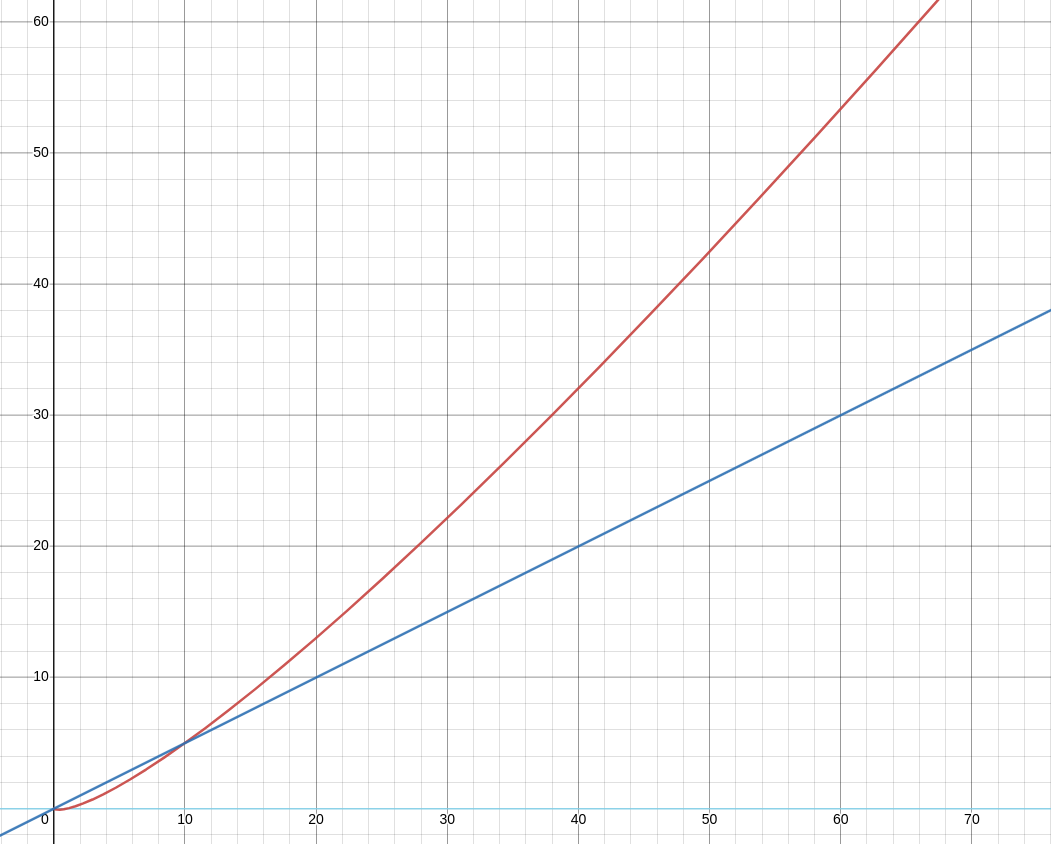
You can look at relationships as something similar to a foreign key in a relational database. That is the most important piece of a graph database - nodes are joined with each other via relationships to gain instant meaning in the storage. The end result - searching for an interconnected node takes constant time (for 1 node, linear for searching multiple nodes), instead of logarithmic in the case of SQL databases. In the picture below, we can see how the logarithmic time complexity margin (red line) grows exponentially when compared to linear time complexity (blue line) when searching through a graph database.
To depict performance improvements more closely, we can read the neighborhood walk story. In cybersecurity, it would be presented as getting joined information from the ZIP file and the contents of it. The ZIP file and the content file are two different entities, so they will probably be in different rows of the database.
If the goal is to discover the path leading towards the execution of the malicious file, it should be as easy to retrieve it, as it is to speak about it. However, not all data representations fit all use cases, and therefore tabular data representation performs suboptimally in a case when it is necessary to search through a chain of events that led to data corruption or loss.
Uncover behavior patterns with graph traversals and algorithms
We have presented a new way of representing data that offers a more performant pattern search. Graphs speed up the development of network-based use cases in various ways. To understand how you first need to understand the language of graphs.
As the number of JOINs increases, SQL databases fail to make a concise query and require explicit matching of all the necessary tables in order to connect all the dots. This event results in bulky queries which are sometimes hard to maintain if database migrations happen often.
As we mentioned earlier, graph databases are a perfect choice for exploring the graph from a specific starting point onwards. For that reason, graph database providers created a language called openCypher that can express queries naturally for graphs. Let’s look at the two queries below.
MATCH (n:ZIP_FILE {id:1})-[r:EXTRACTS_TO]->(m:File) RETURN n, r, m;The query above matches a specific ZIP file, and fetches all the information from the compressed file as well as the content file that it extracts to. There is no need to join data points since they are already joined during ingestion.
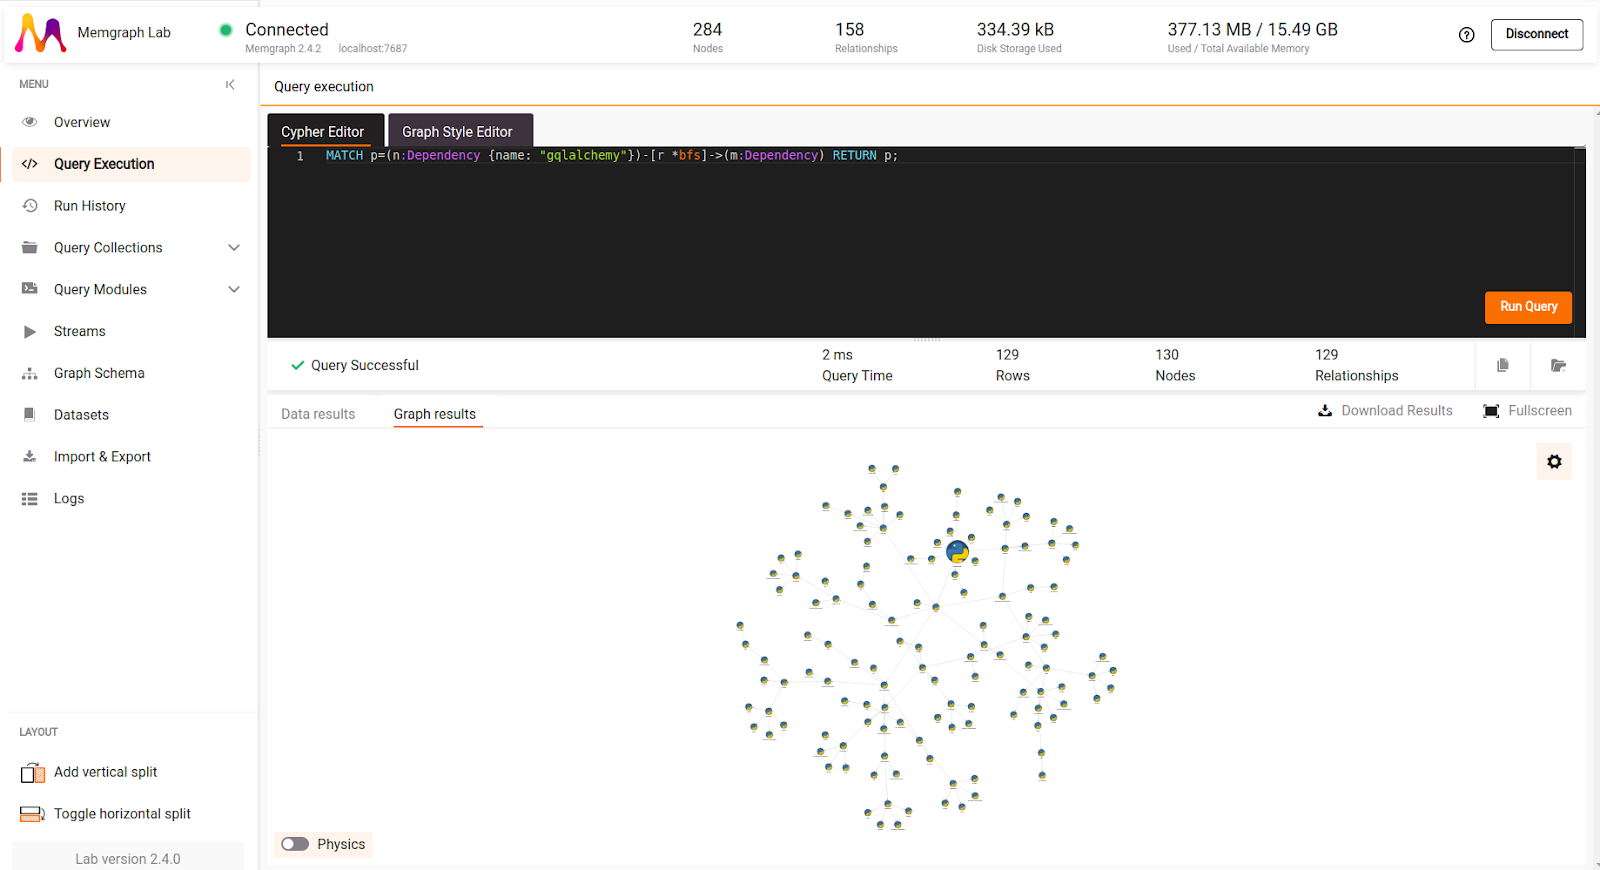
For a more complex traversal, graph database providers have used common traversal graph algorithms, like BFS, DFS, and Dijkstra, to assist users in exploring the graph and retrieving distant connections between nodes which are usually more than a few hops of relationships away from each other. In cybersecurity, it can be used for linking the outcome of a data compromise to the specific IP.
MATCH (n:USER_IP)-[r *BFS]->(m:DATA_COMPROMISE) RETURN n.ip, m.id;The beauty of it is we don’t need to know the actions between the attacker and the event that he has performed. We just need to know the source, and the target of the pattern, and the graph will be traversed in linear time, using graph algorithm optimization.
The graph data representation not only opens up a path to graph pathfinding algorithms but all the algorithms from graph theory. Usually, graph database providers have a list of supported graph algorithms that benefit data scientists and data analysts in providing meaningful insights for business.
Centrality algorithms like PageRank and betweenness centrality, or flow algorithms like maxflow, could be of great use to detect malicious behavior, identify anomalies in patterns of usage, and prevent attacks from happening in the first place.
Traceback cyber attacks to their source with visual display tools
Data and algorithms can answer many questions, but it often comes to company decision-makers to draw conclusions based on statistics and results, and drive the business towards success. For making optimal decisions, data needs to be visualized and represented to the user as best as possible. Tools like PowerBI, Tableau, and many more offer data visualizations with charts and plots, therefore making the process of concluding insights easier.
In the graph database world, things are shifting more towards graph platforms that offer all-in-one capabilities for making rapid application development and data analysis possible. Not only is there a database solution, which offers high performance for highly-connected data, but it also comes equipped with a graph algorithm library, as well as a graph visualization tool for query results.
In school, it was often easier to memorize facts by making a mental map, a network of connected information. This simple concept is now being used in databases as well. In cybersecurity, we can draw a parallel of a data network similar to how detectives used to connect the dots of pins with strings, and it quite matches the use case in the industry - finding the culprit in the sequence of malicious actions performed.
The decision-making process when analyzing data becomes much easier, as data can now be easily explained with a network of connected dots. It provides maximum visibility to the user and decreases the cost of maintenance with a single graph platform at disposal.
Conclusion
So graph databases offer the most performant storage tool for highly-connected data and a great amount of interactions between entities in the database. People sometimes don’t look at database pros and cons when building a prototype of the solution. That’s perfectly fine if you don’t have performance issues.
However, as the number of data points in your database grows, it’s always smart to look at alternatives, and consider a different storage representation. For cybersecurity, graph databases offer a unique solution to cover both performance issues with the rising number of malicious files and actions that need to be sanitized, as well as being able to answer your deepest questions and identify anomalies in your security network.